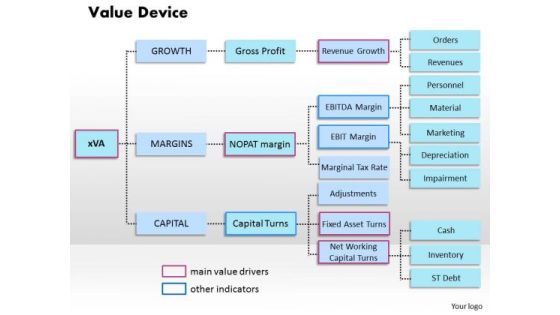
Powerpoint Diagrams

Colorful Pencil Diagram With Icons Powerpoint Template
This PowerPoint slide contains design of colorful pencil with icons. This slide helps to exhibit steps of entrepreneurial marketing. Use this to represent progressive order in business management. Download this business diagram to impress your viewers.
Five Arrows Diagram With Icons Powerpoint Templates
This PowerPoint slide contains design of arrows Infographic. This slide helps to exhibit steps of entrepreneurial marketing. Use this to represent progressive order in business management. Download this business diagram to impress your viewers.
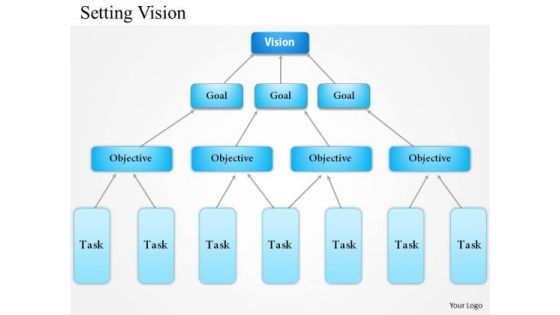
Business Diagram Setting Vision PowerPoint Template
This power point template business diagram has been crafted with graphic of three level organizational chart. This business diagram PPT contains the concept of setting vision. Use this PPT for your business and sales related presentations and explain your objectives and goal.

Business Diagram Change Management PowerPoint Ppt Presentation
This diagram displays model of change management. It contains graphics of arrow pointing towards performance target. This includes strategies of change management based on business process, organizations roles and skills, management systems and culture. Download this diagram as a tool for business presentations.

Roadmap Diagram For Planning PowerPoint Templates
Create visually amazing presentations with this slide of roadmap design. This slide of roadmap design clearly relates to concept of planning. Add this diagram in your presentations to visually support your content.
Linear Timeline Diagram With Icons Powerpoint Slides
This PowerPoint template has been designed with linear timeline graphics with icons. Download this timeline template design to display progress or the aims of your organization. This background can be changed, it is editable according to your requirements.

Our Vision Diagram With Photos Powerpoint Slides
This PowerPoint template displays pictures of corporate team members. You may download this PPT slide to depict corporate vision in convincing manner. Add this slide to your presentation and impress your superiors.

Hexagonal Timeline Diagram With Years Powerpoint Slides
This PowerPoint template has been designed with hexagonal graphics with years. Download this timeline template design to display progress or the aims of your organization. This background can be changed, it is editable according to your requirements.

Circular Core Diagram With Icons Powerpoint Template
Visually support your presentation with our above template of circular core diagram. This slide has been professionally designed to present four steps in circular order. This template offers an excellent background to build impressive presentation.
Four Steps Diagram With Icons Powerpoint Template
Our above template contains infographic design of four steps. Download this PPT slide to exhibit management of business functions. Use this eye-catchy slide to make unique business presentations.
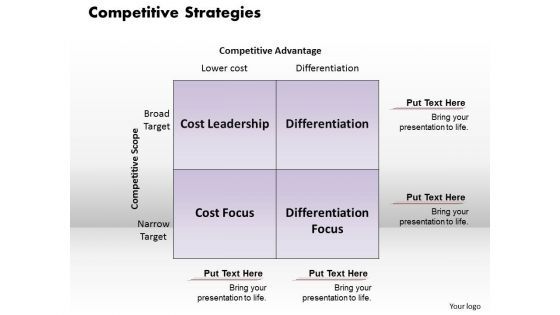
Business Diagram Competitive Strategies PowerPoint Ppt Presentation
Rake In The Dough With
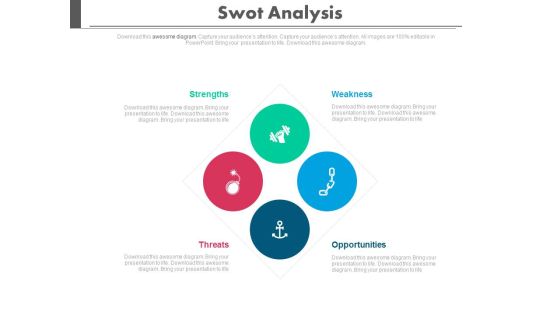
Swot Analysis Diagram For Business Powerpoint Template
Visually support your presentation with our above template showing graphics of SWOT analysis. This PPT slide has been professionally designed to present market research and analysis. This template offers an excellent background to build impressive presentation.

Analyzing Funding Options For Global Expansion Ppt PowerPoint Presentation Ppt PowerPoint Presentation Diagram Lists PDF
Crafting an eye-catching presentation has never been more straightforward. Let your presentation shine with this tasteful yet straightforward Analyzing Funding Options For Global Expansion Ppt PowerPoint Presentation Ppt PowerPoint Presentation Diagram Lists PDF template. It offers a minimalistic and classy look that is great for making a statement. The colors have been employed intelligently to add a bit of playfulness while still remaining professional. Construct the ideal Analyzing Funding Options For Global Expansion Ppt PowerPoint Presentation Ppt PowerPoint Presentation Diagram Lists PDF that effortlessly grabs the attention of your audience. Begin now and be certain to wow your customers.

Business Diagram Circular Puzzle Design 2 Stages PowerPoint Ttemplates Marketing Diagram
Get Out Of The Dock With Our Business_Diagram_Circular_Puzzle_Design_2_Stages_Powerpoint_Ttemplates_Marketing_Diagram Powerpoint Templates. Your Mind Will Be Set Free.

Ppt Summary Of 4 State PowerPoint Project Diagram Involved Mechanism Templates
PPT summary of 4 state powerpoint project diagram involved mechanism Templates-This diagram is a graphical illustration of the relationships between and among sets of data, groups of objects that share something in common. They are indicators of the path you have in mind.-PPT summary of 4 state powerpoint project diagram involved mechanism Templates-abstract, background, balance, business, circle, colorful, complement, concept, conceptual, connected, control, cooperation, design, gear, harmony, icon, ideal, illustration, involved, machine, progress, rhythm, round, shape, spin, support, system, teamwork, technology, together, wheel

Ppt 4 Steps In Planning Process Business PowerPoint Presentations Diagram Templates
PPT 4 steps in planning process business powerpoint presentations diagram Templates-This Rangoli Based PowerPoint Diagram shows the four step planning process in Circular Manner. It shows four Phases required in any Process related to Business. Use this Fascinating Diagram to make your Presentation delightful.-PPT 4 steps in planning process business powerpoint presentations diagram Templates

PowerPoint Theme Diagram Home H Missing Puzzle Piece Ppt Slide Designs
PowerPoint Theme Diagram Home H Missing Puzzle Piece PPT Slide Designs-This 3D Home PowerPoint diagram shows H Missing Puzzle Piece. This Business PowerPoint Template has a lot of space for writing your text. You can easily edit the size, position, text, color. -PowerPoint Theme Diagram Home H Missing Puzzle Piece PPT Slide Designs
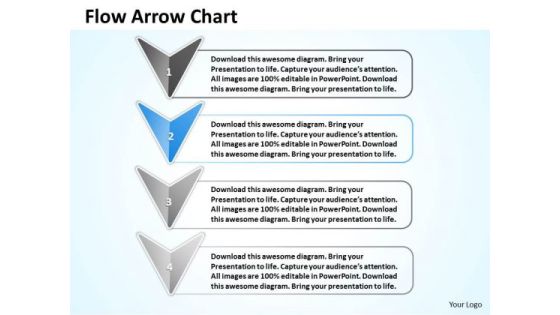
Ppt Stage 2 Continuous Demo Create Flow Chart PowerPoint Arrow Diagram Templates
PPT stage 2 continuous demo create flow chart powerpoint arrow diagram Templates-Use This Linearly Demonstrated PowerPoint Diagram having four steps displaying using arrow pointing towards south direction. It signifies the completion of the procedure and attaining success.-PPT stage 2 continuous demo create flow chart powerpoint arrow diagram Templates-3d, analyze, arrow, assess, background, bullet, business, chart, checkmark, chevron, diagram, drop, eps10, financial, glass, graphic, gray, icon, illustration, improvement, management, point, process, project, reflection, set, shadow, silver, stage, text, transparency, vector

Ppt Annular Illustration Of 3 State PowerPoint Template Diagram Using Arrow Templates
PPT annular illustration of 3 state powerpoint template diagram using arrow Templates-This PowerPoint diagram shows three circles connected with arrows. Circles defines path functions and arrows indicate the progression of the process-PPT annular illustration of 3 state powerpoint template diagram using arrow Templates-3d, Arrow, Bevel, Blue, Boy, Bright, Circular, Concept, Design, Fancy, Funky, Graphic, Icon, Illustration, Isolated, Logo, Male, Man, Reflection, Shinning, Sign, Symbol, Vivid

Ppt Blue Diamond Linear Procedure 7 State PowerPoint Template Diagram Templates
PPT blue diamond linear procedure 7 state powerpoint template diagram Templates-This PowerPoint Diagram allows quick visual View of multiple Steps. This is the most efficient method of transferring knowledge from the presenter to the audience-PPT blue diamond linear procedure 7 state powerpoint template diagram Templates-3d, Arrow, Bevel, Blue, Boy, Bright, Circular, Concept, Design, Fancy, Funky, Graphic, Icon, Illustration, Isolated, Logo, Male, Man, Reflection, Shinning, Sign, Symbol, Vivid
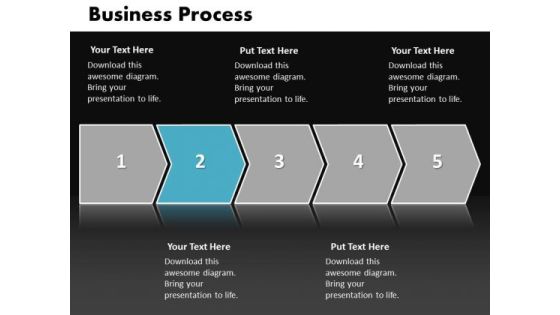
Ppt Direct Flow Business Pre Nursing Process PowerPoint Presentation Diagram Templates
PPT direct flow business pre nursing process powerpoint presentation diagram Templates-You can easily collaborate this PowerPoint diagram with colleagues to create detailed process diagrams and use them as a key element in streamlining your processes. The ideas and plans are on your fingertips. Now imprint them on the minds of your audience via our slides. -PPT direct flow business pre nursing process powerpoint presentation diagram Templates-3d, Arrow, Background, Banner, Business, Chart, Colorful, Diagram, Direction, Element, Financial, Flow, Gradient, Illustration, Isolated, Mirrored, Placeholder, Presentation, Process, Steps
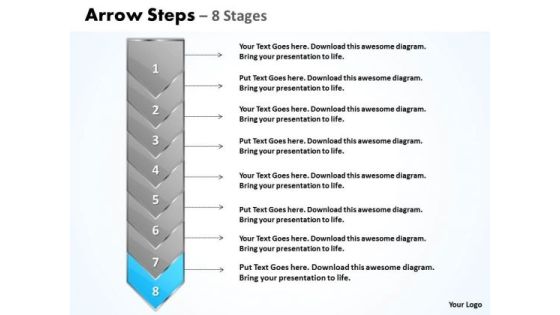
Process Ppt Template Eight State PowerPoint Project Diagram Demonstrated Arrow 9 Design
We present our process PPT template eight state PowerPoint project diagram demonstrated arrow 9 design. Use our Arrows PowerPoint Templates because, you have a great plan to put the pieces together, getting all the various contributors to gel for a successful completion. Use our Symbol PowerPoint Templates because, you have played a stellar role and have a few ideas. Use our Business PowerPoint Templates because, you are buzzing with ideas. Use our Process and flows PowerPoint Templates because, Stable ideas are the building blocks of a successful structure. Use our Abstract PowerPoint Templates because, the plans are in your head, stage by stage, year by year. Use these PowerPoint slides for presentations relating to Arrow, Background, Business, Chart, Diagram, Financial, Graphic, Gray, Icon, Illustration, Management, Orange, Perspective, Planning, Process, Stages, Steps, Text. The prominent colors used in the PowerPoint template are Blue, Gray, and White

Ppt Regular Flow Of 3 State PowerPoint Presentation Diagram Circular Arrow Templates
PPT regular flow of 3 state powerpoint presentation diagram circular arrow Templates-This Horizontal Diagram can be used for multiple purposes, including
Ppt Arrow Description Of 2 State PowerPoint Project Diagram Method Templates
PPT arrow description of 2 state powerpoint project diagram method Templates-This diagram is the sequence diagram that shows the flow of communication between two parties-PPT arrow description of 2 state powerpoint project diagram method Templates-Aim, Arrow, Arrowheads, Badge, Border, Click, Connection, Curve, Design, Direction, Download, Element, Fuchsia, Icon, Illustration, Indicator, Internet, Magenta, Mark, Object, Orientation, Pointer, Shadow, Shape, Sign

Building Strong Brand Equity For Business Growth Ppt PowerPoint Presentation Diagram PDF
This slide provides information regarding building effective brand equity in order to grow business across main and new markets. The purpose is to leverage relationships among perceived benefits and costs that customers relate to that product. Want to ace your presentation in front of a live audience. Our Building Strong Brand Equity For Business Growth Ppt PowerPoint Presentation Diagram PDF can help you do that by engaging all the users towards you. Slidegeeks experts have put their efforts and expertise into creating these impeccable powerpoint presentations so that you can communicate your ideas clearly. Moreover, all the templates are customizable, and easy to edit and downloadable. Use these for both personal and commercial use.

Ppt Linear Flow Arrow Business 2 State PowerPoint Presentation Diagram Templates
PPT linear flow arrow Business 2 state powerpoint presentation diagram Templates-This PPT shows Circular Arrows diagram can be used to show relationships between two parts of an overall concept.-PPT linear flow arrow Business 2 state powerpoint presentation diagram Templates-Abstract, Arrow, Arrow Chart, Business, Design, Development, Diagram, Direction, Element, Flow, Flow Chart, Flow Diagram, Flowchart, Graph, Linear, Management, Model, Motion, Organization, Plan, Process, Process Arrows, Process Chart, Process Diagram, Process Flow, Program, Section, Segment, Set, Sign, Solution, Strategy, Symbol, Technology
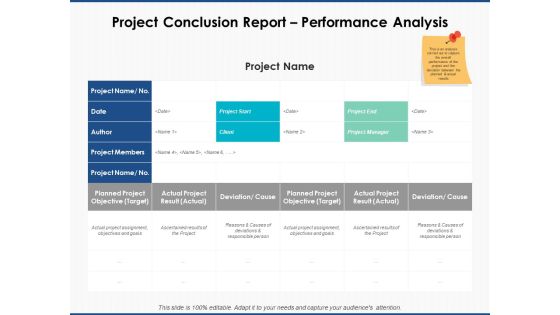
Project Conclusion Report Performance Analysis Ppt PowerPoint Presentation Diagram Graph Charts
This is a project conclusion report performance analysis ppt powerpoint presentation diagram graph charts. The topics discussed in this diagram are marketing, business, management, planning, strategy This is a completely editable PowerPoint presentation, and is available for immediate download.

Usa Ppt Background Linear Arrow 10 State PowerPoint Project Diagram 5 Image
USA PPT Background linear arrow 10 state powerpoint project diagram 5 Image-Use this diagram to emphasize the process of your corporate growth. Highlight your ideas broad- based on strong fundamentals and illustrate how they step by step achieve the set growth factor.-USA PPT Background linear arrow 10 state powerpoint project diagram 5 Image-Arrow, Background, Collection, Completed, Concept, Confirmation, Design, Flow, Graph, Graphic, Illustration, Indication, Indicator, Information, Instruction, Interface, Internet, Layout, Measurement, Order, Phase, Pointer, Process, Progress, Reflection, Scale, Shape, Sign
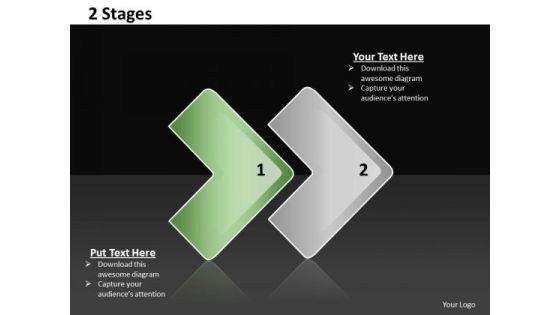
Ppt Linear Way To Show 2 State PowerPoint Presentation Diagram Templates
PPT linear way to show 2 state powerpoint presentation diagram Templates-Emphatically define your message with our above Diagram which contains a graphic of Linear model with its components. It symbolizes affiliation, affinity, alliance, association, connection etc. It shows the ninth stage with pink color.-PPT linear way to show 2 state powerpoint presentation diagram Templates-Aim, Arrow, Arrowheads, Badge, Border, Click, Connection, Curve, Design, Direction, Download, Element, Fuchsia, Icon, Illustration, Indicator, Internet, Magenta, Mark, Object, Orientation, Pointer, Shadow, Shape, Sign

Six Gears Business Growth Factors Ppt PowerPoint Presentation Diagram Graph Charts
This is a six gears business growth factors ppt powerpoint presentation diagram graph charts. This is a seven stage process. The stages in this process are growth opportunity, growth drivers, market drivers.

Improve Sales Performance And Productivity Ppt PowerPoint Presentation Diagram Graph Charts
This is a improve sales performance and productivity ppt powerpoint presentation diagram graph charts. This is a four stage process. The stages in this process are marketing effort, branding initiative, marketing initiatives.

Smart Grid Architectural Framework Information And Communication Technology Ppt Powerpoint Presentation Diagram Graph Charts
This is a smart grid architectural framework information and communication technology ppt powerpoint presentation diagram graph charts. This is a three stage process. The stages in this process are functional architecture, functional planning, functional designing.
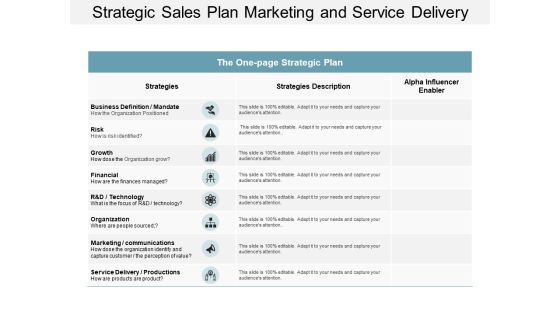
Strategic Sales Plan Marketing And Service Delivery Ppt Powerpoint Presentation Diagram Graph Charts
This is a strategic sales plan marketing and service delivery ppt powerpoint presentation diagram graph charts. This is a three stage process. The stages in this process are one page strategy, one page plan, one page approach.
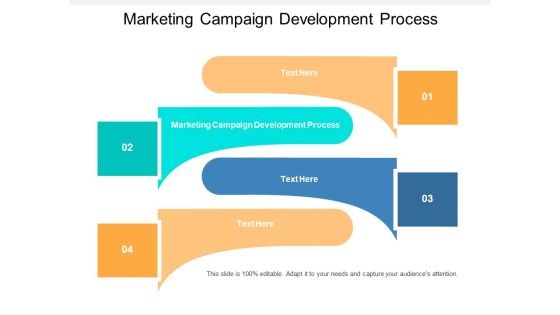
Marketing Campaign Development Process Ppt PowerPoint Presentation Diagram Graph Charts Cpb
This is a marketing campaign development process ppt powerpoint presentation diagram graph charts cpb. This is a four stage process. The stages in this process are marketing campaign development process.

Timeline For Application Development Design Implement And Release Ppt PowerPoint Presentation Diagram Graph Charts
This is a timeline for application development design implement and release ppt powerpoint presentation diagram graph charts. This is a five stage process. The stages in this process are overlapping timeline, overlapping roadmap, overlapping linear roadmap.
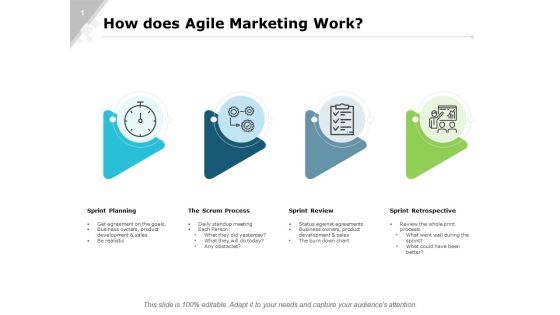
How Does Agile Marketing Work Ppt PowerPoint Presentation Diagram Graph Charts
This is a how does agile marketing work ppt powerpoint presentation diagram graph charts. This is a four stage process. The stages in this process are business, planning, strategy, marketing, management.

Fixed Income Securities Top Performing Bonds Ppt PowerPoint Presentation Diagram Graph Charts
This is a fixed income securities top performing bonds ppt powerpoint presentation diagram graph charts. This is a two stage process. The stages in this process are compare, marketing, business, management, planning.
Eight Market Analysis Process Steps With Icons Ppt Powerpoint Presentation Diagram Templates
This is a eight market analysis process steps with icons ppt powerpoint presentation diagram templates. This is a eight stage process. The stages in this process are 7 point infographic, 7 steps infographic, 7 stages infographic.

Scatter With Smooth Lines And Markers Ppt PowerPoint Presentation Diagram Lists
This is a scatter with smooth lines and markers ppt powerpoint presentation diagram lists. This is a two stage process. The stages in this process are finance, marketing, analysis, business, investment.

Monthly Recurring Revenue Churn Template 2 Ppt PowerPoint Presentation Diagram Images
This is a monthly recurring revenue churn template 2 ppt powerpoint presentation diagram images. This is a eleven stage process. The stages in this process are bar graph, growth, success, business, marketing.
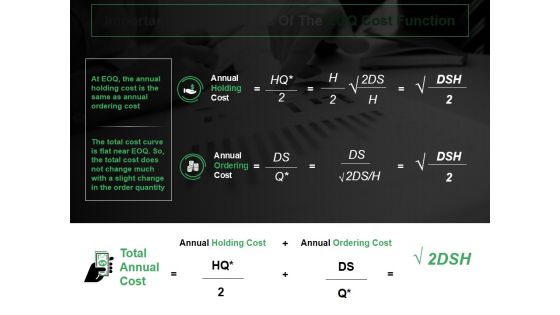
Important Characteristics Of The Eoq Cost Function Ppt PowerPoint Presentation Diagram Images
This is a important characteristics of the eoq cost function ppt powerpoint presentation diagram images. This is a two stage process. The stages in this process are annual holding cos, annual ordering cost, total annual cost.
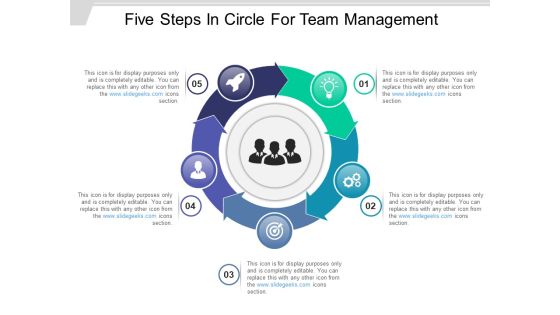
Five Steps In Circle For Team Management Ppt PowerPoint Presentation Diagram Templates
This is a five steps in circle for team management ppt powerpoint presentation diagram templates. This is a five stage process. The stages in this process are 5 stages circular arrows, 5 steps circle arrows, 5 stages cycle arrows.

Financial Crisis Dollar And Puzzle Pieces Ppt PowerPoint Presentation Diagram Templates
This is a financial crisis dollar and puzzle pieces ppt powerpoint presentation diagram templates. This is a one stage process. The stages in this process are mutual funds, funds to buy, investment slide.

Self Improvement Strategies Channel Partner Strategy Transition Plans Ppt PowerPoint Presentation Diagram Lists
This is a self improvement strategies channel partner strategy transition plans ppt powerpoint presentation diagram lists. This is a five stage process. The stages in this process are self improvement strategies, channel partner strategy, transition plans.

Stages Of Product Development Ideate And Prototype Ppt Powerpoint Presentation Diagram Ppt
This is a stages of product development ideate and prototype ppt powerpoint presentation diagram ppt. This is a five stage process. The stages in this process are new product development, new product launch, introducing new product.

Bill Invoice With Quantity And Price Ppt Powerpoint Presentation Diagram Ppt
This is a bill invoice with quantity and price ppt powerpoint presentation diagram ppt. This is a four stage process. The stages in this process are billing process, billing procedure, billing cycle.
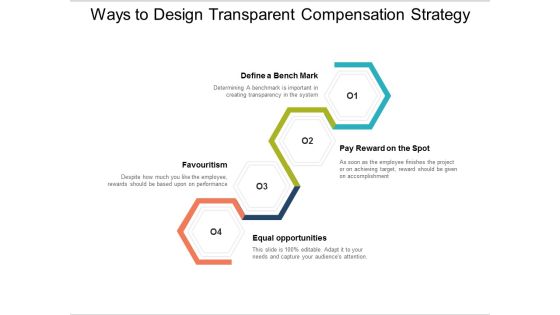
Ways To Design Transparent Compensation Strategy Ppt PowerPoint Presentation Diagram Lists
This is a ways to design transparent compensation strategy ppt powerpoint presentation diagram lists. This is a four stage process. The stages in this process are business, management, total reward.

Ppt Linear Flow Of Process Using 4 State PowerPoint Presentation Diagram Templates
PPT linear flow of process using 4 state powerpoint presentation diagram Templates-This templatehelps you chart the course of your presentation. The concept and strategy is your strength. Our template will help pinpoint their viability.-PPT linear flow of process using 4 state powerpoint presentation diagram Templates-Aim, Arrow, Arrowheads, Badge, Border, Click, Connection, Curve, Design, Direction, Download, Element, Fuchsia, Icon, Illustration, Indicator, Internet, Magenta, Mark, Object, Orientation, Pointer, Shadow, Shape, Sign

Table Of Contents For CPS Technologies Grid Ppt PowerPoint Presentation Diagram Templates PDF
Are you searching for a Table Of Contents For CPS Technologies Grid Ppt PowerPoint Presentation Diagram Templates PDF that is uncluttered, straightforward, and original Its easy to edit, and you can change the colors to suit your personal or business branding. For a presentation that expresses how much effort you have put in, this template is ideal With all of its features, including tables, diagrams, statistics, and lists, its perfect for a business plan presentation. Make your ideas more appealing with these professional slides. Download Table Of Contents For CPS Technologies Grid Ppt PowerPoint Presentation Diagram Templates PDF from Slidegeeks today.

Comparing Equity Funding Sources For Global Expansion Ppt PowerPoint Presentation Diagram Images PDF
Are you searching for a Comparing Equity Funding Sources For Global Expansion Ppt PowerPoint Presentation Diagram Images PDF that is uncluttered, straightforward, and original Its easy to edit, and you can change the colors to suit your personal or business branding. For a presentation that expresses how much effort you have put in, this template is ideal With all of its features, including tables, diagrams, statistics, and lists, its perfect for a business plan presentation. Make your ideas more appealing with these professional slides. Download Comparing Equity Funding Sources For Global Expansion Ppt PowerPoint Presentation Diagram Images PDF from Slidegeeks today.

Intelligent Manufacturing Meet Our Team Ppt PowerPoint Presentation Diagram Images PDF
Are you searching for a Intelligent Manufacturing Meet Our Team Ppt PowerPoint Presentation Diagram Images PDF that is uncluttered, straightforward, and original Its easy to edit, and you can change the colors to suit your personal or business branding. For a presentation that expresses how much effort you have put in, this template is ideal. With all of its features, including tables, diagrams, statistics, and lists, its perfect for a business plan presentation. Make your ideas more appealing with these professional slides. Download Intelligent Manufacturing Meet Our Team Ppt PowerPoint Presentation Diagram Images PDF from Slidegeeks today.

Impact Of Cyber Security Policies And Practices Ppt PowerPoint Presentation Diagram Graph Charts PDF
The following slide focuses on drafting cyber security policies to manage data control and breach. It mainly includes elements such as impact of existing cyber safety policies, mitigation actions, Presenting this PowerPoint presentation, titled Impact Of Cyber Security Policies And Practices Ppt PowerPoint Presentation Diagram Graph Charts PDF, with topics curated by our researchers after extensive research. This editable presentation is available for immediate download and provides attractive features when used. Download now and captivate your audience. Presenting this Impact Of Cyber Security Policies And Practices Ppt PowerPoint Presentation Diagram Graph Charts PDF. Our researchers have carefully researched and created these slides with all aspects taken into consideration. This is a completely customizable Impact Of Cyber Security Policies And Practices Ppt PowerPoint Presentation Diagram Graph Charts PDF that is available for immediate downloading. Download now and make an impact on your audience. Highlight the attractive features available with our PPTs.
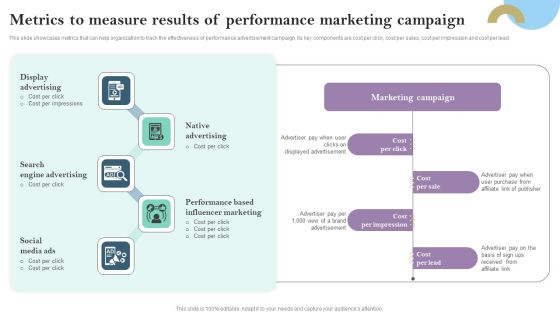
Metrics To Measure Results Of Performance Marketing Campaign Ppt PowerPoint Presentation Diagram Graph Charts PDF
This slide showcases metrics that can help organization to track the effectiveness of performance advertisement campaign. Its key components are cost per click, cost per sales, cost per impression and cost per lead Presenting this PowerPoint presentation, titled Metrics To Measure Results Of Performance Marketing Campaign Ppt PowerPoint Presentation Diagram Graph Charts PDF, with topics curated by our researchers after extensive research. This editable presentation is available for immediate download and provides attractive features when used. Download now and captivate your audience. Presenting this Metrics To Measure Results Of Performance Marketing Campaign Ppt PowerPoint Presentation Diagram Graph Charts PDF. Our researchers have carefully researched and created these slides with all aspects taken into consideration. This is a completely customizable Metrics To Measure Results Of Performance Marketing Campaign Ppt PowerPoint Presentation Diagram Graph Charts PDF that is available for immediate downloading. Download now and make an impact on your audience. Highlight the attractive features available with our PPTs.

AMR Robot Dashboard To Track Autonomous Mobile Robot Performance Ppt PowerPoint Presentation Diagram Images PDF
This slide represents the dashboard to track the AMRs performance in the warehouse. It covers various AMRs status reports, energy consumption, battery level, total working hours, and time to return. Presenting this PowerPoint presentation, titled AMR Robot Dashboard To Track Autonomous Mobile Robot Performance Ppt PowerPoint Presentation Diagram Images PDF, with topics curated by our researchers after extensive research. This editable presentation is available for immediate download and provides attractive features when used. Download now and captivate your audience. Presenting this AMR Robot Dashboard To Track Autonomous Mobile Robot Performance Ppt PowerPoint Presentation Diagram Images PDF. Our researchers have carefully researched and created these slides with all aspects taken into consideration. This is a completely customizable AMR Robot Dashboard To Track Autonomous Mobile Robot Performance Ppt PowerPoint Presentation Diagram Images PDF that is available for immediate downloading. Download now and make an impact on your audience. Highlight the attractive features available with our PPTs.

Dashboard For Our Successful Digital Twin Model Ppt PowerPoint Presentation Diagram Templates PDF
This slide represents the digital twin technology dashboard that covers the details of the city, such as the status of CCTVs, buses, street lights, environment sensors, and so on. Presenting this PowerPoint presentation, titled Dashboard For Our Successful Digital Twin Model Ppt PowerPoint Presentation Diagram Templates PDF, with topics curated by our researchers after extensive research. This editable presentation is available for immediate download and provides attractive features when used. Download now and captivate your audience. Presenting this Dashboard For Our Successful Digital Twin Model Ppt PowerPoint Presentation Diagram Templates PDF. Our researchers have carefully researched and created these slides with all aspects taken into consideration. This is a completely customizable Dashboard For Our Successful Digital Twin Model Ppt PowerPoint Presentation Diagram Templates PDF that is available for immediate downloading. Download now and make an impact on your audience. Highlight the attractive features available with our PPTs.

Usa Ppt Background Linear Arrow 10 State PowerPoint Project Diagram 6 Image
USA PPT Background linear arrow 10 state powerpoint project diagram 6 Image-Use this diagram to display your ideas and highlight their ability to accelerate the growth of your company and you. Impress upon the audience how your strategy will carry all to the top of the corporate heap.-USA PPT Background linear arrow 10 state powerpoint project diagram 6 Image-Arrow, Background, Collection, Completed, Concept, Confirmation, Design, Flow, Graph, Graphic, Illustration, Indication, Indicator, Information, Instruction, Interface, Internet, Layout, Measurement, Order, Phase, Pointer, Process, Progress, Reflection, Scale, Shape, Sign

Ppt Cyan Diamond Successive Practice 5 State PowerPoint Project Diagram Templates
PPT cyan diamond successive practice 5 state powerpoint project diagram Templates-These diamonds are the tools that helped most of us evolve. Use them to help you organize the logic of your views. The color and design used in this diagram is so attractive that can help you to make your presentation simply stunning.-PPT cyan diamond successive practice 5 state powerpoint project diagram Templates-Advertise, Advertisement, Badge, Box, Business, Card, Collection, Column, Corporate, Costing, Counting, Design, Discount, Element, Featured, Finance, Grid, Hosting, Information, List, Message, Placard, Plan, Price, Pricing, Rectangle, Report, Round

Overview Of Multinational Strategy For Global Expansion Ppt PowerPoint Presentation Diagram Images PDF
This slide showcases overview of expanding globally using multinational strategy. It also showcases advantages which are specialisation in production, outsourcing benefits, economies of scale and reduced taxes.Presenting this PowerPoint presentation, titled Overview Of Multinational Strategy For Global Expansion Ppt PowerPoint Presentation Diagram Images PDF, with topics curated by our researchers after extensive research. This editable presentation is available for immediate download and provides attractive features when used. Download now and captivate your audience. Presenting this Overview Of Multinational Strategy For Global Expansion Ppt PowerPoint Presentation Diagram Images PDF. Our researchers have carefully researched and created these slides with all aspects taken into consideration. This is a completely customizable Overview Of Multinational Strategy For Global Expansion Ppt PowerPoint Presentation Diagram Images PDF that is available for immediate downloading. Download now and make an impact on your audience. Highlight the attractive features available with our PPTs.
 Home
Home
