Power Bi Dashboard

Interactive Dashboard Examples Ppt Samples Download
This is a interactive dashboard examples ppt samples download. This is a two stage process. The stages in this process are call quality, network utilization.
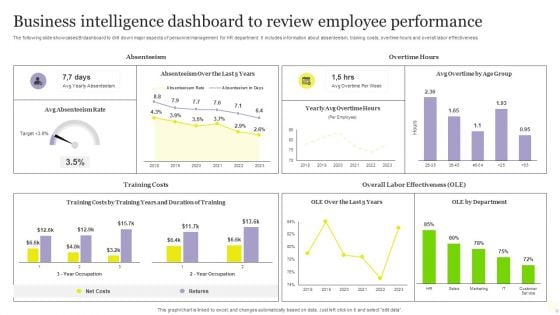
Business Intelligence Dashboard To Review Employee Performance Pictures PDF
The following slide showcases BI dashboard to drill down major aspects of personnel management for HR department. It includes information about absenteeism, training costs, overtime hours and overall labor effectiveness. Showcasing this set of slides titled Business Intelligence Dashboard To Review Employee Performance Pictures PDF. The topics addressed in these templates are Business Intelligence Dashboard, Review Employee Performance. All the content presented in this PPT design is completely editable. Download it and make adjustments in color, background, font etc. as per your unique business setting.
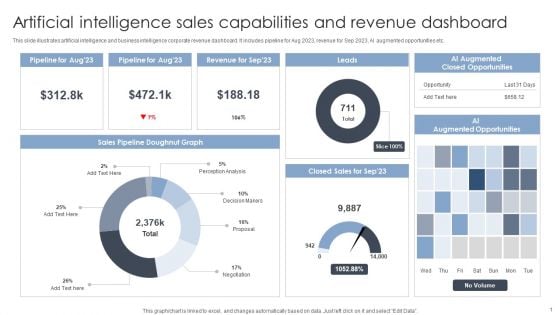
Artificial Intelligence Sales Capabilities And Revenue Dashboard Portrait PDF
This slide illustrates artificial intelligence and business intelligence corporate revenue dashboard. It includes pipeline for Aug 2023, revenue for Sep 2023, AI augmented opportunities etc. Pitch your topic with ease and precision using this Artificial Intelligence Sales Capabilities And Revenue Dashboard Portrait PDF. This layout presents information on Sales Capabilities, Revenue Dashboard. It is also available for immediate download and adjustment. So, changes can be made in the color, design, graphics or any other component to create a unique layout.
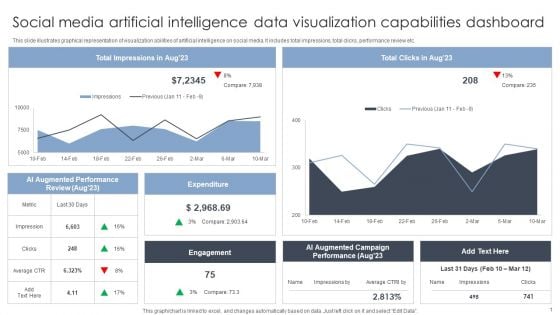
Social Media Artificial Intelligence Data Visualization Capabilities Dashboard Inspiration PDF
This slide illustrates graphical representation of visualization abilities of artificial intelligence on social media. It includes total impressions, total clicks, performance review etc. Pitch your topic with ease and precision using this Social Media Artificial Intelligence Data Visualization Capabilities Dashboard Inspiration PDF. This layout presents information on Artificial Intelligence, Data Visualization Capabilities. It is also available for immediate download and adjustment. So, changes can be made in the color, design, graphics or any other component to create a unique layout.
Projection Model Predictive Analytics Model Performance Tracking Dashboard Microsoft PDF
This slide represents the predictive analytics model performance tracking dashboard, and it covers the details of total visitors, total buyers, total products added to the cart, filters by date and category, visitors to clients conversion rate, and so on. Find a pre-designed and impeccable Projection Model Predictive Analytics Model Performance Tracking Dashboard Microsoft PDF. The templates can ace your presentation without additional effort. You can download these easy-to-edit presentation templates to make your presentation stand out from others. So, what are you waiting for Download the template from Slidegeeks today and give a unique touch to your presentation.
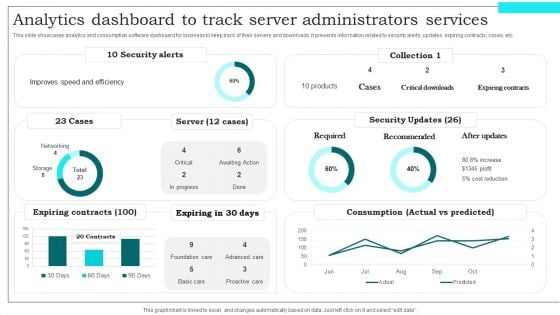
Analytics Dashboard To Track Server Administrators Services Demonstration PDF
This slide showcases analytics and consumption software dashboard for business to keep track of their servers and downloads. It presents information related to security alerts, updates, expiring contracts, cases, etc. Showcasing this set of slides titled Analytics Dashboard To Track Server Administrators Services Demonstration PDF. The topics addressed in these templates are Expiring Contracts, Security Updates, Required. All the content presented in this PPT design is completely editable. Download it and make adjustments in color, background, font etc. as per your unique business setting.
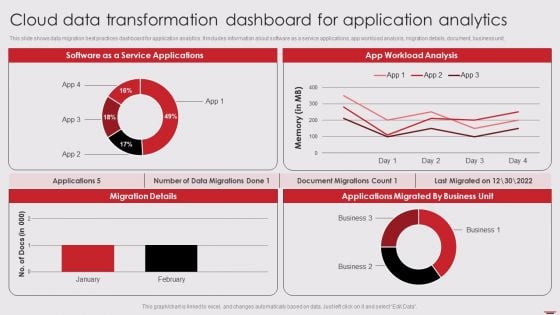
Cloud Data Transformation Dashboard For Application Analytics Information PDF
This slide shows data migration best practices dashboard for application analytics. It includes information about software as a service applications, app workload analysis, migration details, document, business unit. Pitch your topic with ease and precision using this Cloud Data Transformation Dashboard For Application Analytics Information PDF. This layout presents information on Software Service Applications, App Workload Analysis, Migration Details. It is also available for immediate download and adjustment. So, changes can be made in the color, design, graphics or any other component to create a unique layout.
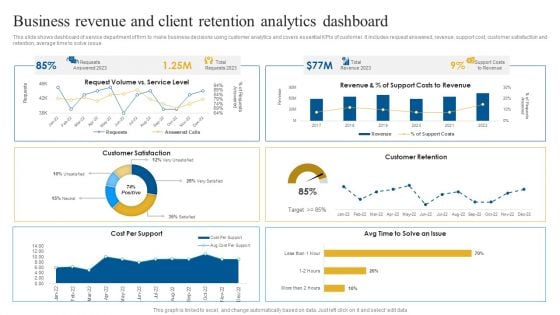
Business Revenue And Client Retention Analytics Dashboard Brochure PDF
This slide shows dashboard of service department of firm to make business decisions using customer analytics and covers essential KPIs of customer. It includes request answered, revenue, support cost, customer satisfaction and retention, average time to solve issue. Showcasing this set of slides titled Business Revenue And Client Retention Analytics Dashboard Brochure PDF. The topics addressed in these templates are Customer Satisfaction, Customer Retention, Revenue. All the content presented in this PPT design is completely editable. Download it and make adjustments in color, background, font etc. as per your unique business setting.
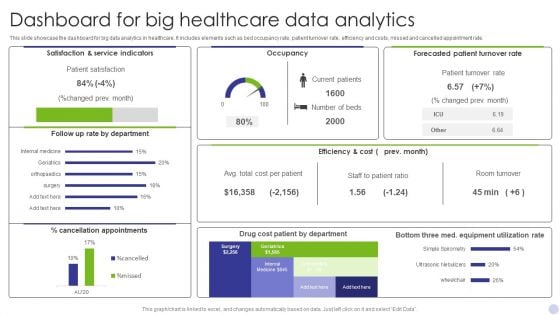
Dashboard For Big Healthcare Data Analytics Graphics PDF
This slide showcase the dashboard for big data analytics in healthcare. It includes elements such as bed occupancy rate, patient turnover rate, efficiency and costs, missed and cancelled appointment rate. Showcasing this set of slides titled Dashboard For Big Healthcare Data Analytics Graphics PDF. The topics addressed in these templates are Satisfaction Service Indicators, Occupancy, Forecasted Patient Turnover. All the content presented in this PPT design is completely editable. Download it and make adjustments in color, background, font etc. as per your unique business setting.
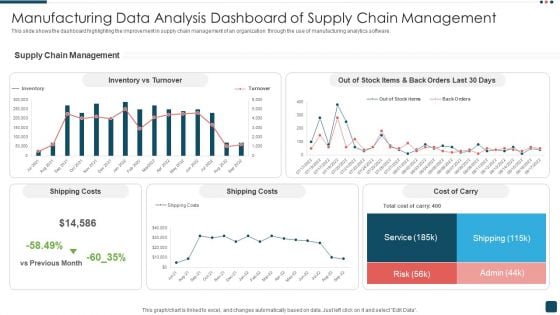
Manufacturing Data Analysis Dashboard Of Supply Chain Management Background PDF
This slide shows the dashboard highlighting the improvement in supply chain management of an organization through the use of manufacturing analytics software. Showcasing this set of slides titled Manufacturing Data Analysis Dashboard Of Supply Chain Management Background PDF. The topics addressed in these templates are Shipping Costs, Service, Risk. All the content presented in this PPT design is completely editable. Download it and make adjustments in color, background, font etc. as per your unique business setting.
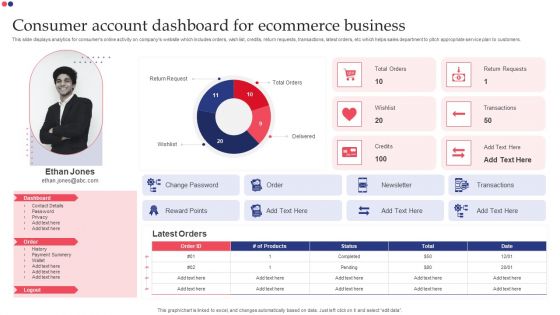
Consumer Account Dashboard For Ecommerce Business Themes PDF
This slide displays analytics for consumers online activity on companys website which includes orders, wish list, credits, return requests, transactions, latest orders, etc which helps sales department to pitch appropriate service plan to customers. Showcasing this set of slides titled Consumer Account Dashboard For Ecommerce Business Themes PDF. The topics addressed in these templates are Dashboard, Return Request, Delivered, Transactions. All the content presented in this PPT design is completely editable. Download it and make adjustments in color, background, font etc. as per your unique business setting.
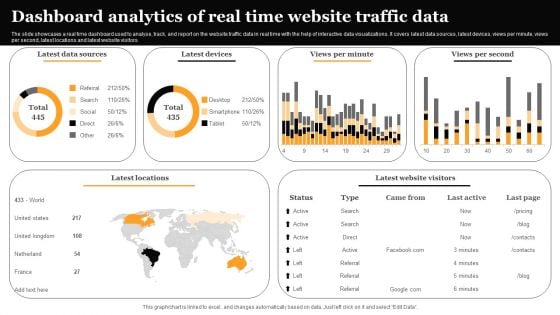
Dashboard Analytics Of Real Time Website Traffic Data Information PDF
The slide showcases a real time dashboard used to analyse, track, and report on the website traffic data in real time with the help of interactive data visualizations. It covers latest data sources, latest devices, views per minute, views per second, latest locations and latest website visitors. Showcasing this set of slides titled Dashboard Analytics Of Real Time Website Traffic Data Information PDF. The topics addressed in these templates are Latest Data Sources, Latest Devices, Views Per Second. All the content presented in this PPT design is completely editable. Download it and make adjustments in color, background, font etc. as per your unique business setting.
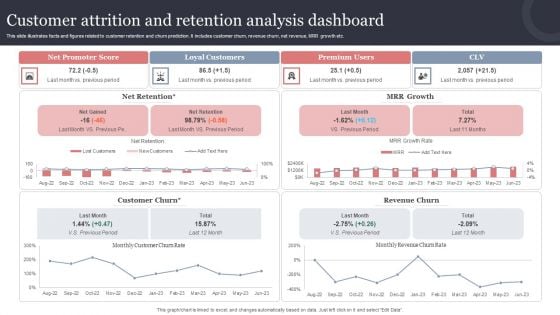
Customer Attrition And Retention Analysis Dashboard Background PDF
This slide illustrates facts and figures related to customer retention and churn prediction. It includes customer churn, revenue churn, net revenue, MRR growth etc. Showcasing this set of slides titled Customer Attrition And Retention Analysis Dashboard Background PDF. The topics addressed in these templates are Net Promoter Score, Loyal Customers, Premium Users, Customer Churn, Revenue Churn. All the content presented in this PPT design is completely editable. Download it and make adjustments in color, background, font etc. as per your unique business setting.
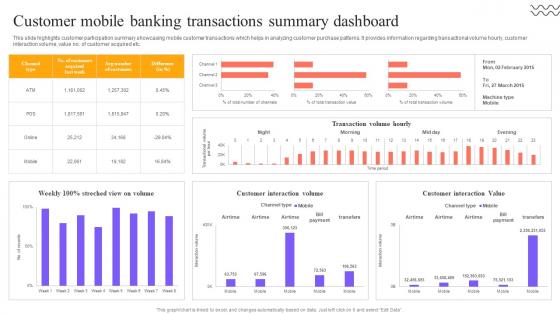
Digital Approach To Client Customer Mobile Banking Transactions Summary Dashboard
This slide highlights customer participation summary showcasing mobile customer transactions which helps in analyzing customer purchase patterns. It provides information regarding transactional volume hourly, customer interaction volume, value no. of customer acquired etc. Formulating a presentation can take up a lot of effort and time, so the content and message should always be the primary focus. The visuals of the PowerPoint can enhance the presenters message, so our Digital Approach To Client Customer Mobile Banking Transactions Summary Dashboard was created to help save time. Instead of worrying about the design, the presenter can concentrate on the message while our designers work on creating the ideal templates for whatever situation is needed. Slidegeeks has experts for everything from amazing designs to valuable content, we have put everything into Digital Approach To Client Customer Mobile Banking Transactions Summary Dashboard. This slide highlights customer participation summary showcasing mobile customer transactions which helps in analyzing customer purchase patterns. It provides information regarding transactional volume hourly, customer interaction volume, value no. of customer acquired etc.
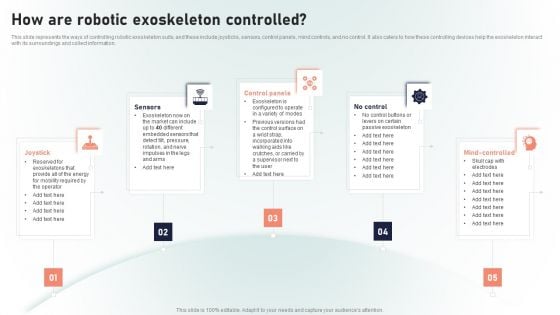
Powered Armor How Are Robotic Exoskeleton Controlled Demonstration PDF
This slide represents the ways of controlling robotic exoskeleton suits, and these include joysticks, sensors, control panels, mind controls, and no control. It also caters to how these controlling devices help the exoskeleton interact with its surroundings and collect information. Slidegeeks is here to make your presentations a breeze with Powered Armor How Are Robotic Exoskeleton Controlled Demonstration PDF With our easy-to-use and customizable templates, you can focus on delivering your ideas rather than worrying about formatting. With a variety of designs to choose from, youre sure to find one that suits your needs. And with animations and unique photos, illustrations, and fonts, you can make your presentation pop. So whether youre giving a sales pitch or presenting to the board, make sure to check out Slidegeeks first.
Kpi Dashboard For Tracking Enhance Client Engagement With Interactive Advertising Background Pdf
This slide shows KPI dashboard for assessing performance of social media platforms. It provides information about followers, likes, clicks, shares, impressions, engaged users, new followers, etc. The Kpi Dashboard For Tracking Enhance Client Engagement With Interactive Advertising Background Pdf is a compilation of the most recent design trends as a series of slides. It is suitable for any subject or industry presentation, containing attractive visuals and photo spots for businesses to clearly express their messages. This template contains a variety of slides for the user to input data, such as structures to contrast two elements, bullet points, and slides for written information. Slidegeeks is prepared to create an impression. This slide shows KPI dashboard for assessing performance of social media platforms. It provides information about followers, likes, clicks, shares, impressions, engaged users, new followers, etc.
Forecast Analysis Technique IT Predictive Modeling Model Performance Tracking Dashboard Brochure PDF
This slide represents the predictive analytics model performance tracking dashboard, and it covers the details of total visitors, total buyers, total products added to the cart, filters by date and category, visitors to clients conversion rate, and so on. There are so many reasons you need a Forecast Analysis Technique IT Predictive Modeling Model Performance Tracking Dashboard Brochure PDF. The first reason is you can not spend time making everything from scratch, Thus, Slidegeeks has made presentation templates for you too. You can easily download these templates from our website easily.
Predictive Analytics Model Performance Tracking Dashboard Forward Looking Analysis IT Introduction PDF
This slide represents the predictive analytics model performance tracking dashboard, and it covers the details of total visitors, total buyers, total products added to the cart, filters by date and category, visitors to clients conversion rate, and so on.The Predictive Analytics Model Performance Tracking Dashboard Forward Looking Analysis IT Introduction PDF is a compilation of the most recent design trends as a series of slides. It is suitable for any subject or industry presentation, containing attractive visuals and photo spots for businesses to clearly express their messages. This template contains a variety of slides for the user to input data, such as structures to contrast two elements, bullet points, and slides for written information. Slidegeeks is prepared to create an impression.
Interactive Dashboard Architecture Vector Icon Ppt PowerPoint Presentation File Background Image PDF
Presenting this set of slides with name interactive dashboard architecture vector icon ppt powerpoint presentation file background image pdf. This is a three stage process. The stages in this process are interactive dashboard architecture vector icon. This is a completely editable PowerPoint presentation and is available for immediate download. Download now and impress your audience.
Monthly Sales Reporting And Projections Dashboard Icon Ppt Icon Clipart Images PDF
Persuade your audience using this Monthly Sales Reporting And Projections Dashboard Icon Ppt Icon Clipart Images PDF. This PPT design covers three stages, thus making it a great tool to use. It also caters to a variety of topics including Monthly Sale,s Reporting And Projections, Dashboard Icon. Download this PPT design now to present a convincing pitch that not only emphasizes the topic but also showcases your presentation skills.
Service Level Agreement KPI Dashboard Icon With Analytics And Interfaces Download PDF
Presenting Service Level Agreement KPI Dashboard Icon With Analytics And Interfaces Download PDF to dispense important information. This template comprises three stages. It also presents valuable insights into the topics including Service Level Agreement, KPI Dashboard Icon, Analytics And Interfaces. This is a completely customizable PowerPoint theme that can be put to use immediately. So, download it and address the topic impactfully.
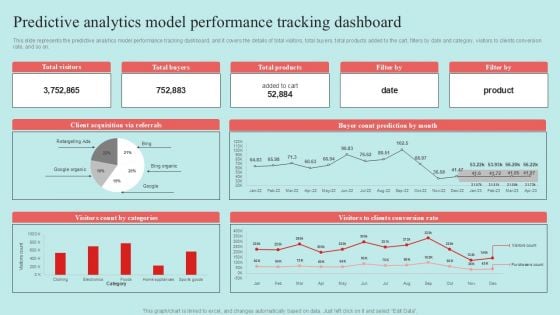
Predictive Data Model Predictive Analytics Model Performance Tracking Dashboard Themes PDF
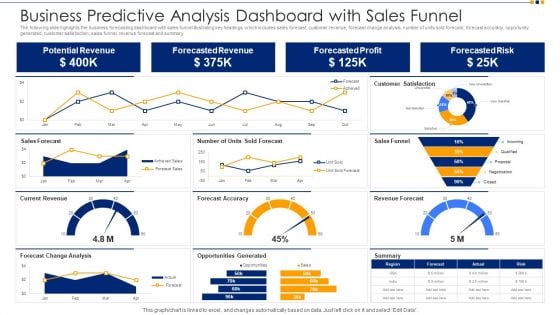
Business Predictive Analysis Dashboard With Sales Funnel Ppt Show Images PDF
The following slide highlights the business forecasting dashboard with sales funnel illustrating key headings which includes sales forecast, customer revenue, forecast change analysis, number of units sold forecast, forecast accuracy, opportunity generated, customer satisfaction, sales funnel, revenue forecast and summary. Pitch your topic with ease and precision using this business predictive analysis dashboard with sales funnel ppt show images pdf. This layout presents information on potential revenue, forecasted revenue, forecasted profit, forecasted risk. It is also available for immediate download and adjustment. So, changes can be made in the color, design, graphics or any other component to create a unique layout.
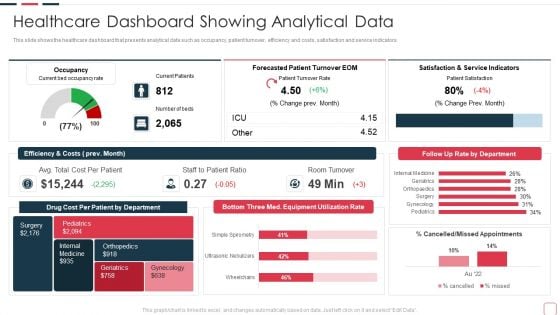
Price Benefit Internet Things Digital Twins Execution After Covid Healthcare Dashboard Designs PDF
This slide shows the healthcare dashboard that presents analytical data such as occupancy, patient turnover, efficiency and costs, satisfaction and service indicators. Deliver an awe inspiring pitch with this creative price benefit internet things digital twins execution after covid healthcare dashboard designs pdf bundle. Topics like healthcare dashboard showing analytical data can be discussed with this completely editable template. It is available for immediate download depending on the needs and requirements of the user.
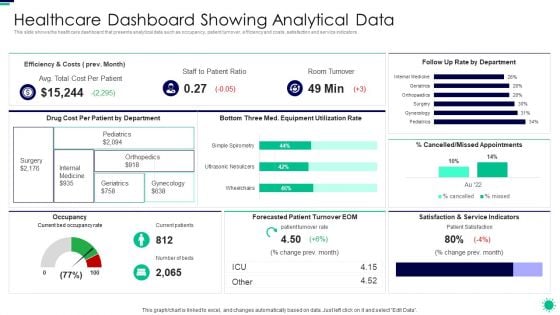
Purpose Digital Twin Internet Things Reducing Costs After COVID Era Healthcare Dashboard Showing Inspiration PDF
This slide shows the healthcare dashboard that presents analytical data such as occupancy, patient turnover, efficiency and costs, satisfaction and service indicators. Deliver an awe inspiring pitch with this creative purpose digital twin internet things reducing costs after covid era healthcare dashboard showing inspiration pdf bundle. Topics like healthcare dashboard showing analytical data can be discussed with this completely editable template. It is available for immediate download depending on the needs and requirements of the user.
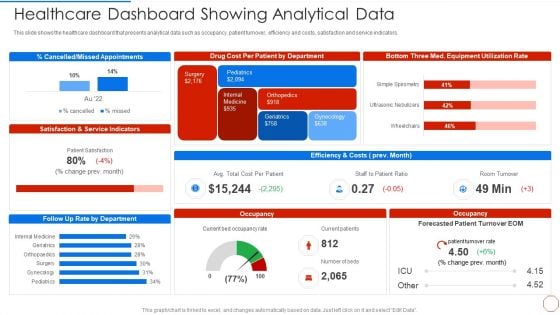
Minimizing Operational Cost Through Iot Virtual Twins Implementation Healthcare Dashboard Showing Sample PDF
This slide shows the healthcare dashboard that presents analytical data such as occupancy, patient turnover, efficiency and costs, satisfaction and service indicators. Deliver an awe inspiring pitch with this creative minimizing operational cost through iot virtual twins implementation healthcare dashboard showing sample pdf bundle. Topics like healthcare dashboard showing analytical data can be discussed with this completely editable template. It is available for immediate download depending on the needs and requirements of the user.
Service Level Agreement KPI Dashboard With Graph And Analytics Icon Inspiration PDF
Persuade your audience using this Service Level Agreement KPI Dashboard With Graph And Analytics Icon Inspiration PDF. This PPT design covers three stages, thus making it a great tool to use. It also caters to a variety of topics including Service Level, Agreement KPI Dashboard, Graph And Analytics, Icon. Download this PPT design now to present a convincing pitch that not only emphasizes the topic but also showcases your presentation skills.
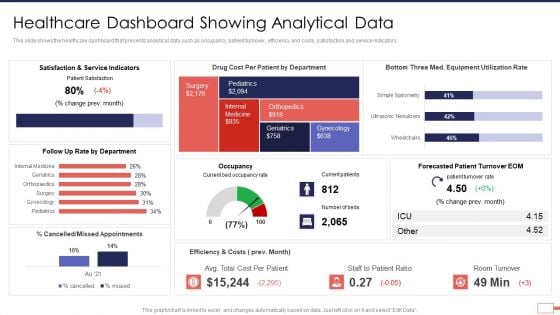
Iot Digital Twin Technology Post Covid Expenditure Management Healthcare Dashboard Showing Analytical Data Brochure PDF
This slide shows the healthcare dashboard that presents analytical data such as occupancy, patient turnover, efficiency and costs, satisfaction and service indicators. Deliver an awe inspiring pitch with this creative iot digital twin technology post covid expenditure management healthcare dashboard showing analytical data brochure pdf bundle. Topics like service, indicators, cost, appointments, turnover can be discussed with this completely editable template. It is available for immediate download depending on the needs and requirements of the user.
Predictive Analytics Methods Predictive Analytics Model Performance Tracking Dashboard Structure PDF
This slide represents the predictive analytics model performance tracking dashboard, and it covers the details of total visitors, total buyers, total products added to the cart, filters by date and category, visitors to clients conversion rate, and so on. Want to ace your presentation in front of a live audience Our Predictive Analytics Methods Predictive Analytics Model Performance Tracking Dashboard Structure PDF can help you do that by engaging all the users towards you. Slidegeeks experts have put their efforts and expertise into creating these impeccable powerpoint presentations so that you can communicate your ideas clearly. Moreover, all the templates are customizable, and easy to edit and downloadable. Use these for both personal and commercial use.
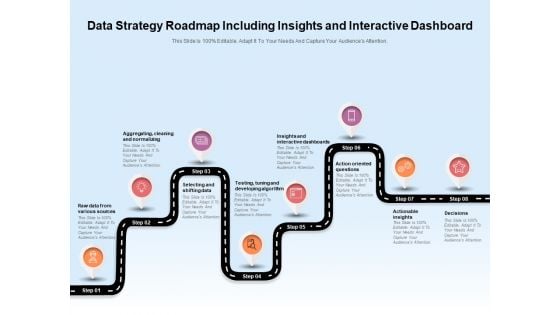
Data Strategy Roadmap Including Insights And Interactive Dashboard Ppt PowerPoint Presentation File Elements PDF
Presenting this set of slides with name data strategy roadmap including insights and interactive dashboard ppt powerpoint presentation file elements pdf. This is a eight stage process. The stages in this process are sources, developing, decisions. This is a completely editable PowerPoint presentation and is available for immediate download. Download now and impress your audience.

Iot And Digital Twin To Reduce Costs Post Covid Healthcare Dashboard Showing Analytical Data Elements PDF
This slide shows the healthcare dashboard that presents analytical data such as occupancy, patient turnover, efficiency and costs, satisfaction and service indicators. Deliver and pitch your topic in the best possible manner with this iot and digital twin to reduce costs post covid healthcare dashboard showing analytical data elements pdf. Use them to share invaluable insights on occupancy, patient turnover, efficiency and costs, satisfaction and service indicators and impress your audience. This template can be altered and modified as per your expectations. So, grab it now.
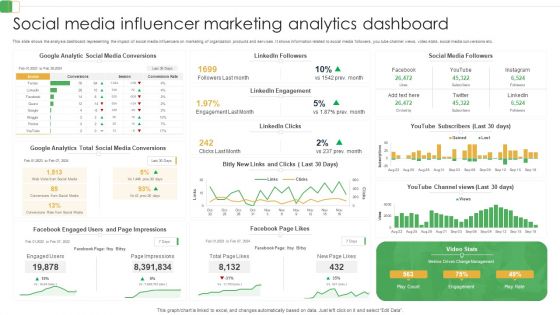
Social Media Influencer Marketing Analytics Dashboard Ppt PowerPoint Presentation File Inspiration PDF
This slide shows the analysis dashboard representing the impact of social media influencers on marketing of organization products and services. It shows information related to social media followers, you tube channel views, video stats, social media conversions etc.Showcasing this set of slides titled Social Media Influencer Marketing Analytics Dashboard Ppt PowerPoint Presentation File Inspiration PDF. The topics addressed in these templates are Linkedin Engagement, Media Conversions, Facebook Engaged. All the content presented in this PPT design is completely editable. Download it and make adjustments in color, background, font etc. as per your unique business setting.
Optimizing AI Strategies To Improve Financial Services Digital Media Tracking Dashboard Professional PDF
This slide covers the digital marketing dashboard along with the lead breakdown, google analytics traffic, and social media channels. Do you know about Slidesgeeks Optimizing AI Strategies To Improve Financial Services Digital Media Tracking Dashboard Professional PDF These are perfect for delivering any kind od presentation. Using it, create PowerPoint presentations that communicate your ideas and engage audiences. Save time and effort by using our pre designed presentation templates that are perfect for a wide range of topic. Our vast selection of designs covers a range of styles, from creative to business, and are all highly customizable and easy to edit. Download as a PowerPoint template or use them as Google Slides themes.
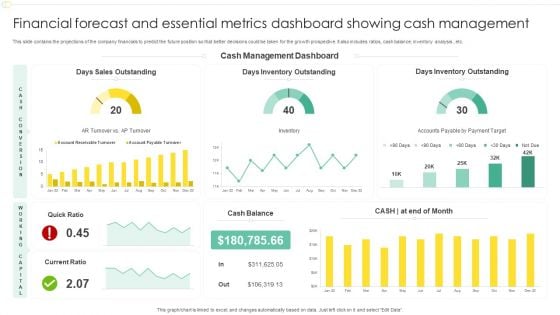
Financial Forecast And Essential Metrics Dashboard Showing Cash Management Designs PDF
This slide contains the projections of the company financials to predict the future position so that better decisions could be taken for the growth prospective. It also includes ratios, cash balance, inventory analysis , etc. Showcasing this set of slides titled Financial Forecast And Essential Metrics Dashboard Showing Cash Management Designs PDF. The topics addressed in these templates are Days Sales Outstanding, Cash Management Dashboard, Days Inventory Outstanding. All the content presented in this PPT design is completely editable. Download it and make adjustments in color, background, font etc. as per your unique business setting.
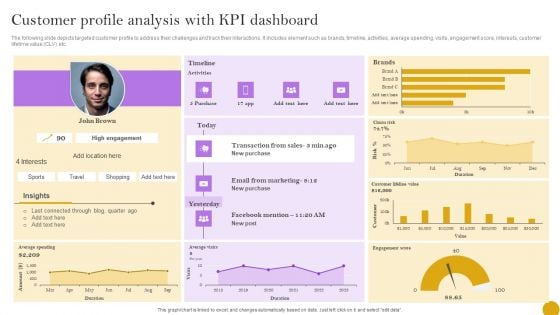
Comprehensive Customer Data Platform Guide Optimizing Promotional Initiatives Customer Profile Analysis KPI Dashboard Pictures PDF
The following slide depicts targeted customer profile to address their challenges and track their interactions. It includes element such as brands, timeline, activities, average spending, visits, engagement score, interests, customer lifetime value CLV etc. The best PPT templates are a great way to save time, energy, and resources. Slidegeeks have 100 percent editable powerpoint slides making them incredibly versatile. With these quality presentation templates, you can create a captivating and memorable presentation by combining visually appealing slides and effectively communicating your message. Download Comprehensive Customer Data Platform Guide Optimizing Promotional Initiatives Customer Profile Analysis KPI Dashboard Pictures PDF from Slidegeeks and deliver a wonderful presentation.
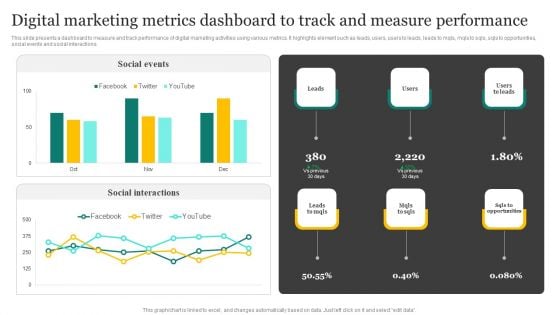
Strategic Promotion Plan Development Stages Digital Marketing Metrics Dashboard To Track Structure PDF
This slide presents a dashboard to measure and track performance of digital marketing activities using various metrics. It highlights element such as leads, users, users to leads, leads to mqls, mqls to sqls, sqls to opportunities, social events and social interactions. Are you in need of a template that can accommodate all of your creative concepts This one is crafted professionally and can be altered to fit any style. Use it with Google Slides or PowerPoint. Include striking photographs, symbols, depictions, and other visuals. Fill, move around, or remove text boxes as desired. Test out color palettes and font mixtures. Edit and save your work, or work with colleagues. Download Strategic Promotion Plan Development Stages Digital Marketing Metrics Dashboard To Track Structure PDF and observe how to make your presentation outstanding. Give an impeccable presentation to your group and make your presentation unforgettable.
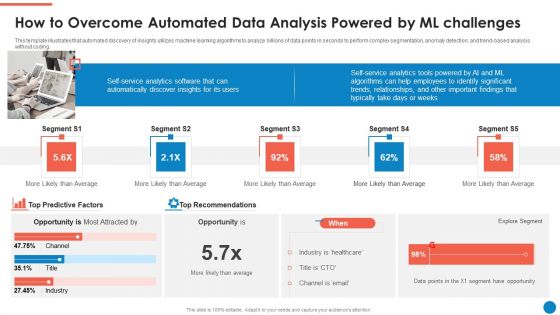
Data And Analytics Playbook How To Overcome Automated Data Analysis Powered By Ml Diagrams PDF
This template illustrates that automated discovery of insights utilizes machine learning algorithms to analyze billions of data points in seconds to perform complex segmentation, anomaly detection, and trend-based analysis without coding. This is a Data And Analytics Playbook How To Overcome Automated Data Analysis Powered By Ml Diagrams PDF template with various stages. Focus and dispense information on one stages using this creative set, that comes with editable features. It contains large content boxes to add your information on topics like Self Service Analytics Software, Top Recommendations, Explore Segment. You can also showcase facts, figures, and other relevant content using this PPT layout. Grab it now.
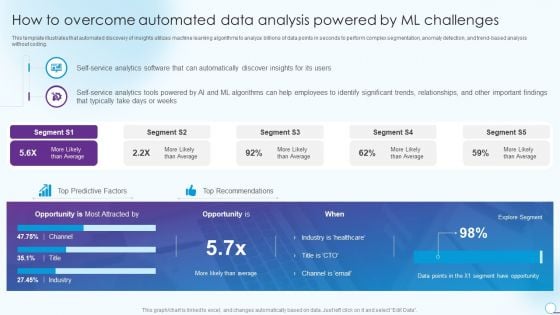
How To Overcome Automated Data Analysis Powered By Ml Challenges Elements PDF
This template illustrates that automated discovery of insights utilizes machine learning algorithms to analyze billions of data points in seconds to perform complex segmentation, anomaly detection, and trend based analysis without coding. Deliver an awe inspiring pitch with this creative How To Overcome Automated Data Analysis Powered By Ml Challenges Elements PDF bundle. Topics like Opportunity, Average, Self Service Analytics can be discussed with this completely editable template. It is available for immediate download depending on the needs and requirements of the user.
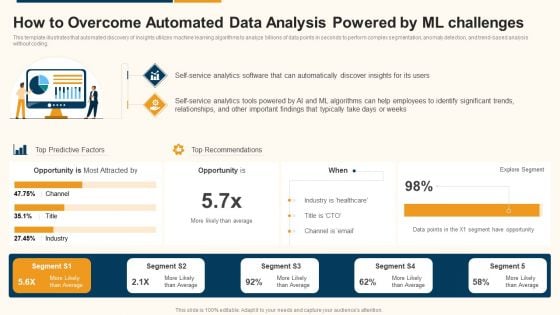
Data Interpretation And Analysis Playbook How To Overcome Automated Data Analysis Powered By Ml Challenges Summary PDF
This template illustrates that automated discovery of insights utilizes machine learning algorithms to analyze billions of data points in seconds to perform complex segmentation, anomaly detection, and trend-based analysis without coding. Deliver and pitch your topic in the best possible manner with this data interpretation and analysis playbook how to overcome automated data analysis powered by ml challenges summary pdf. Use them to share invaluable insights on opportunity, service, analytics, industry and impress your audience. This template can be altered and modified as per your expectations. So, grab it now.
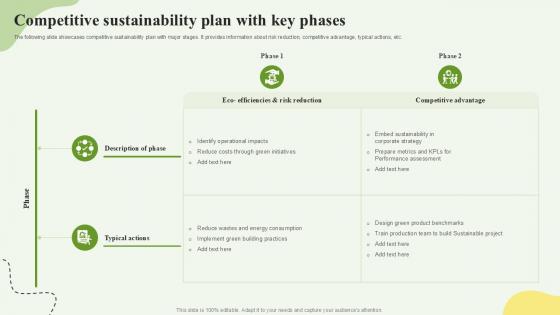
Competitive Sustainability Plan With Key Phases Ppt Template SS
This slide showcases dashboard for real estate company sales. This template aims to show a power bi dashboard for property dealer sales analysis representing total sales by project, actual sales, total revenue, number of contracts signed and marketing details. It is very useful tool for real estate developers and other property dealers. From laying roadmaps to briefing everything in detail, our templates are perfect for you. You can set the stage with your presentation slides. All you have to do is download these easy-to-edit and customizable templates. Competitive Sustainability Plan With Key Phases Ppt Template SS will help you deliver an outstanding performance that everyone would remember and praise you for. Do download this presentation today. This slide showcases dashboard for real estate company sales. This template aims to show a power bi dashboard for property dealer sales analysis representing total sales by project, actual sales, total revenue, number of contracts signed and marketing details. It is very useful tool for real estate developers and other property dealers.
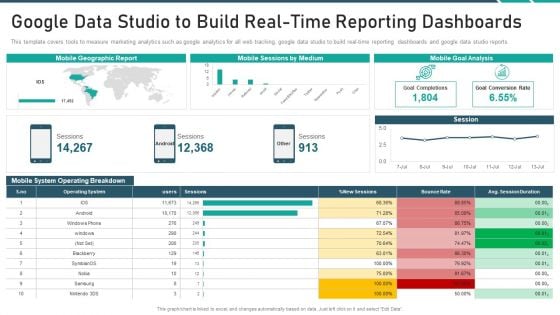
Online Promotion Playbook Google Data Studio To Build Real Time Reporting Dashboards Topics PDF
This template covers tools to measure marketing analytics such as google analytics for all web tracking, google data studio to build real time reporting dashboards and google data studio reports. Deliver and pitch your topic in the best possible manner with this online promotion playbook google data studio to build real time reporting dashboards topics pdf. Use them to share invaluable insights on google data studio to build real time reporting dashboards and impress your audience. This template can be altered and modified as per your expectations. So, grab it now.
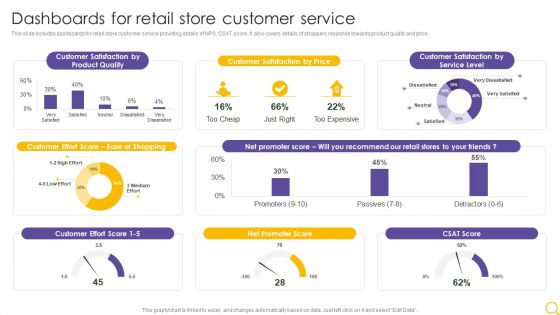
Retail Outlet Operational Efficiency Analytics Dashboards For Retail Store Customer Service Professional PDF
This slide includes dashboards for retail store customer service providing details of NPS, CSAT score. It also covers details of shoppers response towards product quality and price. Deliver an awe inspiring pitch with this creative Retail Outlet Operational Efficiency Analytics Dashboards For Retail Store Customer Service Professional PDF bundle. Topics like Product Quality, Customer Satisfaction, Customer Effort Score can be discussed with this completely editable template. It is available for immediate download depending on the needs and requirements of the user.

Security And Performance Digital Marketing Google Data Studio To Build Realtime Reporting Dashboards Information PDF
This template covers tools to measure marketing analytics such as google analytics for all web tracking, google data studio to build real time reporting dashboards and google data studio reports.Deliver an awe inspiring pitch with this creative Security And Performance Digital Marketing Google Data Studio To Build Realtime Reporting Dashboards Information PDF bundle. Topics like Operating Breakdown, Session Duration, Goal Completions can be discussed with this completely editable template. It is available for immediate download depending on the needs and requirements of the user.
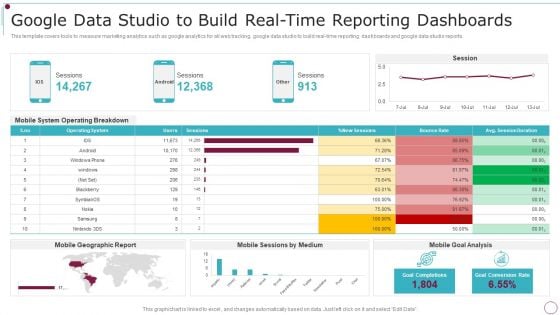
Playbook For Content Advertising Google Data Studio To Build Real Time Reporting Dashboards Formats PDF
This template covers tools to measure marketing analytics such as google analytics for all web tracking, google data studio to build real-time reporting dashboards and google data studio reports. Deliver and pitch your topic in the best possible manner with this Playbook For Content Advertising Google Data Studio To Build Real Time Reporting Dashboards Formats PDF. Use them to share invaluable insights on Mobile System, Operating Breakdown, Geographic Report and impress your audience. This template can be altered and modified as per your expectations. So, grab it now.
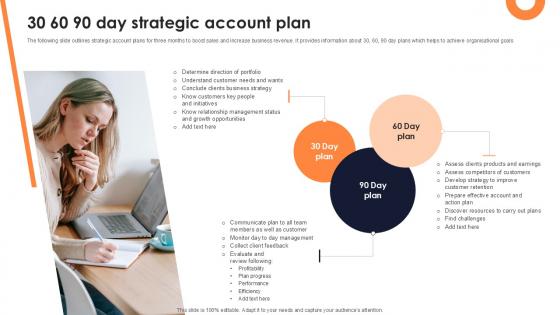
30 60 90 Day Strategic Account Plan Ppt Sample SS
This slide highlights dashboard for ecommerce sales using power bi. This slide aims to provide insights regarding sales by region, average order value, types of product sold , number of returns and specifies the reason for return. It acts as helpful tool for forecasting future sales and improving overall delivery processes. Find a pre-designed and impeccable 30 60 90 Day Strategic Account Plan Ppt Sample SS The templates can ace your presentation without additional effort. You can download these easy-to-edit presentation templates to make your presentation stand out from others. So, what are you waiting for Download the template from Slidegeeks today and give a unique touch to your presentation. This slide highlights dashboard for ecommerce sales using power bi. This slide aims to provide insights regarding sales by region, average order value, types of product sold , number of returns and specifies the reason for return. It acts as helpful tool for forecasting future sales and improving overall delivery processes.
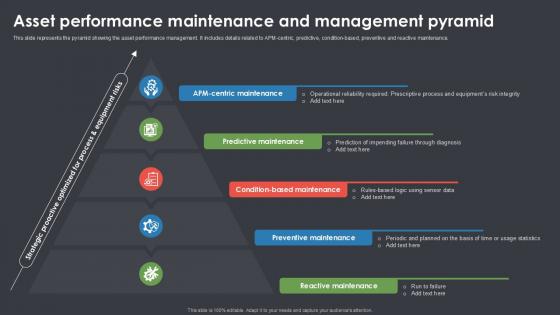
Asset Performance Maintenance And Management Pyramid Ppt Slide SS
This slide showcases dashboard for efficient cash management by power bi tool. The purpose of this slide is to maximize liquidity and minimize the cost of expenditures to ensure solvency. It provides companies with a window to analyze their financial position and improve overall profitability by scaling various problem areas. Boost your pitch with our creative Asset Performance Maintenance And Management Pyramid Ppt Slide SS. Deliver an awe-inspiring pitch that will mesmerize everyone. Using these presentation templates you will surely catch everyones attention. You can browse the ppts collection on our website. We have researchers who are experts at creating the right content for the templates. So you do not have to invest time in any additional work. Just grab the template now and use them. This slide showcases dashboard for efficient cash management by power bi tool. The purpose of this slide is to maximize liquidity and minimize the cost of expenditures to ensure solvency. It provides companies with a window to analyze their financial position and improve overall profitability by scaling various problem areas.
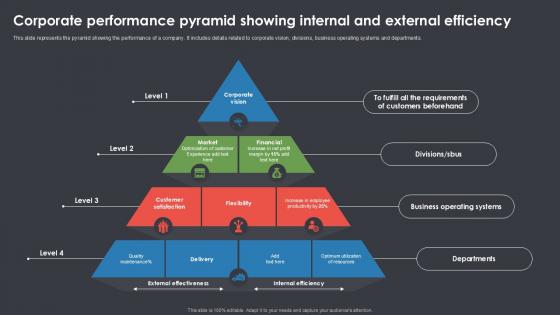
Corporate Performance Pyramid Showing Internal And External Efficiency Ppt Template SS
This slide highlights dashboard for evaluating financial performance using power bi tool. The purpose of this template is to provide managers with an efficient tool for comparing profit metrics across the quarters. It allows users to select different quarters and estimate sales of various products. Present like a pro with Corporate Performance Pyramid Showing Internal And External Efficiency Ppt Template SS Create beautiful presentations together with your team, using our easy-to-use presentation slides. Share your ideas in real-time and make changes on the fly by downloading our templates. So whether you are in the office, on the go, or in a remote location, you can stay in sync with your team and present your ideas with confidence. With Slidegeeks presentation got a whole lot easier. Grab these presentations today. This slide highlights dashboard for evaluating financial performance using power bi tool. The purpose of this template is to provide managers with an efficient tool for comparing profit metrics across the quarters. It allows users to select different quarters and estimate sales of various products.

Oracle Analytics Cloud Application Roles Background PDF
This slide represents the oracle analytics aloud application roles. It includes BI service administrator, BI data model author, BI content writer, BI data load, DV content writer, and DV consumer. Deliver an awe inspiring pitch with this creative oracle analytics cloud application roles background pdf bundle. Topics like administrator, content, communicate, dashboards, visualizations can be discussed with this completely editable template. It is available for immediate download depending on the needs and requirements of the user.
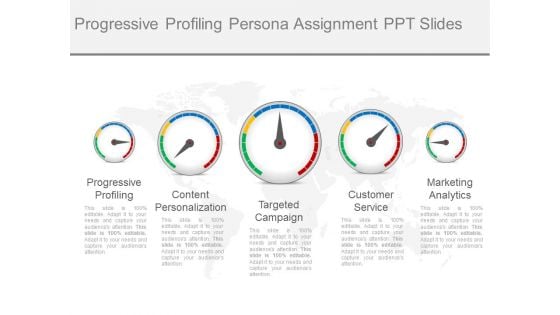
Progressive Profiling Persona Assignment Ppt Slides
This is a progressive profiling persona assignment ppt slides. This is a five stage process. The stages in this process are progressive profiling, content personalization, targeted campaign, customer service, marketing analytics.
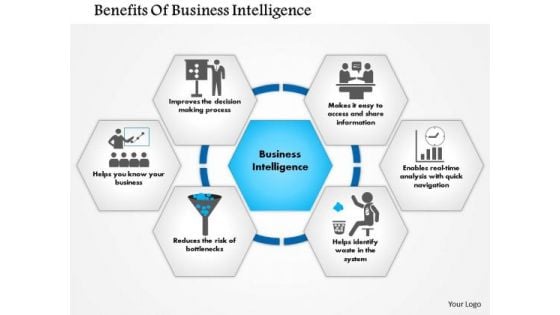
Business Framework Benefits Of Business Intelligence PowerPoint Presentation
Define the benefits of business intelligence with our exclusive power point diagram slide. This diagram slide has been crafted with graphic of business intelligence model. This diagram represents the tools, systems and software to show the strategic planning process. Use this BI model for transforming raw data in in meaning full information.
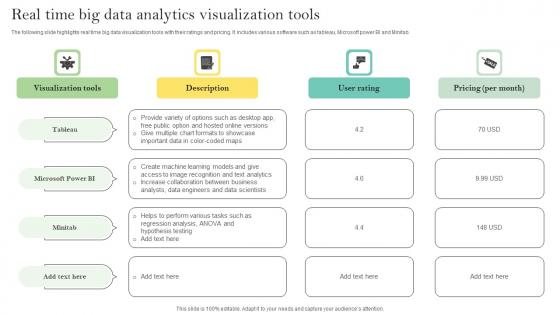
Real Time Big Data Analytics Visualization Tools Ppt Portfolio Example Pdf
The following slide highlights real time big data visualization tools with their ratings and pricing. It includes various software such as tableau, Microsoft power BI and Minitab. Pitch your topic with ease and precision using this Real Time Big Data Analytics Visualization Tools Ppt Portfolio Example Pdf. This layout presents information on Visualization Tools, User Rating, Pricing Per Month. It is also available for immediate download and adjustment. So, changes can be made in the color, design, graphics or any other component to create a unique layout. The following slide highlights real time big data visualization tools with their ratings and pricing. It includes various software such as tableau, Microsoft power BI and Minitab.
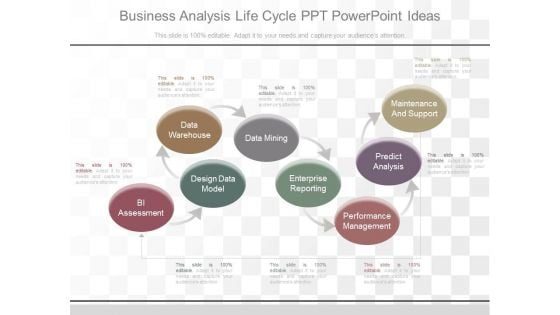
Business Analysis Life Cycle Ppt Powerpoint Ideas
This is a business analysis life cycle ppt powerpoint ideas. This is a eight stage process. The stages in this process are bi assessment, design data model, data warehouse, data mining, enterprise reporting, performance management, predict analysis, maintenance and support.
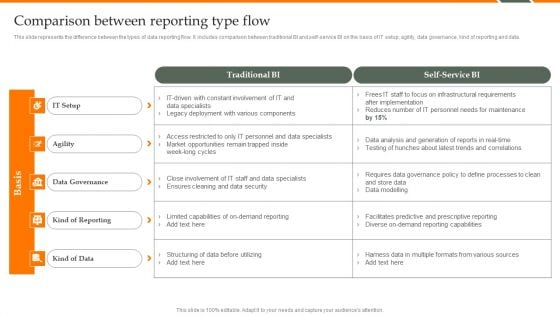
Human Resource Analytics Comparison Between Reporting Type Flow Demonstration PDF
This slide represents the difference between the types of data reporting flow. It includes comparison between traditional BI and self-service BI on the basis of IT setup, agility, data governance, kind of reporting and data. If your project calls for a presentation, then Slidegeeks is your go-to partner because we have professionally designed, easy-to-edit templates that are perfect for any presentation. After downloading, you can easily edit Human Resource Analytics Comparison Between Reporting Type Flow Demonstration PDF and make the changes accordingly. You can rearrange slides or fill them with different images. Check out all the handy templates.
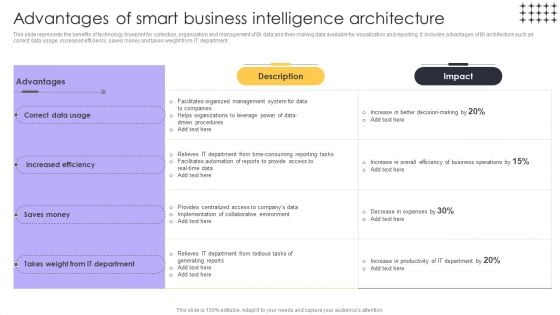
Tools For HR Business Analytics Advantages Of Smart Business Intelligence Architecture Microsoft PDF
This slide represents the benefits of technology blueprint for collection, organization and management of BI data and then making data available for visualization and reporting. It includes advantages of BI architecture such as correct data usage, increased efficiency, saves money and takes weight from IT department. Find a pre-designed and impeccable Tools For HR Business Analytics Advantages Of Smart Business Intelligence Architecture Microsoft PDF. The templates can ace your presentation without additional effort. You can download these easy-to-edit presentation templates to make your presentation stand out from others. So, what are you waiting for Download the template from Slidegeeks today and give a unique touch to your presentation.
Analysis For Strategic Account Plan Icon Ppt Example SS
This slide mentions key features and advantages of using power bi tool. The purpose of this slide is to transform the business data into meaningful data in form of interactive charts, graphs, reports and dashboards. It helps organization to find insights and embed them in the application or website for accessing data on go. Boost your pitch with our creative Analysis For Strategic Account Plan Icon Ppt Example SS Deliver an awe-inspiring pitch that will mesmerize everyone. Using these presentation templates you will surely catch everyones attention. You can browse the ppts collection on our website. We have researchers who are experts at creating the right content for the templates. So you do not have to invest time in any additional work. Just grab the template now and use them. This slide mentions key features and advantages of using power bi tool. The purpose of this slide is to transform the business data into meaningful data in form of interactive charts, graphs, reports and dashboards. It helps organization to find insights and embed them in the application or website for accessing data on go.
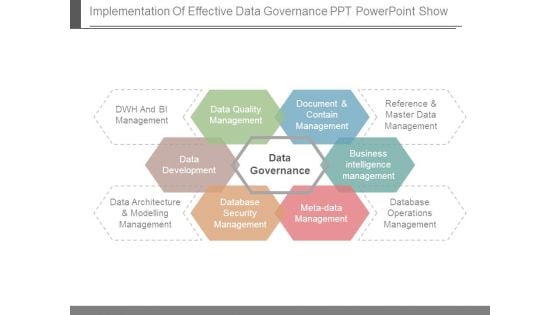
Implementation Of Effective Data Governance Ppt Powerpoint Show
This is a implementation of effective data governance ppt powerpoint show. This is a six stage process. The stages in this process are dwh and bi management, data quality management, document and contain management, reference and master data management, business intelligence management, database operations management, meta data management, database security management, data architecture and modelling management, data development, data governance.
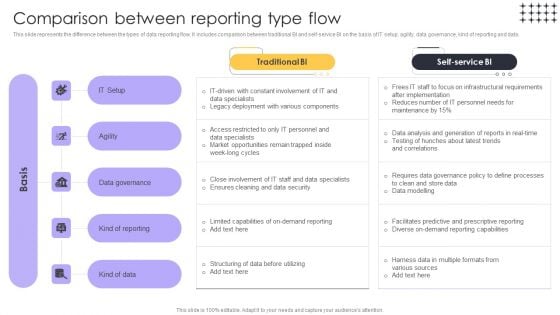
Tools For HR Business Analytics Comparison Between Reporting Type Flow Inspiration PDF
This slide represents the difference between the types of data reporting flow. It includes comparison between traditional BI and self-service BI on the basis of IT setup, agility, data governance, kind of reporting and data. If you are looking for a format to display your unique thoughts, then the professionally designed Tools For HR Business Analytics Comparison Between Reporting Type Flow Inspiration PDF is the one for you. You can use it as a Google Slides template or a PowerPoint template. Incorporate impressive visuals, symbols, images, and other charts. Modify or reorganize the text boxes as you desire. Experiment with shade schemes and font pairings. Alter, share or cooperate with other people on your work. Download Tools For HR Business Analytics Comparison Between Reporting Type Flow Inspiration PDF and find out how to give a successful presentation. Present a perfect display to your team and make your presentation unforgettable.
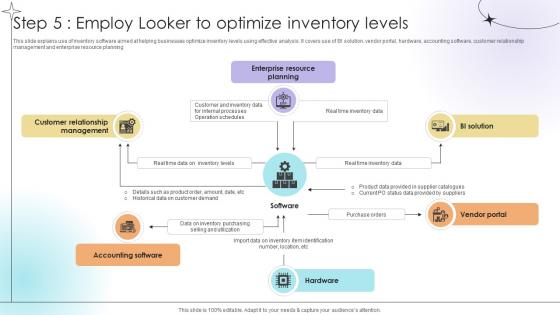
Step 5 Employ Looker To Optimize Inventory Levels Data Analytics SS V
This slide explains use of inventory software aimed at helping businesses optimize inventory levels using effective analysis. It covers use of BI solution, vendor portal, hardware, accounting software, customer relationship management and enterprise resource planning.This modern and well-arranged Step 5 Employ Looker To Optimize Inventory Levels Data Analytics SS V provides lots of creative possibilities. It is very simple to customize and edit with the Powerpoint Software. Just drag and drop your pictures into the shapes. All facets of this template can be edited with Powerpoint, no extra software is necessary. Add your own material, put your images in the places assigned for them, adjust the colors, and then you can show your slides to the world, with an animated slide included. This slide explains use of inventory software aimed at helping businesses optimize inventory levels using effective analysis. It covers use of BI solution, vendor portal, hardware, accounting software, customer relationship management and enterprise resource planning.
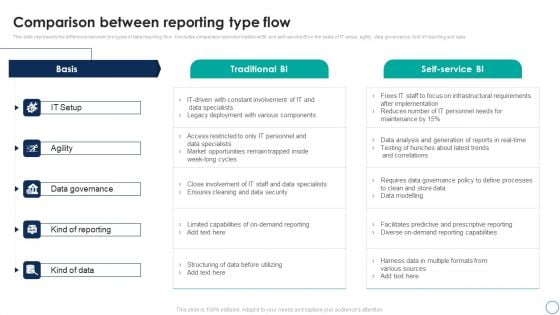
Business Analytics Application Comparison Between Reporting Type Flow Ideas PDF
This slide represents the difference between the types of data reporting flow. It includes comparison between traditional BI and self-service BI on the basis of IT setup, agility, data governance, kind of reporting and data. Are you in need of a template that can accommodate all of your creative concepts This one is crafted professionally and can be altered to fit any style. Use it with Google Slides or PowerPoint. Include striking photographs, symbols, depictions, and other visuals. Fill, move around, or remove text boxes as desired. Test out color palettes and font mixtures. Edit and save your work, or work with colleagues. Download Business Analytics Application Comparison Between Reporting Type Flow Ideas PDF and observe how to make your presentation outstanding. Give an impeccable presentation to your group and make your presentation unforgettable.
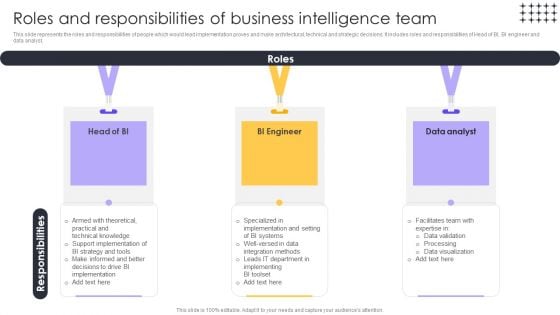
Tools For HR Business Analytics Roles And Responsibilities Of Business Intelligence Team Sample PDF
This slide represents the roles and responsibilities of people which would lead implementation proves and make architectural, technical and strategic decisions. It includes roles and responsibilities of Head of BI, BI engineer and data analyst. Retrieve professionally designed Tools For HR Business Analytics Roles And Responsibilities Of Business Intelligence Team Sample PDF to effectively convey your message and captivate your listeners. Save time by selecting pre-made slideshows that are appropriate for various topics, from business to educational purposes. These themes come in many different styles, from creative to corporate, and all of them are easily adjustable and can be edited quickly. Access them as PowerPoint templates or as Google Slides themes. You dont have to go on a hunt for the perfect presentation because Slidegeeks got you covered from everywhere.


 Continue with Email

 Home
Home


