Power Bi Architecture

Key Benefits Of Generative Ai For Recruitment AI Powered Recruitment Enhancing Ppt Template AI SS V
This slide showcases major benefits of generative artificial intelligence which can help recruiters ease their routine operations. It provides details about automation, reach and predictive analysis.Explore a selection of the finest Key Benefits Of Generative Ai For Recruitment AI Powered Recruitment Enhancing Ppt Template AI SS V here. With a plethora of professionally designed and pre made slide templates, you can quickly and easily find the right one for your upcoming presentation. You can use our Key Benefits Of Generative, Assessing Potential Candidates, Onboarding Experience to effectively convey your message to a wider audience. Slidegeeks has done a lot of research before preparing these presentation templates. The content can be personalized and the slides are highly editable. Grab templates today from Slidegeeks.
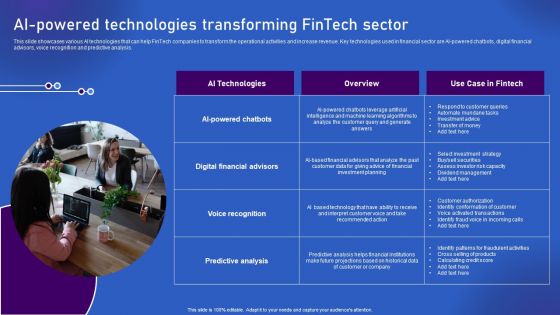
Ways Artificial Intelligence Is Transforming Finance Sector AI Powered Technologies Transforming Fintech Diagrams PDF
This slide showcases various AI technologies that can help FinTech companies to transform the operational activities and increase revenue. Key technologies used in financial sector are AI-powered chatbots, digital financial advisors, voice recognition and predictive analysis. If you are looking for a format to display your unique thoughts, then the professionally designed Ways Artificial Intelligence Is Transforming Finance Sector AI Powered Technologies Transforming Fintech Diagrams PDF is the one for you. You can use it as a Google Slides template or a PowerPoint template. Incorporate impressive visuals, symbols, images, and other charts. Modify or reorganize the text boxes as you desire. Experiment with shade schemes and font pairings. Alter, share or cooperate with other people on your work. Download Ways Artificial Intelligence Is Transforming Finance Sector AI Powered Technologies Transforming Fintech Diagrams PDF and find out how to give a successful presentation. Present a perfect display to your team and make your presentation unforgettable.

Data And Analytics Playbook How To Overcome Automated Data Analysis Powered By Ml Diagrams PDF
This template illustrates that automated discovery of insights utilizes machine learning algorithms to analyze billions of data points in seconds to perform complex segmentation, anomaly detection, and trend-based analysis without coding. This is a Data And Analytics Playbook How To Overcome Automated Data Analysis Powered By Ml Diagrams PDF template with various stages. Focus and dispense information on one stages using this creative set, that comes with editable features. It contains large content boxes to add your information on topics like Self Service Analytics Software, Top Recommendations, Explore Segment. You can also showcase facts, figures, and other relevant content using this PPT layout. Grab it now.
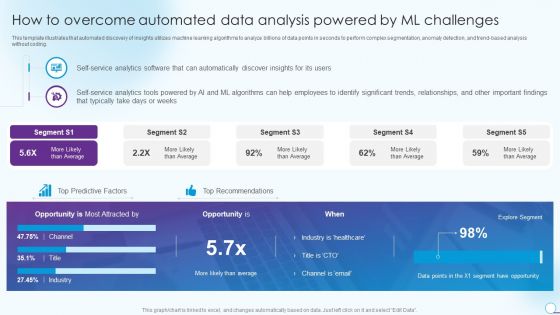
How To Overcome Automated Data Analysis Powered By Ml Challenges Elements PDF
This template illustrates that automated discovery of insights utilizes machine learning algorithms to analyze billions of data points in seconds to perform complex segmentation, anomaly detection, and trend based analysis without coding. Deliver an awe inspiring pitch with this creative How To Overcome Automated Data Analysis Powered By Ml Challenges Elements PDF bundle. Topics like Opportunity, Average, Self Service Analytics can be discussed with this completely editable template. It is available for immediate download depending on the needs and requirements of the user.
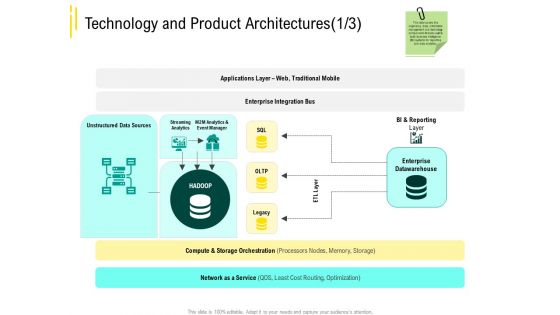
Expert Systems Technology And Product Architectures Reporting Sample PDF
This is a expert systems technology and product architectures reporting sample pdf. template with various stages. Focus and dispense information on one stages using this creative set, that comes with editable features. It contains large content boxes to add your information on topics like streaming analytics, storage, network service. You can also showcase facts, figures, and other relevant content using this PPT layout. Grab it now.
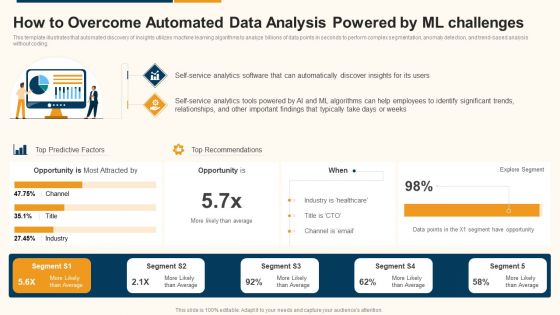
Data Interpretation And Analysis Playbook How To Overcome Automated Data Analysis Powered By Ml Challenges Summary PDF
This template illustrates that automated discovery of insights utilizes machine learning algorithms to analyze billions of data points in seconds to perform complex segmentation, anomaly detection, and trend-based analysis without coding. Deliver and pitch your topic in the best possible manner with this data interpretation and analysis playbook how to overcome automated data analysis powered by ml challenges summary pdf. Use them to share invaluable insights on opportunity, service, analytics, industry and impress your audience. This template can be altered and modified as per your expectations. So, grab it now.
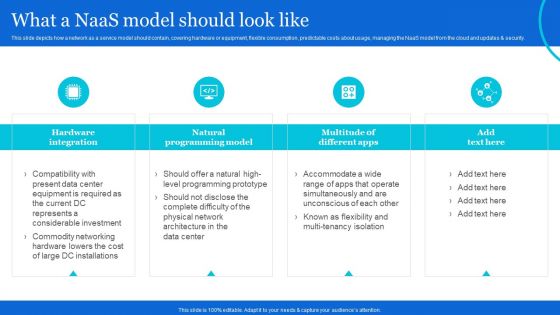
Naas Architectural Framework What A Naas Model Should Look Like Demonstration PDF
This slide depicts how a network as a service model should contain, covering hardware or equipment, flexible consumption, predictable costs about usage, managing the NaaS model from the cloud and updates and security. Want to ace your presentation in front of a live audience Our Naas Architectural Framework What A Naas Model Should Look Like Demonstration PDF can help you do that by engaging all the users towards you. Slidegeeks experts have put their efforts and expertise into creating these impeccable powerpoint presentations so that you can communicate your ideas clearly. Moreover, all the templates are customizable, and easy-to-edit and downloadable. Use these for both personal and commercial use.
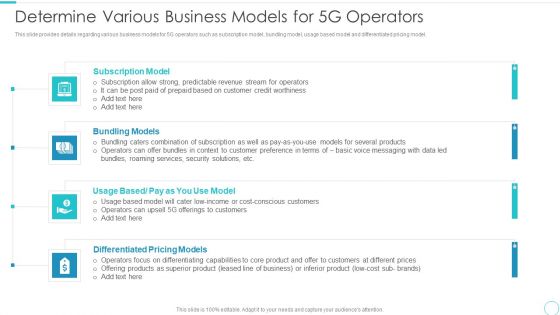
5G Evolution Architectural Technology Determine Various Business Models For 5G Operators Pictures PDF
This slide provides details regarding various business models for 5G operators such as subscription model, bundling model, usage based model and differentiated pricing model. Presenting 5G Evolution Architectural Technology Determine Various Business Models For 5G Operators Pictures PDF to provide visual cues and insights. Share and navigate important information on four stages that need your due attention. This template can be used to pitch topics like Bundling Models, Differentiated Pricing, Predictable Revenue In addtion, this PPT design contains high resolution images, graphics, etc, that are easily editable and available for immediate download.
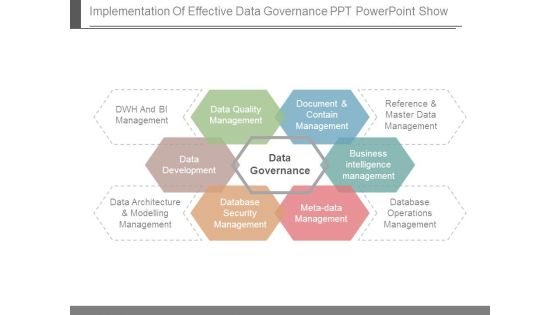
Implementation Of Effective Data Governance Ppt Powerpoint Show
This is a implementation of effective data governance ppt powerpoint show. This is a six stage process. The stages in this process are dwh and bi management, data quality management, document and contain management, reference and master data management, business intelligence management, database operations management, meta data management, database security management, data architecture and modelling management, data development, data governance.

Business Framework Benefits Of Business Intelligence PowerPoint Presentation
Define the benefits of business intelligence with our exclusive power point diagram slide. This diagram slide has been crafted with graphic of business intelligence model. This diagram represents the tools, systems and software to show the strategic planning process. Use this BI model for transforming raw data in in meaning full information.
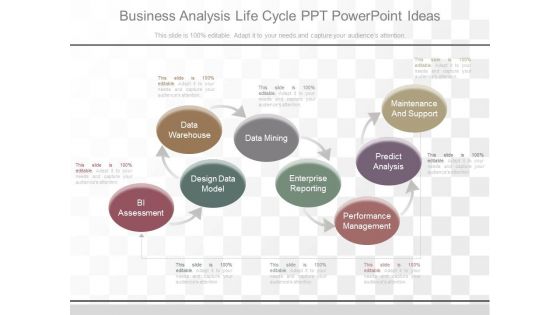
Business Analysis Life Cycle Ppt Powerpoint Ideas
This is a business analysis life cycle ppt powerpoint ideas. This is a eight stage process. The stages in this process are bi assessment, design data model, data warehouse, data mining, enterprise reporting, performance management, predict analysis, maintenance and support.
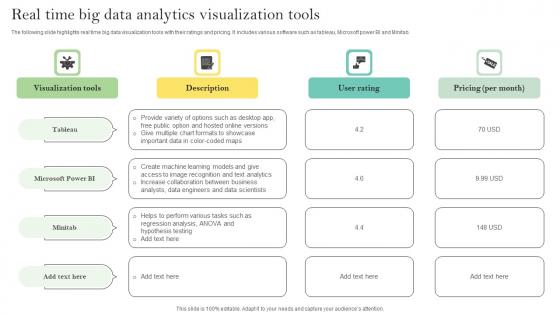
Real Time Big Data Analytics Visualization Tools Ppt Portfolio Example Pdf
The following slide highlights real time big data visualization tools with their ratings and pricing. It includes various software such as tableau, Microsoft power BI and Minitab. Pitch your topic with ease and precision using this Real Time Big Data Analytics Visualization Tools Ppt Portfolio Example Pdf. This layout presents information on Visualization Tools, User Rating, Pricing Per Month. It is also available for immediate download and adjustment. So, changes can be made in the color, design, graphics or any other component to create a unique layout.
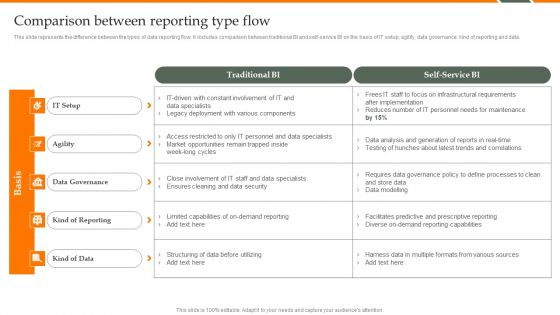
Human Resource Analytics Comparison Between Reporting Type Flow Demonstration PDF
This slide represents the difference between the types of data reporting flow. It includes comparison between traditional BI and self-service BI on the basis of IT setup, agility, data governance, kind of reporting and data. If your project calls for a presentation, then Slidegeeks is your go-to partner because we have professionally designed, easy-to-edit templates that are perfect for any presentation. After downloading, you can easily edit Human Resource Analytics Comparison Between Reporting Type Flow Demonstration PDF and make the changes accordingly. You can rearrange slides or fill them with different images. Check out all the handy templates.
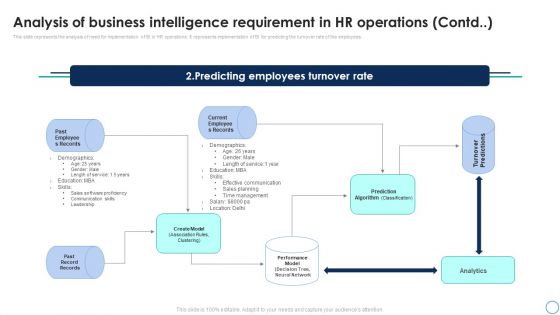
Business Analytics Application Analysis Of Business Intelligence Requirement In HR Infographics PDF
This slide represents the analysis of need for implementation of BI in HR operations. It represents implementation of BI for predicting the turnover rate of the employees. Create an editable Business Analytics Application Analysis Of Business Intelligence Requirement In HR Infographics PDF that communicates your idea and engages your audience. Whether youre presenting a business or an educational presentation, pre-designed presentation templates help save time. Business Analytics Application Analysis Of Business Intelligence Requirement In HR Infographics PDF is highly customizable and very easy to edit, covering many different styles from creative to business presentations. Slidegeeks has creative team members who have crafted amazing templates. So, go and get them without any delay.

Sustainable Initiatives For Competitive Business Intelligence Governance For Competitive Template PDF
This slide shows model which can guide companies in gaining competitive advantage through effective business intelligence BI governance. It provides information about BI deployment, internal resources, innovation perception, etc. If your project calls for a presentation, then Slidegeeks is your go-to partner because we have professionally designed, easy-to-edit templates that are perfect for any presentation. After downloading, you can easily edit Sustainable Initiatives For Competitive Business Intelligence Governance For Competitive Template PDF and make the changes accordingly. You can rearrange slides or fill them with different images. Check out all the handy templates
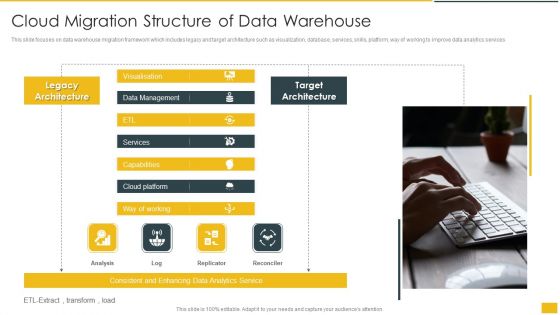
Cloud Migration Structure Of Data Warehouse Rules PDF
This slide focuses on data warehouse migration framework which includes legacy and target architecture such as visualization, database, services, skills, platform, way of working to improve data analytics services. Presenting Cloud Migration Structure Of Data Warehouse Rules PDF to dispense important information. This template comprises one stages. It also presents valuable insights into the topics including Target Architecture, Legacy Architecture, Data Management. This is a completely customizable PowerPoint theme that can be put to use immediately. So, download it and address the topic impactfully.
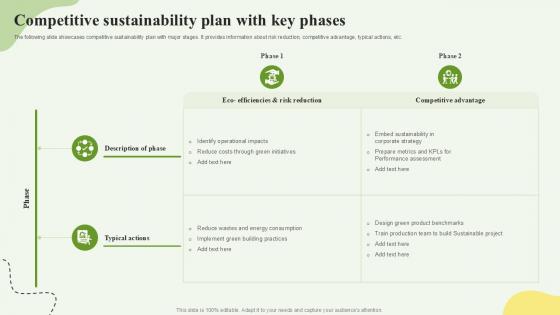
Competitive Sustainability Plan With Key Phases Ppt Template SS
This slide showcases dashboard for real estate company sales. This template aims to show a power bi dashboard for property dealer sales analysis representing total sales by project, actual sales, total revenue, number of contracts signed and marketing details. It is very useful tool for real estate developers and other property dealers. From laying roadmaps to briefing everything in detail, our templates are perfect for you. You can set the stage with your presentation slides. All you have to do is download these easy-to-edit and customizable templates. Competitive Sustainability Plan With Key Phases Ppt Template SS will help you deliver an outstanding performance that everyone would remember and praise you for. Do download this presentation today.

Tools For HR Business Analytics Roles And Responsibilities Of Business Intelligence Team Sample PDF
This slide represents the roles and responsibilities of people which would lead implementation proves and make architectural, technical and strategic decisions. It includes roles and responsibilities of Head of BI, BI engineer and data analyst. Retrieve professionally designed Tools For HR Business Analytics Roles And Responsibilities Of Business Intelligence Team Sample PDF to effectively convey your message and captivate your listeners. Save time by selecting pre-made slideshows that are appropriate for various topics, from business to educational purposes. These themes come in many different styles, from creative to corporate, and all of them are easily adjustable and can be edited quickly. Access them as PowerPoint templates or as Google Slides themes. You dont have to go on a hunt for the perfect presentation because Slidegeeks got you covered from everywhere.

Tools For HR Business Analytics Comparison Between Reporting Type Flow Inspiration PDF
This slide represents the difference between the types of data reporting flow. It includes comparison between traditional BI and self-service BI on the basis of IT setup, agility, data governance, kind of reporting and data. If you are looking for a format to display your unique thoughts, then the professionally designed Tools For HR Business Analytics Comparison Between Reporting Type Flow Inspiration PDF is the one for you. You can use it as a Google Slides template or a PowerPoint template. Incorporate impressive visuals, symbols, images, and other charts. Modify or reorganize the text boxes as you desire. Experiment with shade schemes and font pairings. Alter, share or cooperate with other people on your work. Download Tools For HR Business Analytics Comparison Between Reporting Type Flow Inspiration PDF and find out how to give a successful presentation. Present a perfect display to your team and make your presentation unforgettable.
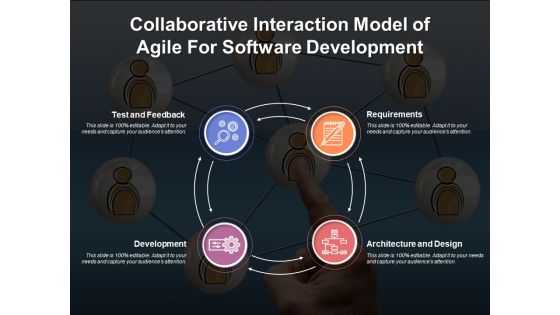
Collaborative Interaction Model Of Agile For Software Development Ppt PowerPoint Presentation Diagram Templates PDF
Presenting this set of slides with name collaborative interaction model of agile for software development ppt powerpoint presentation diagram templates pdf. This is a four stage process. The stages in this process are development, architecture and design, requirements. This is a completely editable PowerPoint presentation and is available for immediate download. Download now and impress your audience.

Data Interpretation And Analysis Playbook How To Bridge Business Intelligence And Predictive Analytics Challenges Designs PDF
This template depicts that with interactive BI visualization and predictive modeling in the same enterprise analytics platform, organizations can easily collaborate on initiatives that make recommended actions accessible to the business. Deliver an awe inspiring pitch with this creative data interpretation and analysis playbook how to bridge business intelligence and predictive analytics challenges designs pdf bundle. Topics like how to bridge business intelligence and predictive analytics challenges can be discussed with this completely editable template. It is available for immediate download depending on the needs and requirements of the user.

Data Interpretation And Analysis Playbook Business Intelligence And Predictive Analytics Challenges Template PDF
This template covers the problems while implementing BI and predictive analytics in the organization. The challenges are undefined KPIs and metrics, and unable to hire right data science talent. Presenting data interpretation and analysis playbook business intelligence and predictive analytics challenges template pdf to provide visual cues and insights. Share and navigate important information on two stages that need your due attention. This template can be used to pitch topics like security vulnerabilities, operationalizing, perform analysis, deployed. In addtion, this PPT design contains high resolution images, graphics, etc, that are easily editable and available for immediate download.
Information Visualizations Playbook Business Intelligence And Predictive Analytics Challenges Icons PDF
This template covers the problems while implementing BI and predictive analytics in the organization. The challenges are undefined KPIs and metrics, and unable to hire right data science talent. Presenting Information Visualizations Playbook Business Intelligence And Predictive Analytics Challenges Icons PDF to provide visual cues and insights. Share and navigate important information on two stages that need your due attention. This template can be used to pitch topics like Raw Data Organized, Security Vulnerabilities, Perform Analysis. In addtion, this PPT design contains high resolution images, graphics, etc, that are easily editable and available for immediate download.

How To Fix The Business Intelligence Problem Strategic Playbook For Data Analytics And Machine Learning Designs PDF
This template covers the solution for BI problems such as analytics transformation and business intelligence program. It also depicts that switching to next generation analytics platform that gives business users data driven insights. This is a How To Fix The Business Intelligence Problem Strategic Playbook For Data Analytics And Machine Learning Designs PDF template with various stages. Focus and dispense information on six stages using this creative set, that comes with editable features. It contains large content boxes to add your information on topics like Automated Data Analysis, Search Driven Analytics, Predictive Analytics. You can also showcase facts, figures, and other relevant content using this PPT layout. Grab it now.
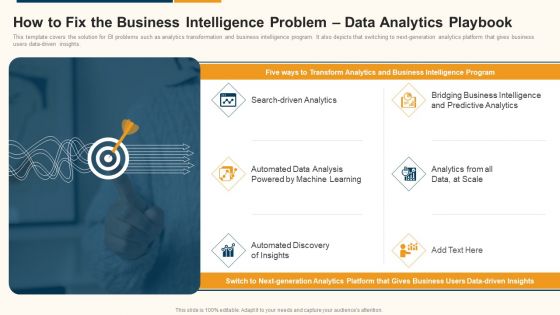
Data Interpretation And Analysis Playbook How To Fix The Business Intelligence Problem Data Analytics Playbook Sample PDF
This template covers the solution for BI problems such as analytics transformation and business intelligence program. It also depicts that switching to next-generation analytics platform that gives business users data-driven insights. Presenting data interpretation and analysis playbook how to fix the business intelligence problem data analytics playbook sample pdf to provide visual cues and insights. Share and navigate important information on six stages that need your due attention. This template can be used to pitch topics like analytics, business intelligence, predictive analytics. In addtion, this PPT design contains high resolution images, graphics, etc, that are easily editable and available for immediate download.
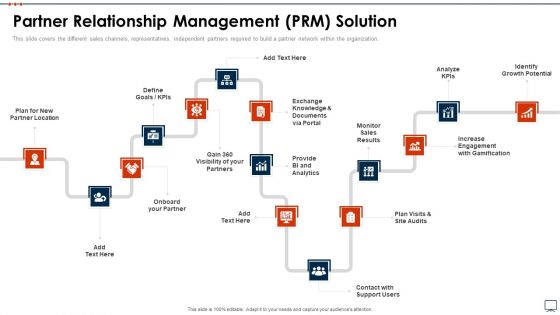
Business Plan Methods Tools And Templates Set 2 Partner Relationship Management PRM Solution Download PDF
This slide covers the different sales channels, representatives, independent partners required to build a partner network within the organization. Presenting business plan methods tools and templates set 2 partner relationship management prm solution download pdf to provide visual cues and insights. Share and navigate important information on one stages that need your due attention. This template can be used to pitch topics like analyze kpis, growth potential, monitor sales, provide bi and analytics. In addtion, this PPT design contains high resolution images, graphics, etc, that are easily editable and available for immediate download.
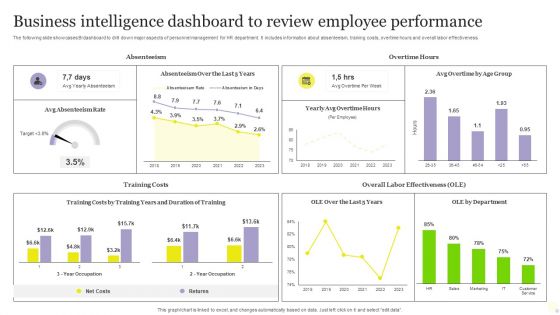
Business Intelligence Dashboard To Review Employee Performance Pictures PDF
The following slide showcases BI dashboard to drill down major aspects of personnel management for HR department. It includes information about absenteeism, training costs, overtime hours and overall labor effectiveness. Showcasing this set of slides titled Business Intelligence Dashboard To Review Employee Performance Pictures PDF. The topics addressed in these templates are Business Intelligence Dashboard, Review Employee Performance. All the content presented in this PPT design is completely editable. Download it and make adjustments in color, background, font etc. as per your unique business setting.
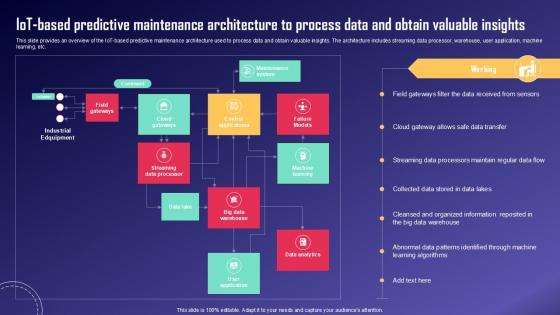
IoT Based Predictive Maintenance IoT Fleet Monitoring Ppt Template IoT SS V
This slide provides an overview of the IoT-based predictive maintenance architecture used to process data and obtain valuable insights. The architecture includes streaming data processor, warehouse, user application, machine learning, etc. The IoT Based Predictive Maintenance IoT Fleet Monitoring Ppt Template IoT SS V is a compilation of the most recent design trends as a series of slides. It is suitable for any subject or industry presentation, containing attractive visuals and photo spots for businesses to clearly express their messages. This template contains a variety of slides for the user to input data, such as structures to contrast two elements, bullet points, and slides for written information. Slidegeeks is prepared to create an impression.

Generic Big Data And Analytics Framework Themes PDF
This slide illustrate generic model of data and analytics architecture framework to get better understanding of data management. It includes elements such as operational sources, data integration, shared services, analytics etc. Showcasing this set of slides titled Generic Big Data And Analytics Framework Themes PDF. The topics addressed in these templates are Metadata, Data Quality, Governance. All the content presented in this PPT design is completely editable. Download it and make adjustments in color, background, font etc. as per your unique business setting.

Cognitive Visualizations Computing Strategy Addressing Cognitive Analytics Contd Introduction PDF
This slide provides information regarding cognitive analytics architecture representing different layers such as physical data layer, physical hardware layer, hardware abstraction layer, low - level data services layer. Deliver and pitch your topic in the best possible manner with this Cognitive Visualizations Computing Strategy Addressing Cognitive Analytics Contd Introduction PDF. Use them to share invaluable insights on Physical Data Layer, Physical Hardware, Hardware Abstraction and impress your audience. This template can be altered and modified as per your expectations. So, grab it now.

PowerPoint Slide Graphic Cycle Chart Ppt Design
PowerPoint_Slide_Graphic_Cycle_Chart_PPT_Design Business Power Points-Cycle Diagrams are a type of graphics that shows how items are related to one another in a repeating cycle. In a cycle diagram, you can explain the main events in the cycle, how they interact, and how the cycle repeats. These Diagrams can be used to interact visually and logically with audiences. -PowerPoint_Slide_Graphic_Cycle_Chart_PPT_Design Business Power Points

PowerPoint Slide Leadership Cycle Chart Ppt Design
PowerPoint_Slide_Leadership_Cycle_Chart_PPT_Design Business Power Points-Cycle Diagrams are a type of graphics that shows how items are related to one another in a repeating cycle. In a cycle diagram, you can explain the main events in the cycle, how they interact, and how the cycle repeats. These Diagrams can be used to interact visually and logically with audiences. -PowerPoint_Slide_Leadership_Cycle_Chart_PPT_Design Business Power Points
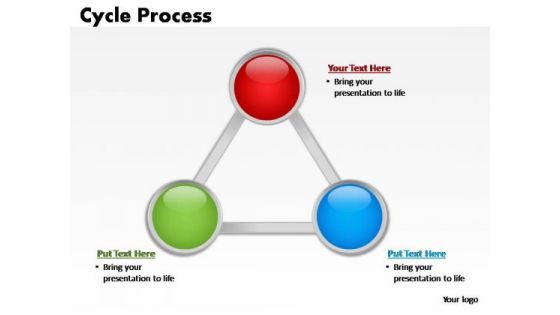
PowerPoint Slide Marketing Cycle Process Ppt Slide
PowerPoint_Slide_Marketing_Cycle_Process_PPT_Slide Business Power Points-Cycle Diagrams are a type of graphics that shows how items are related to one another in a repeating cycle. In a cycle diagram, you can explain the main events in the cycle, how they interact, and how the cycle repeats. These Diagrams can be used to interact visually and logically with audiences. -PowerPoint_Slide_Marketing_Cycle_Process_PPT_Slide Business Power Points
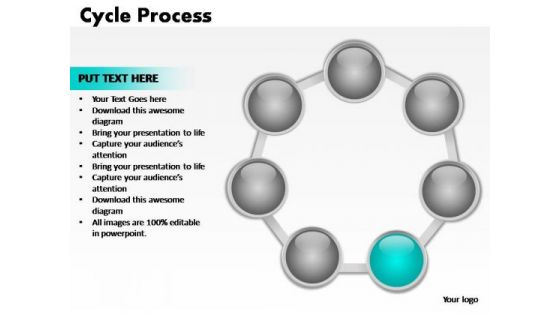
PowerPoint Slide Designs Process Cycle Process Ppt Designs
PowerPoint_Slide_Designs_Process_Cycle_Process_PPT_Designs Business Power Points-Cycle Diagrams are a type of graphics that shows how items are related to one another in a repeating cycle. In a cycle diagram, you can explain the main events in the cycle, how they interact, and how the cycle repeats. These Diagrams can be used to interact visually and logically with audiences. -PowerPoint_Slide_Designs_Process_Cycle_Process_PPT_Designs Business Power Points

PowerPoint Slide Designs Success Cycle Process Ppt Template
PowerPoint_Slide_Designs_Success_Cycle_Process_PPT_Template Business Power Points-Cycle Diagrams are a type of graphics that shows how items are related to one another in a repeating cycle. In a cycle diagram, you can explain the main events in the cycle, how they interact, and how the cycle repeats. These Diagrams can be used to interact visually and logically with audiences. -PowerPoint_Slide_Designs_Success_Cycle_Process_PPT_Template Business Power Points
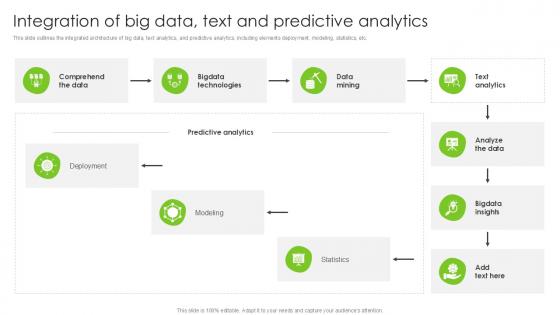
Integration Of Big Data Text And Predictive Analytics PPT Example SS
This slide outlines the integrated architecture of big data, text analytics, and predictive analytics, including elements deployment, modeling, statistics, etc. Welcome to our selection of the Integration Of Big Data Text And Predictive Analytics PPT Example SS. These are designed to help you showcase your creativity and bring your sphere to life. Planning and Innovation are essential for any business that is just starting out. This collection contains the designs that you need for your everyday presentations. All of our PowerPoints are 100Percent editable, so you can customize them to suit your needs. This multi-purpose template can be used in various situations. Grab these presentation templates today.
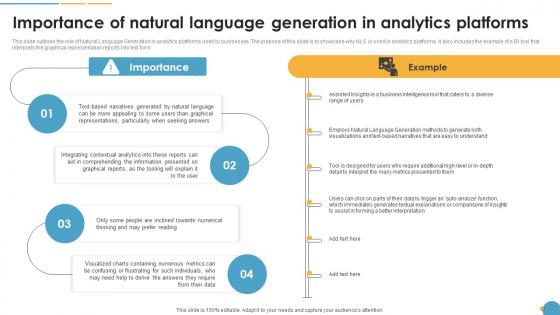
Importance Of Natural Language Generation In Analytics Platforms Natural Language Automation
This slide outlines the role of Natural Language Generation in analytics platforms used by businesses. The purpose of this slide is to showcase why NLG is used in analytics platforms. It also includes the example of a BI tool that interprets the graphical representation reports into text form. Explore a selection of the finest Importance Of Natural Language Generation In Analytics Platforms Natural Language Automation here. With a plethora of professionally designed and pre-made slide templates, you can quickly and easily find the right one for your upcoming presentation. You can use our Importance Of Natural Language Generation In Analytics Platforms Natural Language Automation to effectively convey your message to a wider audience. Slidegeeks has done a lot of research before preparing these presentation templates. The content can be personalized and the slides are highly editable. Grab templates today from Slidegeeks.

How To Bridge Business Intelligence And Predictive Analytics Challenges Mockup PDF
This template depicts that with interactive BI visualization and predictive modeling in the same enterprise analytics platform, organizations can easily collaborate on initiatives that make recommended actions accessible to the business. If you are looking for a format to display your unique thoughts, then the professionally designed How To Bridge Business Intelligence And Predictive Analytics Challenges Mockup PDF is the one for you. You can use it as a Google Slides template or a PowerPoint template. Incorporate impressive visuals, symbols, images, and other charts. Modify or reorganize the text boxes as you desire. Experiment with shade schemes and font pairings. Alter, share or cooperate with other people on your work. Download How To Bridge Business Intelligence And Predictive Analytics Challenges Mockup PDF and find out how to give a successful presentation. Present a perfect display to your team and make your presentation unforgettable.

Human Resource Analytics Analysis Of Business Intelligence Requirement Template PDF
This slide represents the need for implementing business intelligence in HR operations. It represents the requirement of prediction of employee performance for which BI is required. Do you know about Slidesgeeks Human Resource Analytics Analysis Of Business Intelligence Requirement Template PDF These are perfect for delivering any kind od presentation. Using it, create PowerPoint presentations that communicate your ideas and engage audiences. Save time and effort by using our pre-designed presentation templates that are perfect for a wide range of topic. Our vast selection of designs covers a range of styles, from creative to business, and are all highly customizable and easy to edit. Download as a PowerPoint template or use them as Google Slides themes.

Importance Of Natural Automated Content Generation PPT Sample
This slide outlines the role of Natural Language Generation in analytics platforms used by businesses. The purpose of this slide is to showcase why NLG is used in analytics platforms. It also includes the example of a BI tool that interprets the graphical representation reports into text form. Welcome to our selection of the Importance Of Natural Automated Content Generation PPT Sample. These are designed to help you showcase your creativity and bring your sphere to life. Planning and Innovation are essential for any business that is just starting out. This collection contains the designs that you need for your everyday presentations. All of our PowerPoints are 100Percent editable, so you can customize them to suit your needs. This multi-purpose template can be used in various situations. Grab these presentation templates today.
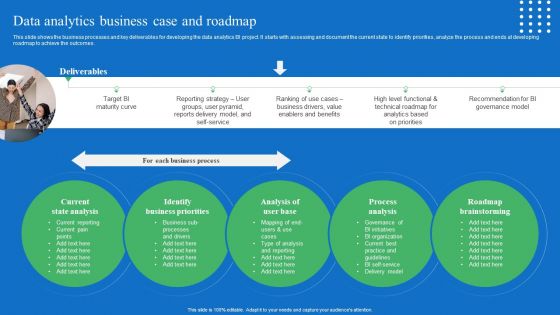
Toolkit For Data Science And Analytics Transition Data Analytics Business Case And Roadmap Designs PDF
This slide shows the business processes and key deliverables for developing the data analytics BI project. It starts with assessing and document the current state to identify priorities, analyze the process and ends at developing roadmap to achieve the outcomes. Get a simple yet stunning designed Toolkit For Data Science And Analytics Transition Data Analytics Business Case And Roadmap Designs PDF. It is the best one to establish the tone in your meetings. It is an excellent way to make your presentations highly effective. So, download this PPT today from Slidegeeks and see the positive impacts. Our easy to edit Toolkit For Data Science And Analytics Transition Data Analytics Business Case And Roadmap Designs PDF can be your go to option for all upcoming conferences and meetings. So, what are you waiting for Grab this template today.

Step 5 Employ Looker To Optimize Inventory Levels Data Analytics SS V
This slide explains use of inventory software aimed at helping businesses optimize inventory levels using effective analysis. It covers use of BI solution, vendor portal, hardware, accounting software, customer relationship management and enterprise resource planning.This modern and well-arranged Step 5 Employ Looker To Optimize Inventory Levels Data Analytics SS V provides lots of creative possibilities. It is very simple to customize and edit with the Powerpoint Software. Just drag and drop your pictures into the shapes. All facets of this template can be edited with Powerpoint, no extra software is necessary. Add your own material, put your images in the places assigned for them, adjust the colors, and then you can show your slides to the world, with an animated slide included.
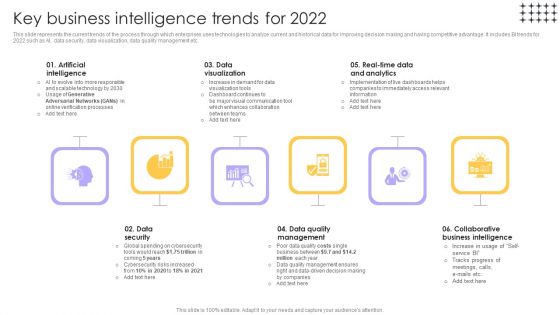
Tools For HR Business Analytics Key Business Intelligence Trends For 2022 Microsoft PDF
This slide represents the current trends of the process through which enterprises uses technologies to analyze current and historical data for improving decision making and having competitive advantage. It includes BI trends for 2022 such as AI, data security, data visualization, data quality management etc. Explore a selection of the finest Tools For HR Business Analytics Key Business Intelligence Trends For 2022 Microsoft PDF here. With a plethora of professionally designed and pre-made slide templates, you can quickly and easily find the right one for your upcoming presentation. You can use our Tools For HR Business Analytics Key Business Intelligence Trends For 2022 Microsoft PDF to effectively convey your message to a wider audience. Slidegeeks has done a lot of research before preparing these presentation templates. The content can be personalized and the slides are highly editable. Grab templates today from Slidegeeks.

Business Framework Predictive Analysis Enables Operational Insights PowerPoint Presentation
This Power Point template diagram slide has been designed with graphic of growth arrows with text boxes. This text box arrow contains the concept of predictive analysis for operational insights. Use this PPT slide for business operation related presentations.
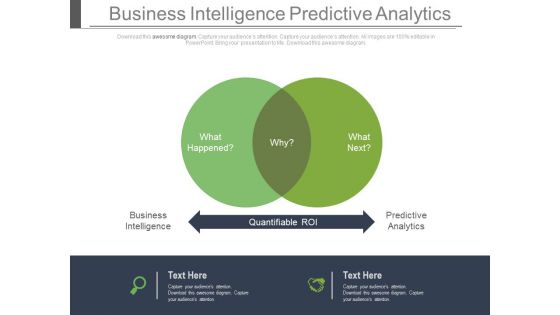
Venn Diagram For Business Intelligence And Predictive Analysis Powerpoint Slides
This power point template has been designed with two steps Venn diagram. Use this Venn diagram for business intelligence and predictive analysis. Illustrate your ideas and imprint them in the minds of your team with this template.
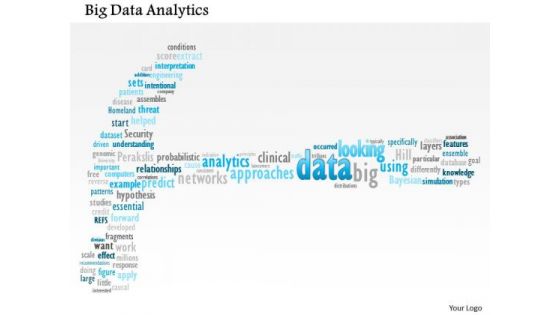
Business Framework Big Data Analytics PowerPoint Presentation
This unique power point diagram slide has been crafted with big data analytics. This data analytics is used to improve predictions and support decision making. Use this image slide for big data analysis related presentations.

Addressing Cognitive Analytics Cognitive Computing Action Plan Ppt Infographics Design Ideas PDF
This slide provides information regarding cognitive analytics architecture representing different layers such as high level data services layer, cognitive analytics layer, API layer and administration layer. This is a addressing cognitive analytics cognitive computing action plan ppt infographics design ideas pdf template with various stages. Focus and dispense information on four stages using this creative set, that comes with editable features. It contains large content boxes to add your information on topics like data services layer, cognitive analytics layer, api layer, administration layer. You can also showcase facts, figures, and other relevant content using this PPT layout. Grab it now.

Security Information And Event Management Strategies For Financial Audit And Compliance Security Intelligence Services Graphics PDF
This slide covers the security intelligence services such as cyber threat intelligence, incident and response management, cyber analytics, vulnerability management, etc. This is a security information and event management strategies for financial audit and compliance siem architecture topics pdf template with various stages. Focus and dispense information on five stages using this creative set, that comes with editable features. It contains large content boxes to add your information on topics like incident response and management, cyber analytics, vulnerability management, infrastructure management. You can also showcase facts, figures, and other relevant content using this PPT layout. Grab it now.
Leveraging NLP To Enhance Operational Efficiency Project Implementation Plan For NLP Icons PDF
This slide represents the project implementation plan for Natural Language Processing, including real-time inference architecture and its benefits such as simplified computer process, predictions, etc. Are you searching for a Leveraging NLP To Enhance Operational Efficiency Project Implementation Plan For NLP Icons PDF that is uncluttered, straightforward, and original Its easy to edit, and you can change the colors to suit your personal or business branding. For a presentation that expresses how much effort you have put in, this template is ideal. With all of its features, including tables, diagrams, statistics, and lists, its perfect for a business plan presentation. Make your ideas more appealing with these professional slides. Download Leveraging NLP To Enhance Operational Efficiency Project Implementation Plan For NLP Icons PDF from Slidegeeks today.
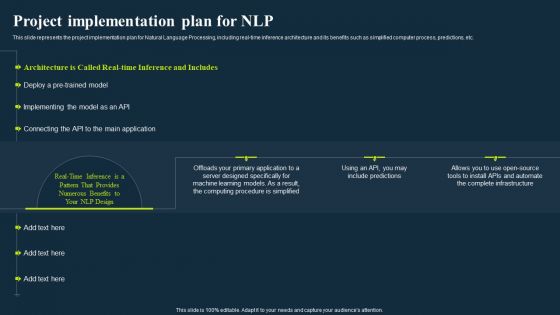
Integrating Nlp To Enhance Processes Project Implementation Plan For Nlp Summary PDF
This slide represents the project implementation plan for Natural Language Processing, including real-time inference architecture and its benefits such as simplified computer process, predictions, etc.Find highly impressive Integrating Nlp To Enhance Processes Project Implementation Plan For Nlp Summary PDF on Slidegeeks to deliver a meaningful presentation. You can save an ample amount of time using these presentation templates. No need to worry to prepare everything from scratch because Slidegeeks experts have already done a huge research and work for you. You need to download Integrating Nlp To Enhance Processes Project Implementation Plan For Nlp Summary PDF for your upcoming presentation. All the presentation templates are 100 precent editable and you can change the color and personalize the content accordingly. Download now.
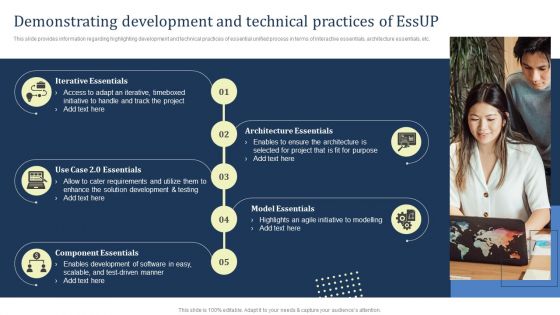
Demonstrating Development And Technical Practices Of Essup Sample PDF
This slide provides information regarding highlighting development and technical practices of essential unified process in terms of interactive essentials, architecture essentials, etc. Here you can discover an assortment of the finest PowerPoint and Google Slides templates. With these templates, you can create presentations for a variety of purposes while simultaneously providing your audience with an eye catching visual experience. Download Demonstrating Development And Technical Practices Of Essup Sample PDF to deliver an impeccable presentation. These templates will make your job of preparing presentations much quicker, yet still, maintain a high level of quality. Slidegeeks has experienced researchers who prepare these templates and write high quality content for you. Later on, you can personalize the content by editing the Demonstrating Development And Technical Practices Of Essup Sample PDF.
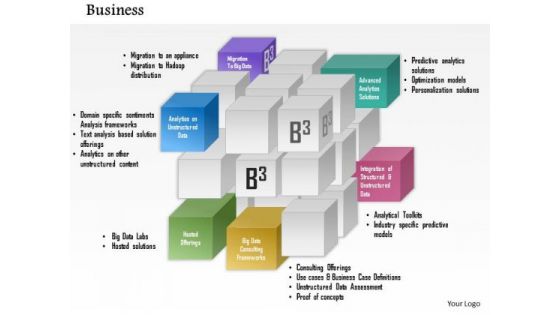
Business Framework Integrated Products And Services PowerPoint Presentation
This business framework power point diagram slide has been crafted for displaying business plan implementation. This PPT slide contains the cubical diagram to display multiple application of business plan. Use this PPT slide for Predictive analytics solutions, Optimization models and \nPersonalization solutions representation.
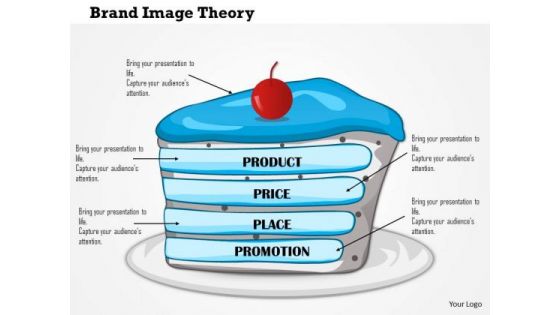
Business Framework Brand Image Theory PowerPoint Presentation
Colored chart graphic with multiple milestones has been used to decorate this Power Point template slide. This PPT slide contains the concept of data prediction. This slide shows big data from descriptive to predictive way. Use this PPT slide for business data analysis related presentation.
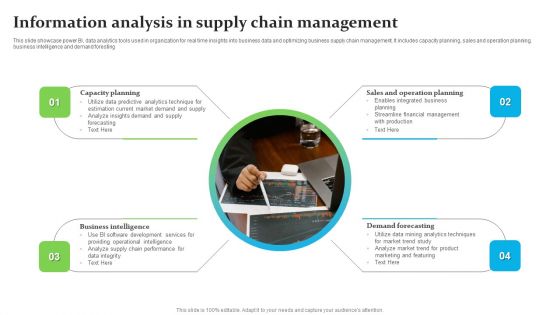
Information Analysis In Supply Chain Management Ppt Professional Clipart Images PDF
This slide showcase power BI, data analytics tools used in organization for real time insights into business data and optimizing business supply chain management. It includes capacity planning, sales and operation planning, business intelligence and demand foresting. Persuade your audience using this Information Analysis In Supply Chain Management Ppt Professional Clipart Images PDF. This PPT design covers four stages, thus making it a great tool to use. It also caters to a variety of topics including Capacity Planning, Demand Forecasting, Business Intelligence. Download this PPT design now to present a convincing pitch that not only emphasizes the topic but also showcases your presentation skills.
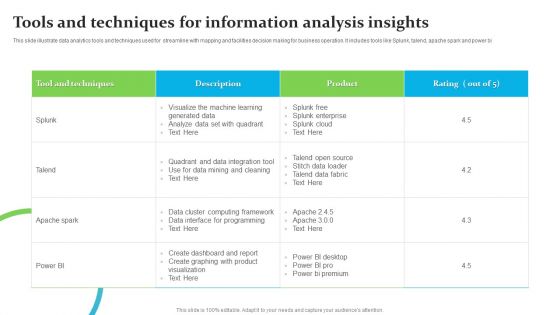
Tools And Techniques For Information Analysis Insights Ppt Outline Ideas PDF
This slide illustrate data analytics tools and techniques used for streamline with mapping and facilities decision making for business operation. It includes tools like Splunk, talend, apache spark and power bi. Pitch your topic with ease and precision using this Tools And Techniques For Information Analysis Insights Ppt Outline Ideas PDF. This layout presents information on Tool And Techniques, Product, Apache Spark. It is also available for immediate download and adjustment. So, changes can be made in the color, design, graphics or any other component to create a unique layout.

30 60 90 Day Strategic Account Plan Ppt Sample SS
This slide highlights dashboard for ecommerce sales using power bi. This slide aims to provide insights regarding sales by region, average order value, types of product sold , number of returns and specifies the reason for return. It acts as helpful tool for forecasting future sales and improving overall delivery processes. Find a pre-designed and impeccable 30 60 90 Day Strategic Account Plan Ppt Sample SS The templates can ace your presentation without additional effort. You can download these easy-to-edit presentation templates to make your presentation stand out from others. So, what are you waiting for Download the template from Slidegeeks today and give a unique touch to your presentation.
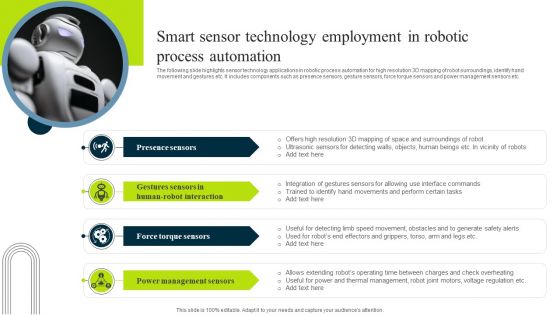
Smart Sensor Technology Employment In Robotic Process Automation Brochure PDF
The following slide highlights sensor technology applications in robotic process automation for high resolution 3D mapping of robot surroundings, identify hand movement and gestures etc. It includes components such as presence sensors, gesture sensors, force torque sensors and power management sensors etc. Persuade your audience using this Smart Sensor Technology Employment In Robotic Process Automation Brochure PDF. This PPT design covers four stages, thus making it a great tool to use. It also caters to a variety of topics including Presence Sensors, Interaction, Sensors. Download this PPT design now to present a convincing pitch that not only emphasizes the topic but also showcases your presentation skills.

Business Intelligence Roadmap Dashboard Ppt Powerpoint Graphic
This is a business intelligence roadmap dashboard ppt powerpoint graphic. This is a five stage process. The stages in this process are strategy roadmap, stakeholder management, architectural blueprint, capability improvement, implementation planning.
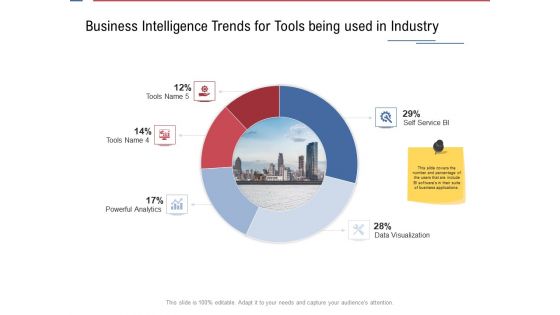
Data Assimilation Business Intelligence Trends For Tools Being Used In Industry Ppt Summary Graphics Design PDF
Deliver and pitch your topic in the best possible manner with this data assimilation business intelligence trends for tools being used in industry ppt summary graphics design pdf. Use them to share invaluable insights on self service bi, data visualization, powerful analytics and impress your audience. This template can be altered and modified as per your expectations. So, grab it now.
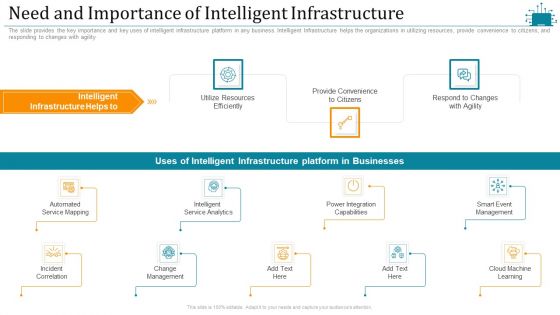
Cloud Intelligence Framework For Application Consumption Need And Importance Of Intelligent Infrastructure Sample PDF
The slide provides the key importance and key uses of intelligent infrastructure platform in any business. Intelligent Infrastructure helps the organizations in utilizing resources, provide convenience to citizens, and responding to changes with agility. This is a cloud intelligence framework for application consumption need and importance of intelligent infrastructure sample pdf template with various stages. Focus and dispense information on nine stages using this creative set, that comes with editable features. It contains large content boxes to add your information on topics like service mapping, change management, intelligent service analytics, power integration capabilities, cloud machine learning . You can also showcase facts, figures, and other relevant content using this PPT layout. Grab it now.

 Home
Home