Portfolio Risk Analysis

Last Year Summary Marketing Channels Ppt PowerPoint Presentation Infographics Background Designs
This is a last year summary marketing channels ppt powerpoint presentation infographics background designs. This is a six stage process. The stages in this process are finance, marketing, management, investment, analysis.
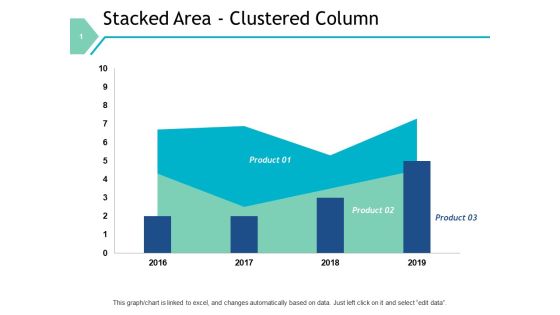
Stacked Area Clustered Column Graph Ppt PowerPoint Presentation File Designs Download
This is a stacked area clustered column graph ppt powerpoint presentation file designs download. This is a three stage process. The stages in this process are finance, marketing, management, investment, analysis.
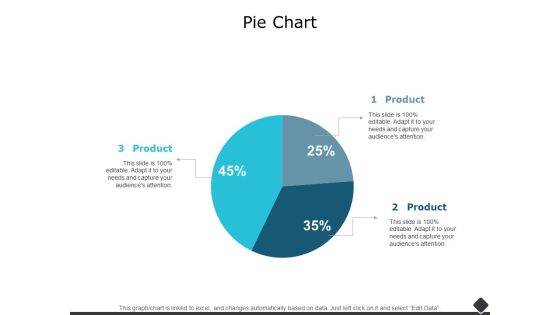
Pie Chart Finance Marketing Ppt PowerPoint Presentation Professional Design Ideas
This is a pie chart finance marketing ppt powerpoint presentation professional design ideas. The topics discussed in this diagram are finance, marketing, management, investment, analysis. This is a completely editable PowerPoint presentation, and is available for immediate download.
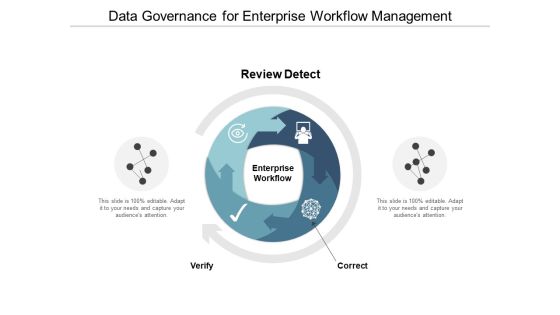
Data Governance For Enterprise Workflow Management Ppt PowerPoint Presentation Model Outline
This is a data governance for enterprise workflow management ppt powerpoint presentation model outline. This is a two stage process. The stages in this process are data analysis, data review, data evaluation.
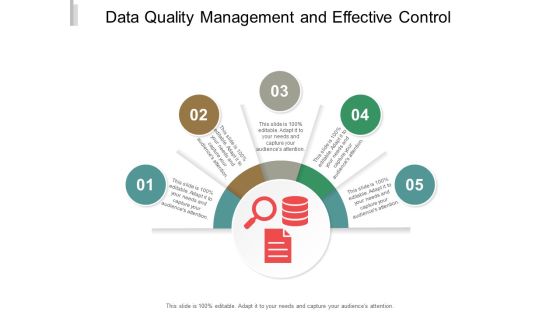
Data Quality Management And Effective Control Ppt PowerPoint Presentation Model Guidelines
This is a data quality management and effective control ppt powerpoint presentation model guidelines. This is a five stage process. The stages in this process are document review, document analysis, document evaluation.

Business Processes Automation Template Ppt Examples
This is a business processes automation template ppt examples. This is a five stage process. The stages in this process are business process modeling, business process analysis, business process optimization, business process automation, systems integration.
Business Plan Creation Powerpoint Slide Themes
This is a business plan creation powerpoint slide themes. This is a eight stage process. The stages in this process are market research, business model, marketing planning, long term goals, team building, development strategy, trend analysis.

Venture Capital Business Plan Powerpoint Slide Backgrounds
This is a venture capital business plan powerpoint slide backgrounds. This is a seven stage process. The stages in this process are business model, marketing planning, team building, development strategy, trend analysis, personal resources, market research.

Business Planning Layout Powerpoint Presentation Templates
This is a business planning layout powerpoint presentation templates. This is a seven stage process. The stages in this process are market research, business model, product description, long term, financial planning, marketing planning, competitor analysis.

Reducing Cost Vector Dollar Sign With Down Arrow Ppt Powerpoint Presentation Model Outline
This is a reducing cost vector dollar sign with down arrow ppt powerpoint presentation model outline. This is a four stage process. The stages in this process are data analysis, data science, information science.
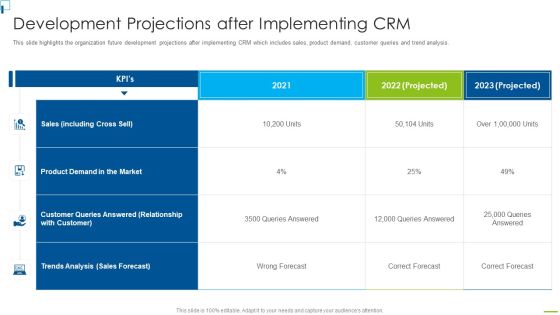
Designing And Deployment Development Projections After Implementing CRM Template PDF
This slide highlights the organization future development projections after implementing CRM which includes sales, product demand, customer queries and trend analysis. Deliver an awe inspiring pitch with this creative designing and deployment development projections after implementing crm template pdf bundle. Topics like product demand, market, trends analysis, sales forecast, sales, including cross sellcan be discussed with this completely editable template. It is available for immediate download depending on the needs and requirements of the user.

Agile Development Approach IT Extreme Programming 6 Phases Implementation Professional PDF
This slide depicts the phases of extreme programming such as planning, analysis, design, execution, wrapping, and closure and the tasks performed in each. Deliver and pitch your topic in the best possible manner with this Agile Development Approach IT Extreme Programming 6 Phases Implementation Professional PDF. Use them to share invaluable insights on Analysis, Planning, Design, Execution, Wrapping and impress your audience. This template can be altered and modified as per your expectations. So, grab it now.

Action Plan For Project Designing Proposal Ppt Inspiration Display PDF
This is a action plan for project designing proposal ppt inspiration display pdf template with various stages. Focus and dispense information on four stages using this creative set, that comes with editable features. It contains large content boxes to add your information on topics like research and analysis, budget allocation, action timeline, gap analysis. You can also showcase facts, figures, and other relevant content using this PPT layout. Grab it now.

Human Resource Management Division Of Retail Activities Customer Care Staff Tasks Ppt PowerPoint Presentation Slides Background Designs
This is a human resource management division of retail activities customer care staff tasks ppt powerpoint presentation slides background designs. This is a five stage process. The stages in this process are icons, management, strategy, analysis, marketing.

Retail Kpi Dashboard Showing Revenue Vs Units Sold Top 5 Product Categories Ppt PowerPoint Presentation Layouts Designs Download
This is a retail kpi dashboard showing revenue vs units sold top 5 product categories ppt powerpoint presentation layouts designs download. This is a four stage process. The stages in this process are finance, strategy, analysis, marketing.
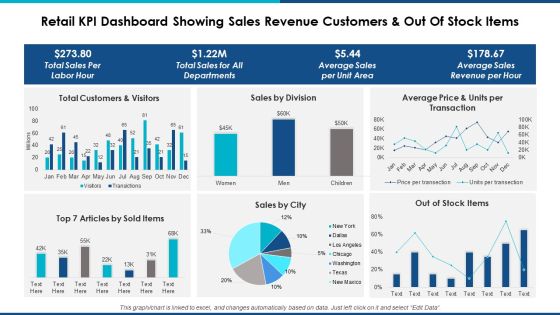
Retail Kpi Dashboard Showing Sales Revenue Customers And Out Of Stock Items Ppt Powerpoint Presentation Professional Background Designs
This is a retail kpi dashboard showing sales revenue customers and out of stock items ppt powerpoint presentation professional background designs. This is a six stage process. The stages in this process are finance, marketing, management, investment, analysis.
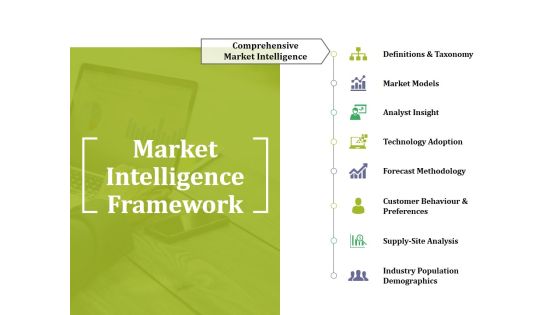
Market Intelligence Framework Ppt PowerPoint Presentation File Mockup
This is a market intelligence framework ppt powerpoint presentation file mockup. This is a eight stage process. The stages in this process are market models, analyst insight, technology adoption, forecast methodology, supply site analysis.

Market Intelligence Framework Ppt PowerPoint Presentation Outline Infographics
This is a market intelligence framework ppt powerpoint presentation outline infographics. This is a eight stage process. The stages in this process are definitions and taxonomy, market models, analyst insight, technology adoption, forecast methodology, supply site analysis.

Applied Enterprise Architecture Sample Diagram Ppt
This is a applied enterprise architecture sample diagram ppt. This is a eight stage process. The stages in this process are optimization, predictive modeling, forecasting and extrapolation, statistical analysis, alerts, dashboards query/drill down, ad-hoc reporting, standard reports.

Dynamic Systems Development Approach Mapping Of DSDM Practices With Development Microsoft PDF
This slide shows the mapping of DSDM practices with development phases, including planning, analysis, design, testing and deployment. Deliver an awe inspiring pitch with this creative Dynamic Systems Development Approach Mapping Of DSDM Practices With Development Microsoft PDF bundle. Topics like DSDM Practices, Planning, Analysis, Testing can be discussed with this completely editable template. It is available for immediate download depending on the needs and requirements of the user.

Critical Surveys For Market Research Example Ppt Image
This is a critical surveys for market research example ppt image. This is a seven stage process. The stages in this process are determine research design, data collection, visualization and analysis, define research objective, instrument development, data quality check, reporting.
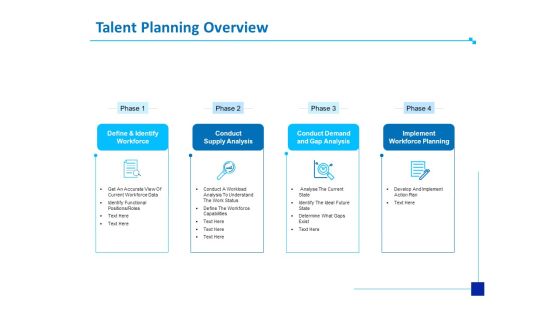
Strategic Talent Management Talent Planning Overview Ppt PowerPoint Presentation Summary Background Designs PDF
This is a strategic talent management talent planning overview ppt powerpoint presentation summary background designs pdf template with various stages. Focus and dispense information on four stages using this creative set, that comes with editable features. It contains large content boxes to add your information on topics like define and identify workforce, conduct supply analysis, conduct demand and gap analysis, implement workforce planning. You can also showcase facts, figures, and other relevant content using this PPT layout. Grab it now.

Business Framework Creative Funnel Diagram PowerPoint Presentation
This innovative image slide has been designed with graphic of business strategies in funnel. This business framework template may be used in your presentations to display business strategy analysis. This image slide will enhance the quality of your presentations.

Identify Right Customer Segments Example Ppt Slides Download
This is a identify right customer segments example ppt slides download. This is a five stage process. The stages in this process are other solutions, sales forecasting, churn modeling, customer analysis, measure data.
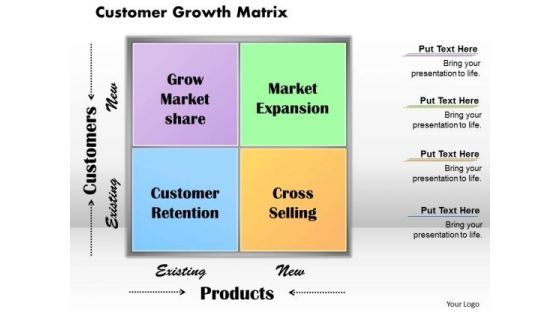
Business Framework Customer Growth Matrix PowerPoint Presentation
This innovative image slide has been designed to display marketing growth matrix. This business framework template may be used in your presentations to depict business marketing research analysis. This image slide will enhance the quality of your presentations.

10 Slides To An Awesome Pitch Ppt PowerPoint Presentation Background Images
This is a 10 slides to an awesome pitch ppt powerpoint presentation background images. This is a ten stage process. The stages in this process are business model, value proposition, title, competitive analysis, financial projections.

Marketing And Operation Powerpoint Slide Presentation Tips
This is a marketing and operation powerpoint slide presentation tips. This is a four stage process. The stages in this process are marketing and operation, finances and accounting, strategy and industry analysis, business model innovation.

Purpose Of Using Cmm Ppt PowerPoint Presentation Infographic Template Display
This is a purpose of using cmm ppt powerpoint presentation infographic template display. This is a five stage process. The stages in this process are maturity model provides, ion, strategy, analysis, business.

Company Growth Strategy Ppt PowerPoint Presentation Professional Slides
This is a consumer lifecycle icon slide business ppt powerpoint presentation model. This is a three stage process. The stages in this process are finance, marketing, analysis, investment, million.
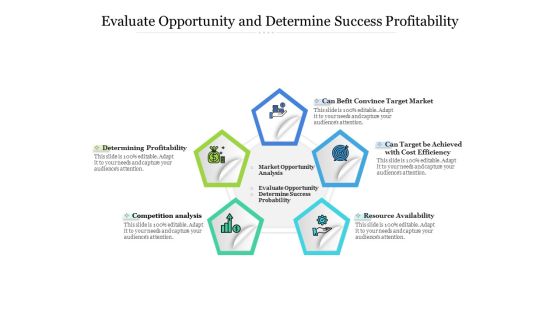
Evaluate Opportunity And Determine Success Profitability Ppt PowerPoint Presentation Infographic Template Design Inspiration PDF
Presenting this set of slides with name evaluate opportunity and determine success profitability ppt powerpoint presentation infographic template design inspiration pdf. This is a five stage process. The stages in this process are determining profitability, competition analysis, can befit convince target market, can target be achieved with cost efficiency, resource availability, market opportunity analysis, evaluate opportunity, determine success probability . This is a completely editable PowerPoint presentation and is available for immediate download. Download now and impress your audience.

Process Methodology Business Ppt Powerpoint Presentation Infographic Template Display
This is a process methodology business ppt powerpoint presentation infographic template display. This is a six stage process. The stages in this process are process methodology, analysis, design, icons, business.
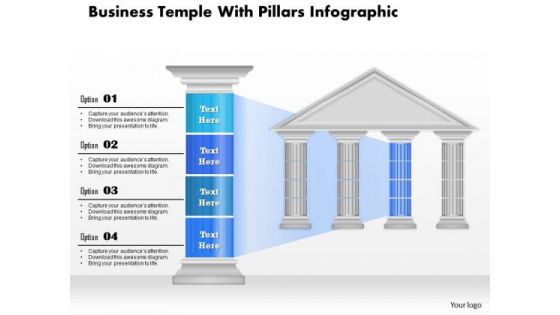
Business Diagram Business Temple With Pillars Infographic Presentation Template
This business power point template has been designed with business temple graphic. This image slide contains the concept of marketing strategies and business plan analysis. Highlight your business plans in any presentations with this exclusive temple design.

Business Diagram Business Temple With Text Blue Pillar Presentation Template
This business plan power point template has been designed with business temple graphic. This image slide contains the concept of marketing strategies and business plan analysis. Highlight your plans in any business presentations with this unique design.

Time Management Techniques For Successful Project Timeline For Implementing Project Management Activities Demonstration PDF
This slide shows the timeline for implementing project management tasks which includes analysis, design, development and testing with specifying requirements, analyzing workforce, performing initial test, etc.Deliver and pitch your topic in the best possible manner with this Time Management Techniques For Successful Project Timeline For Implementing Project Management Activities Demonstration PDF. Use them to share invaluable insights on Requirement Specification, Workforce Analysis, Develop Project and impress your audience. This template can be altered and modified as per your expectations. So, grab it now.

Market Opportunity Forecasts Example Presentation Visual Aids
This is a market opportunity forecasts example presentation visual aids. This is a eight stage process. The stages in this process are security audit, system integration, consoling training, solution architecture, analysis, account based intelligence, tools, models and forecasting.

Source Code Evaluation Ppt Template Powerpoint Slides Clipart
This is a source code evaluation ppt template powerpoint slides clipart. This is a five stage process. The stages in this process are source code, model extraction, analysis, syntax parser, result.
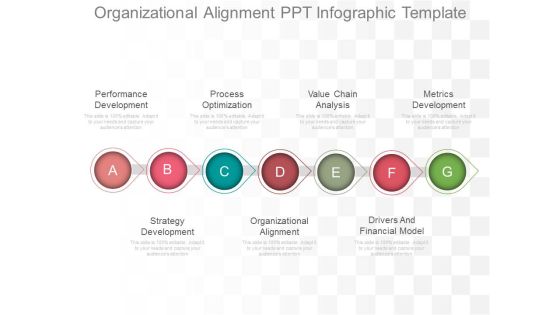
Organizational Alignment Ppt Infographic Template
This is a organizational alignment ppt infographic template. This is a seven stage process. The stages in this process are performance development, process optimization, value chain analysis, metrics development, strategy development, organizational alignment, drivers and financial model.

Pharmaceutical Marketing Trends Ppt Slides
This is a pharmaceutical marketing trends ppt slides. This is a five stage process. The stages in this process are model and forecasting, marketing, sales, analysis, account based intelligence.
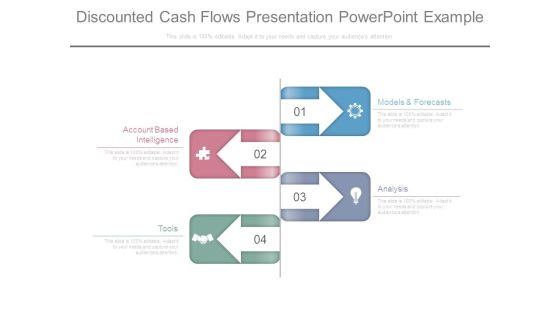
Discounted Cash Flows Presentation Powerpoint Example
This is a discounted cash flows presentation powerpoint example. This is a four stage process. The stages in this process are account based intelligence, tools, models and forecasts, analysis.
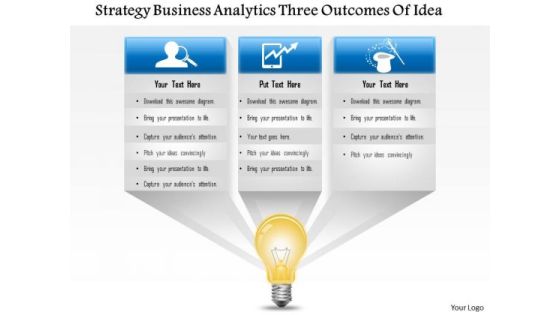
Business Framework Strategy Business Analytics 3 Outcomes Of Idea PowerPoint Presentation
A bulb with three text boxes has been used to design this PPT slide. This PPT slide contains the three outcomes for business analysis. Use this PPT slide for business presentations.
Business Diagram Business Man With Puzzles Icon Presentation Template
Graphic of business man with puzzles icons has been used to design this power point template. This diagram slide helps to portray concept like business strategy and analysis. Use this diagram to organize your thoughts and ideas.

Business Diagram Global Data Globe With Educational Components Presentation Template
This business diagram has been designed with graphic of globe with icons. Use our diagram slide to organize data and to display data analysis. This diagram is suitable for global business and marketing related presentations.

Business Framework Cyclical Placement Style For Strategy Map PowerPoint Presentation
A balancing scale style diagram has been used to design this PPT slide. This PPT slide contains the concept of cost benefit analysis. This PPT slide can be used for finance and money related topics in any presentation.

Business Diagram Seven Staged Reverse Pyramid For Data Presentation Template
This business slide is designed with seven staged pyramid diagram. Download this professional slide to depict sales and marketing analysis. This image slide is best to present your newer thoughts.
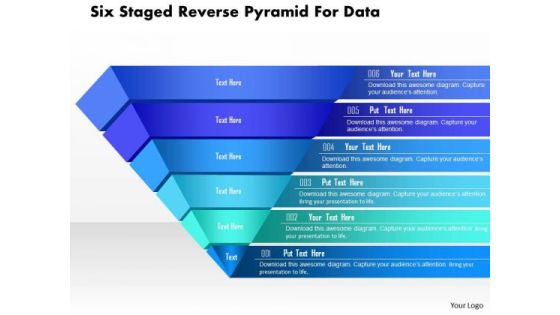
Business Diagram Six Staged Reverse Pyramid For Data Presentation Template
This business slide is designed with six staged pyramid diagram. Download this professional slide to depict sales and marketing analysis. This image slide is best to present your newer thoughts.

Business Diagram Exponentially Growing Big Data With Icons Surrounding Cloud Ppt Slide
This slide contains the graphic of clouds and icons. This diagram has been designed with concept of big data growth. This diagram displays the exponential growth of data analysis. Use this diagram slide for your data technology related presentations.
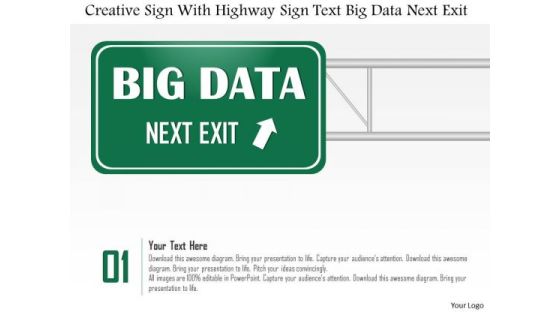
Business Diagram Creative Sign With Highway Sign Text Big Data Next Exit Ppt Slide
This diagram has been designed with graphic of magnifier and text boxes. These boxes are used to display creative sign and highway sign for big data analysis. This diagram can be used for data related topics in any presentation.
Pie Chart With Seven Business Icons Powerpoint Templates
Our compelling template consists with a design of pie chart with seven business icons. This slide has been professionally designed to exhibit financial ratio analysis. This template offers an excellent background to build impressive presentation.
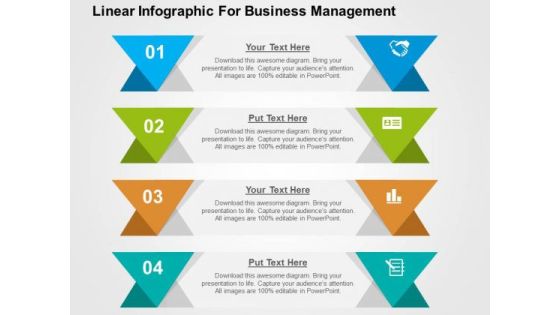
Linear Infographic For Business Management PowerPoint Template
Graphic of tags in linear flow has been used to design this business diagram. This diagram slide may be used to depict business steps in linear flow. Download this diagram for business research and analysis.

Business Continuity Planning Lifecycle Ppt Presentation Ideas
This is a business continuity planning lifecycle ppt presentation ideas. This is a five stage process. The stages in this process are maintenance, analysis, solution design, implementation, testing and acceptance, business continuity planning lifecycle.

Business Recovery Plan Template Presentation Images
This is a business recovery plan template presentation images. This is a four stage process. The stages in this process are business recovery plan, solution design, emergency response, analysis, maintenance.
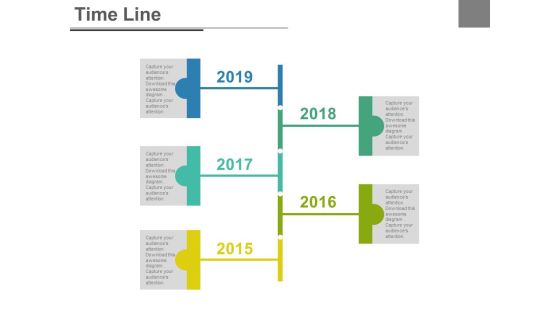
Five Staged Business Timeline Report Powerpoint Slides
This PowerPoint template has been designed with five staged business timeline report diagram. This PPT slide may be helpful to display year based business analysis. Download this PowerPoint timeline template to make impressive presentations.

Business Diagram Thermometer Graphics Indicating Progress Presentation Template
This power point template diagram has been designed with graphic of thermometer and bar graph. This PPT contains the concept of growth analysis. Use this PPT for business and marketing related presentations.

Three Graphs For Business PowerPoint Template
Adjust the above image into your Presentations to visually support your content. This slide has been professionally designed to exhibit business analysis. This template offers an excellent background to build impressive presentation.
Business Diagram Globe With Colorful Arrows And Icons Presentation Template
This business diagram has been designed with graphic of globe with arrow and icons. Use our diagram slide to organize data and to display data analysis. This diagram is suitable for global business and marketing related presentations.
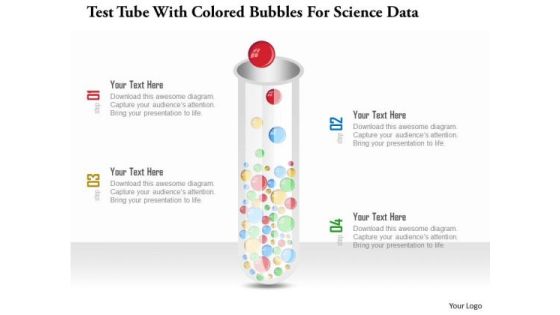
Business Diagram Test Tube With Colored Bubbles For Science Data Presentation Template
Test tubes with colored bubbles are used to design this power point template slide. This PPt slide contains the concept of science data analysis. Use this PPT slide for your business and science related presentations.

Circle Diagram For Business Marketing Mix Powerpoint Slides
This PowerPoint template has been designed with nine steps circle chart. This PPT slide can be used to prepare presentations for profit growth report and also for financial data analysis. You can download finance PowerPoint template to prepare awesome presentations.
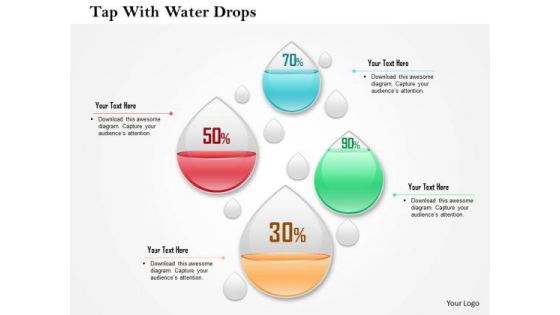
Business Diagram Four Water Drops With Percentage Values Presentation Template
This business diagram has been designed with graphic of four water drops and percentage values. This slide may be used to display percentage values for business analysis. Use this editable diagram for finance and business related presentations.

Key Steps To System Integration Deployment Information PDF Structure PDF
This slide covers significant steps to implement system integration to improve effectiveness. It involves approaches such as planning and utility analysis, architecture modelling, implementation and maintenance. Presenting Key Steps To System Integration Deployment Information PDF Structure PDF to dispense important information. This template comprises Four stages. It also presents valuable insights into the topics including Planning And Utility Analysis, Implementation, Maintenance. This is a completely customizable PowerPoint theme that can be put to use immediately. So, download it and address the topic impactfully.

Business Diagram Line Graph For Dollar Growth Presentation Template
Graphic of dollar symbol and growth arrow has been used to design this power point template. This diagram contains the concept of financial result analysis. Use this business diagram for finance related presentations
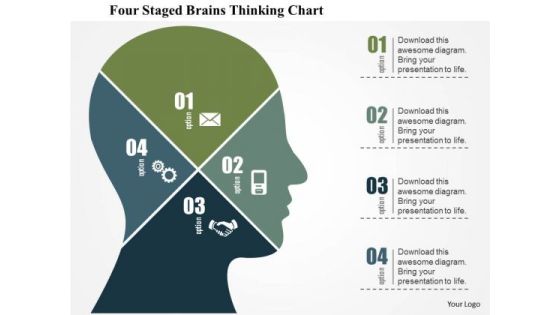
Business Diagram Four Staged Brains Thinking Chart Presentation Template
Graphic of four staged chart in human brain has been used to design this business diagram. This slide depicts concept of thinking process and analysis. Make your presentation more interactive with this business slide.

Implementing Agile Methodology Template Presentation Ideas
This is a implementing agile methodology template presentation ideas. This is a seven stage process. The stages in this process are requirement analysis, development, quality assurance, review, design, feedback, approve.

Major Steps In Data Profiling Solutions Methodology Ppt Ideas Information PDF
This slide shows major steps in data profiling methodology which contains analyzing possessions of columns, analyzing framework, simple data instruction analysis, compound data instruction analysis, value instruction analysis, etc. This can be beneficial for IT teams in removing corrupt data from system to maintain its speed and durability. Persuade your audience using this Major Steps In Data Profiling Solutions Methodology Ppt Ideas Information PDF. This PPT design covers two stages, thus making it a great tool to use. It also caters to a variety of topics including Inaccurate Data, Analyzing Framework, Value Instruction Analysis. Download this PPT design now to present a convincing pitch that not only emphasizes the topic but also showcases your presentation skills.

Improved Capacity Management Sample Diagram Ppt Slide
This is a improved capacity management sample diagram ppt slide. This is a eight stage process. The stages in this process are design, asset management, communication and corporation, it management, planning, maintenance, predictive analysis, real time monitoring, capacity management.
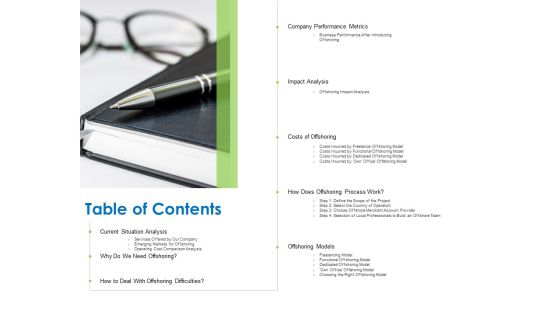
Relocation Of Business Process Offshoring Table Of Contents Ppt File Samples PDF
Presenting relocation of business process offshoring table of contents ppt file samples pdf to provide visual cues and insights. Share and navigate important information on one stages that need your due attention. This template can be used to pitch topics like company performance metrics, impact analysis, costs offshoring, offshoring process work, offshoring models, current situation analysis. In addition, this PPT design contains high-resolution images, graphics, etc, that are easily editable and available for immediate download.

Business Diagram Percentage Pie Chart On Computer Tablet Presentation Slide Template
This business diagram power point template has been designed with graphic of pie chart. This pie chart contains the various percentage values for business result analysis. Use this pie chart for your business result display related presentations.
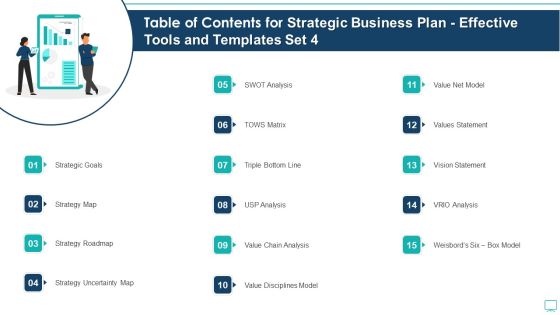
Table Of Contents For Strategic Business Plan Effective Tools And Templates Set 4 Ppt File Inspiration PDF
Presenting table of contents for strategic business plan effective tools and templates set 4 ppt file inspiration pdf to provide visual cues and insights. Share and navigate important information on fiften stages that need your due attention. This template can be used to pitch topics like strategic goals, vision statement, vrio analysis, value net model, swot analysis. In addtion, this PPT design contains high resolution images, graphics, etc, that are easily editable and available for immediate download.

Flat Infographics With Web Elements PowerPoint Templates
Use this diagram of flat Infographics to illustrate business processes. This web elements diagram may also be used to display flow of business steps. This slide is designed to attract the attention of your audience towards business process analysis.

Post Merger Integration Framework Presentation Ideas
This is a post merger integration framework presentation ideas. This is a eight stage process. The stages in this process are target screening, integration, situation analysis, implementation, m and a strategy development, transaction mechanics, framework development, design.
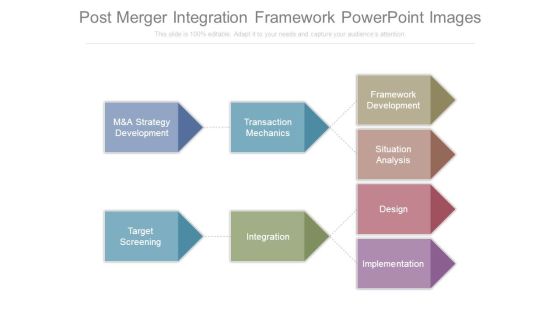
Post Merger Integration Framework Powerpoint Images
This is a post merger integration framework powerpoint images. This is a eight stage process. The stages in this process are m and a strategy development, target screening, transaction mechanics, integration, framework development, situation analysis, design, implementation.

Technology Innovation Strategy Diagram Powerpoint Show
This is a technology innovation strategy diagram powerpoint show. This is a three stage process. The stages in this process are strategy, solution, support, research, strategy, analysis, architecture, release, build, envision, design, transition, support.
Three Staged Square Step Diagram And Icons Powerpoint Template
Graphic square step with icons has been used to design this business diagram. This diagram slide may be used to depict order of business steps. Download this diagram for business research and analysis.
Framework Of Social Media Strategy Diagram Ppt Icon
This is a framework of social media strategy diagram ppt icon. This is a ten stage process. The stages in this process are team, analysis, linkedin, facebook, twitter, management, promotion, social media, client newsletters, web design.

Test Tubes With Percentage Data For Comparison Powerpoint Slides
This PowerPoint template has been designed with test tubes and percentage data. You may download this PPT slide to display data comparison and analysis. Add this slide to your presentation and impress your superiors.

Bar Graph For Marketing Research Data Powerpoint Slides
This PowerPoint template has been designed with diagram of bar graph. This PPT slide can be used to prepare presentations for profit growth report and also for financial data analysis. You can download finance PowerPoint template to prepare awesome presentations.

Tablet With Bar Graph And Pie Chart Powerpoint Templates
This business slide has been designed with business graphs on computer tablet. You may download this PPT slide to display statistical analysis. This slide will help you to sequence your thoughts.

Structural Engineering Ppt Template Powerpoint Templates
This is a structural engineering ppt template powerpoint templates. This is a four stage process. The stages in this process are structural analysis, architectural design, numerical method, data design.

Traditional Assessment Template Ppt Examples
This is a traditional assessment template ppt examples. This is a six stage process. The stages in this process are analysis, requirement specification, design, testing and integration, operation and maintenance, data design.
Three Sections In Cube With Icons Powerpoint Template
Our above PowerPoint template has been designed with graphics of cube with icons. This PPT slide is designed for business strategy analysis. Add this diagram in your presentations to visually support your content.
Four Circles Venn Diagram With Icons Powerpoint Slides
Four circles Venn diagram has been used to design this power point template. This PPT helps to portray the concept of business data analysis. Use this PPT for your business and marketing related presentations.
Two Circles Venn Diagram With Icons Powerpoint Slides
Venn diagram of two circles has been used to design this power point template. This PPT helps to portray the concept of business data analysis. Use this PPT for your business and marketing related presentations.

Semicircle With Five Circles Of Percentage Values Powerpoint Template
This PowerPoint template has been designed with graphics of semicircle with five percentage values. This business design can be used for financial ratio analysis. Capture the attention of your audience with this slide.

Colorful Cards With Icons For Technology Powerpoint Templates
This slide has been designed with graphics of colorful cards with icons of bulb, dollar, gear and magnifier. You may download this slide for financial analysis. Deliver amazing presentations to mesmerize your audience.
Test Tubes With Financial Data In Percentage Ratio Powerpoint Slides
This PowerPoint template contains graphics of test tubes with percentage values. You may download this PPT slide design to display financial ratio analysis. You can easily customize this template to make it more unique as per your need.
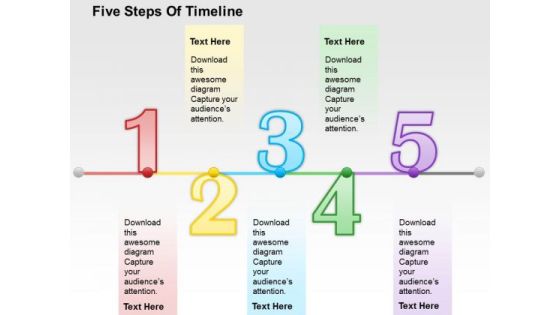
Five Steps Of Timeline PowerPoint Template
This business slide has been designed with graphics of business timeline. You may download this diagram to display timeline, planning and business analysis. Download this diagram slide to make impressive presentations.

Four Syringes In Linear Flow PowerPoint Template
Graphic of four syringes in linear flow has been used to design this business diagram. This diagram slide may be used to depict business steps in linear flow. Download this diagram for business research and analysis.

Linear Arrows For Process Flow PowerPoint Template
Graphic of arrows in linear flow has been used to design this business diagram. This diagram slide may be used to depict business steps in linear flow. Download this diagram for business research and analysis.

Business Process Of Consulting Methodology Ppt PowerPoint Presentation Show Images
Presenting this set of slides with name business process of consulting methodology ppt powerpoint presentation show images. This is a five stage process. The stages in this process are Analysis, Educate, Architect, Validate, Manage, Project Planning, Leading Practice Education, Final Design, Process And Data Confirmation, Best In Class Process, Mitigate Exception, Process Analysis. This is a completely editable PowerPoint presentation and is available for immediate download. Download now and impress your audience.
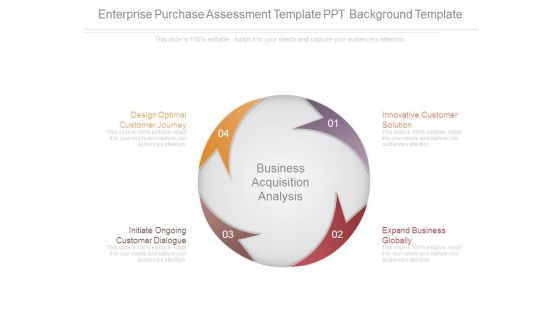
Enterprise Purchase Assessment Template Ppt Background Template
This is a enterprise purchase assessment template ppt background template. This is a four stage process. The stages in this process are innovative customer solution, expand business globally, initiate ongoing customer dialogue, design optimal customer journey, business acquisition analysis.

Year Based Workflow Timeline Diagram Powerpoint Template
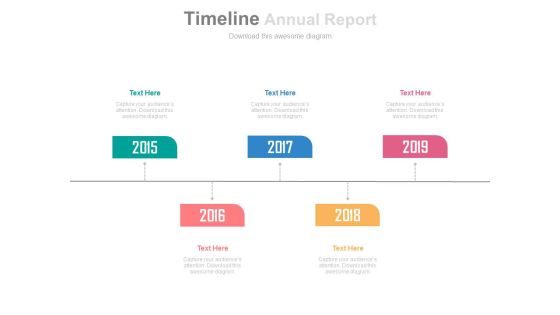
Five Staged Annual Report With Year Based Tags Powerpoint Slides
This PowerPoint timeline slide design can be used to display yearly business report. This timeline template can be used in presentations where you need to display a roadmap or it may be used for business target analysis.

Example Of B2b Conversion Rate Optimization Ppt Powerpoint Slides Template
This is a example of b2b conversion rate optimization ppt powerpoint slides template. This is a eight stage process. The stages in this process are homepage, framework, contact page, enquiry, results analysis, development, hypothesis creation, design of experiments.
Three Text Boxes With Percentage Values And Icons Powerpoint Slides
This PowerPoint template has been designed with text boxes and percentage data. You may download this PPT slide to display data comparison and analysis. Add this slide to your presentation and impress your superiors.
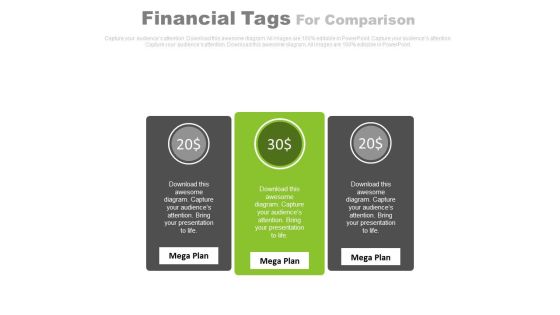
Three Text Tags Compare Chart Powerpoint Slides
This PowerPoint template has been designed with text tags and percentage data. You may download this PPT slide to display data comparison and analysis. Add this slide to your presentation and impress your superiors.
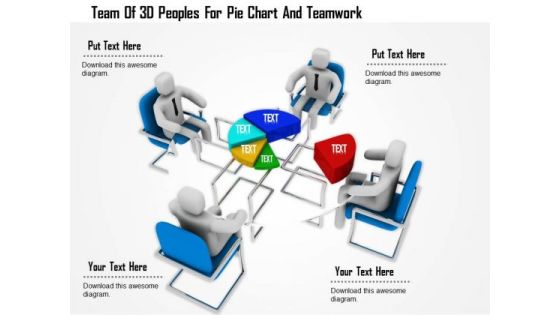
Team Of 3d Peoples For Pie Chart And Teamwork
This Power Point template has been designed with graphic of 3d team forming a pie chart. In this slide team is displaying data analysis. Use this editable slide to build innovative presentation for your viewers.

Bar Graph For Marketing Research Process Powerpoint Slides
This PowerPoint template has been designed with diagram of bar graph. This PPT slide can be used to prepare presentations for profit growth report and also for financial data analysis. You can download finance PowerPoint template to prepare awesome presentations.

Four Pyramids With Growth Steps Powerpoint Slides
This business slide has been designed with four pyramids. This PowerPoint template may use to display sales growth and analysis. Prove the viability of your ideas using this impressive slide.

Circular Arrows Flow Diagram Powerpoint Template
This power point template has been designed with graphics of circular arrow flow diagram. This PPT diagram may be used to display marketing analysis. Use this PPT diagram for business presentations.

Circular Infographics Puzzle Diagram With Icons Powerpoint Template
This power point template has been designed with circular infographic puzzle diagram. This PPT diagram may be used to display marketing analysis. Use this PPT diagram for business presentations.

Circular Process Arrows Infographic Diagram Powerpoint Template
This power point template has been designed with graphics of circular arrow flow diagram. This PPT diagram may be used to display marketing analysis. Use this PPT diagram for business presentations.

Circular Process Flow Diagram And Icons Powerpoint Template
This power point template has been designed with graphics of circular process flow diagram. This PPT diagram may be used to display marketing analysis. Use this PPT diagram for business presentations.

Circular Process Flow Infographic Powerpoint Template
This power point template has been designed with graphics of circular process infographic. This PPT diagram may be used to display marketing analysis. Use this PPT diagram for business presentations.

Circular Workflow Diagram With Icons Powerpoint Template
This power point template has been designed with graphics of circular process infographic. This PPT diagram may be used to display marketing analysis. Use this PPT diagram for business presentations.

Circular Arrows Infographic For Marketing Research Powerpoint Template
This PPT slide has been designed with circular arrows infographic diagram. This business diagram is suitable for marketing research and analysis. This professional slide helps in making an instant impact on viewers.
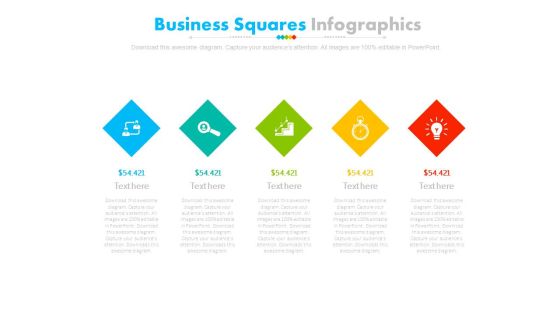
Five Steps Diamond Infographic Diagram Powerpoint Slides
This PowerPoint template has been designed with alphabet steps with icons. This PPT slide may be used to display financial strategy analysis. Make outstanding business presentation with this template.
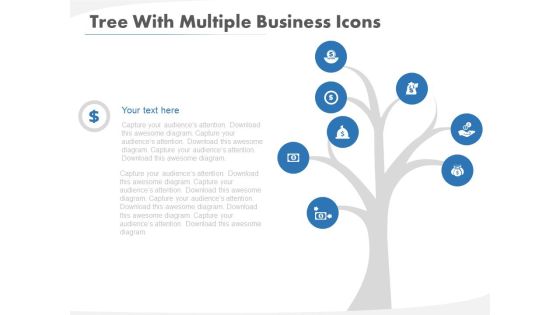
Tree Diagram For Strategic Planning Methods Powerpoint Template
This PowerPoint template has been designed with tree diagram and icons. This diagram slide may be used to depict strategic planning methods. Download this diagram for business research and analysis.
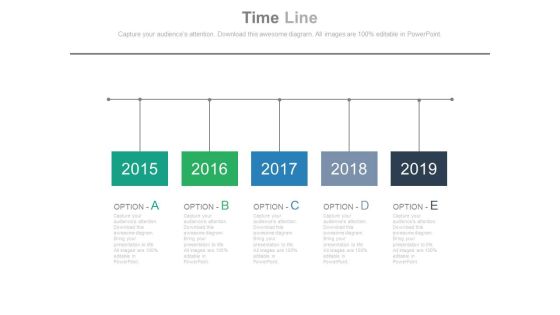
Five Options Timeline Diagram With Years Tags Powerpoint Slides
This PowerPoint template has been designed with five options timeline diagram with years tags. This PPT slide may be helpful to display year based business analysis. Download this PowerPoint timeline template to make impressive presentations.
Five Pointers Timeline Diagram With Icons Powerpoint Slides
This PowerPoint template has been designed with five pointers timeline diagram with icons. This PPT slide may be helpful to display business growth and analysis. Download this PowerPoint timeline template to make impressive presentations.
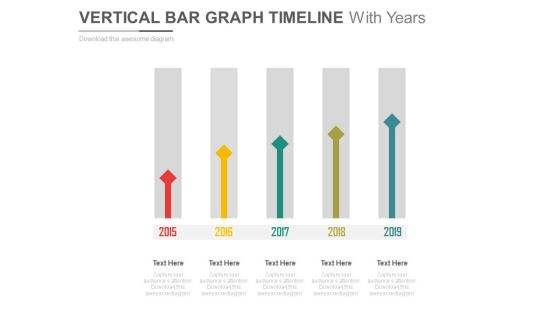
Vertical Arrows Timeline With Years Powerpoint Slides
This PowerPoint template has been designed with sequential arrows timeline diagram. This PPT slide may be helpful to display year based business analysis. Download this PowerPoint timeline template to make impressive presentations.

Three Arrows With Years For Timeline Planning Powerpoint Slides
This PowerPoint template has been designed with three arrows and years. This timeline template may be used to display business planning and analysis. Download this PowerPoint timeline template to make impressive presentations.
Two Layered Venn Diagram With Icons Powerpoint Slides
This power point template has been designed with graphic of two layered Venn diagram. Use this Venn diagram for business strategy and analysis. Illustrate your ideas and imprint them in the minds of your team with this template.

Operation Assessment Template Powerpoint Slide Rules
This is a operation assessment template powerpoint slide rules. This is a five stage process. The stages in this process are define cooperation, business case, interface analysis, interface design, interface testing.

Meet Our Team Ppt PowerPoint Presentation Professional File Formats
This is a meet our team ppt powerpoint presentation professional file formats. This is a one stage process. The stages in this process are business, strategy, analysis, elisa denver, peter russo, web designer.
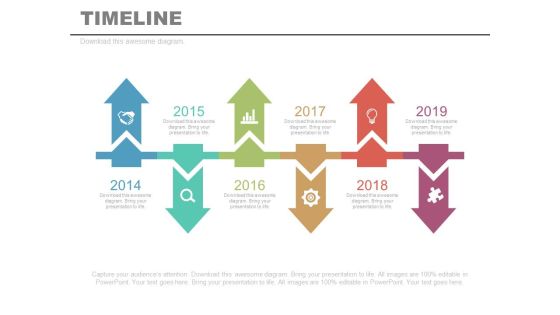
Six Linear Timeline Arrows Year Diagram Powerpoint Slides
This PowerPoint template has been designed with linear timeline steps. This PPT slide may be helpful to display year based business analysis. Download this PowerPoint timeline template to make impressive presentations.

Timeline Operations Managed As Group Powerpoint Slides
This PowerPoint timeline slide design can be used to display timeline operations. It contains sequential timeline diagram with business group. This timeline template can be used in presentations where you need to display team planning and analysis.

Pyramid For Financial Accounting Information Powerpoint Slides
This PowerPoint template has been designed with graphics of pyramid chart. This PPT slide can be used to prepare presentations for profit growth report and also for financial data analysis. You can download finance PowerPoint template to prepare awesome presentations.
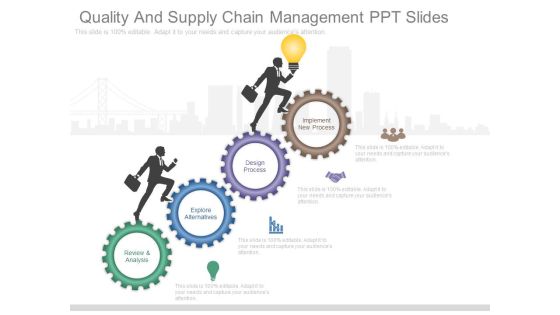
Quality And Supply Chain Management Ppt Slides
This is a quality and supply chain management ppt slides. This is a four stage process. The stages in this process are implement new process, design process, explore alternatives, review and analysis.

Business Improvement Process Framework Ppt PowerPoint Presentation Slide
Presenting this set of slides with name business improvement process framework ppt powerpoint presentation slide. This is a five stage process. The stages in this process are Analysis, Educate, Architect, Validate, Manage, Project Planning, Leading Practice Education, Final Design, Process And Data Confirmation, Best In Class Process, Mitigate Exception, Process Analysis. This is a completely editable PowerPoint presentation and is available for immediate download. Download now and impress your audience.
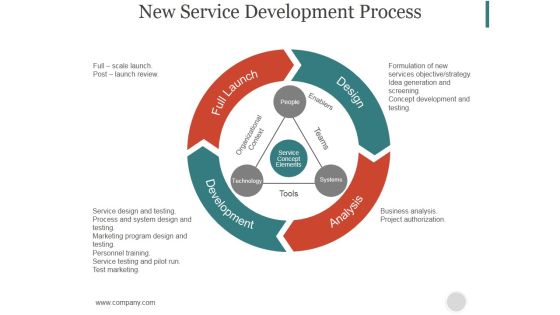
New Service Development Process Ppt PowerPoint Presentation Templates
This is a new service development process ppt powerpoint presentation templates. This is a four stage process. The stages in this process are full launch, design, development, analysis, elements, tools.

IT Business Project Management Using Investment Evaluation Elements PDF
This slide signifies the information technology project administration using investment analysis. It covers information about cost like hardware, telecommunication equipments, training, software maintenance, help desk support. Showcasing this set of slides titled IT Business Project Management Using Investment Evaluation Elements PDF. The topics addressed in these templates are Quantitative Analysis, Telecommunication Equipments, Software Maintenance. All the content presented in this PPT design is completely editable. Download it and make adjustments in color, background, font etc. as per your unique business setting.


 Continue with Email
 Sign up for an account
 Home
Home