Portfolio Analysis

Business Diagram Infographic For Business Analysis Presentation Template
This business diagram contains business infographic. Our professionally designed business diagram helps to depict business analysis. Enlighten your audience with your breathtaking ideas.

Venn Circles Infographic For Financial Analysis PowerPoint Templates
This PowerPoint template has been designed with Venn circles infographic. This infographic template useful for financial analysis. Accelerate the impact of your ideas using this template.
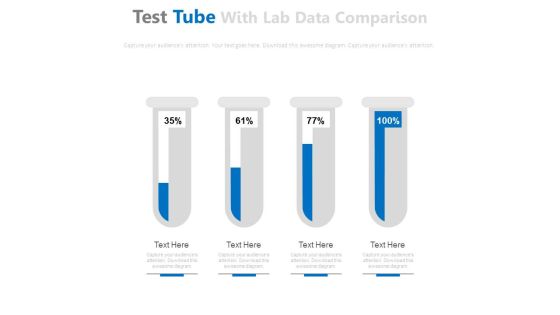
Test Tubes For Financial Ratio Analysis Powerpoint Slides
This PowerPoint template has been designed with graphics of test tubes. Use this PPT slide to depict financial ratio analysis. Download this PPT template to make impressive presentations.

World Map For Global Business Analysis Powerpoint Slides
This professionally designed PowerPoint template displays diagram of world map. You can download this diagram to exhibit global business analysis. Above PPT slide is suitable for business presentation.

Venn Diagram For Business Intelligence And Predictive Analysis Powerpoint Slides
This power point template has been designed with two steps Venn diagram. Use this Venn diagram for business intelligence and predictive analysis. Illustrate your ideas and imprint them in the minds of your team with this template.
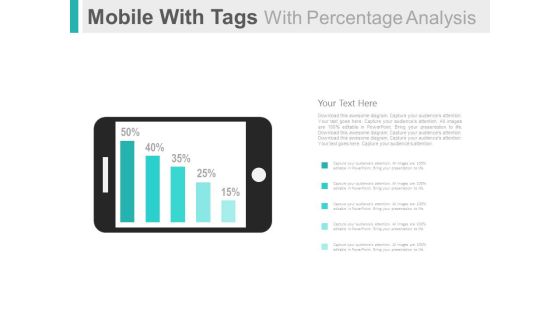
Mobile For Online Survey And Analysis Powerpoint Slides
This PowerPoint template has been designed with graphics of mobile and percentage bar graph. This PPT slide can be used to display online survey and analysis. You can download finance PowerPoint template to prepare awesome presentations.

Three Arrow Tags For Data Analysis PowerPoint Template
Our professionally designed business diagram is as an effective tool to display data analysis. It contains graphics of three arrow tags. This template is specifically created to highlight you points.

Finger Print Circuit For Security Analysis Powerpoint Template
This PowerPoint template has been designed with finder print circuit diagram. Download this diagram to display technology and security analysis. Download this diagram slide to make impressive yet unique presentations.
Four Cubes For Financial Ratio Analysis Powerpoint Template
This business slide displays graphics of four cubes. This PPT slide has been designed to portray concept of financial ratio analysis. Download this PPT slide design to make interactive presentations.
Four Cubes For Fnancial Ratio Analysis Powerpoint Template
This business slide displays graphics of four cubes. This PPT slide has been designed to portray concept of financial ratio analysis. Download this PPT slide design to make interactive presentations.

Bar Graph For Year Based Analysis Powerpoint Slides
This PowerPoint template has been designed with year based bar graph. This diagram may be used to display yearly statistical analysis. Use this PPT slide design to make impressive presentations.
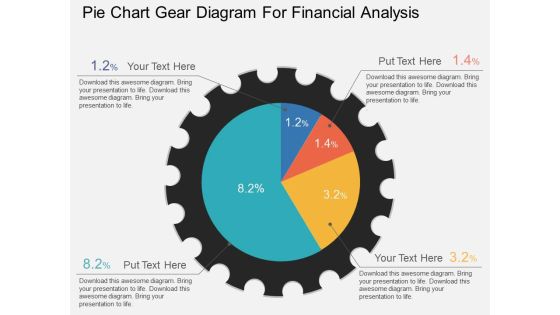
Pie Chart Gear Diagram For Financial Analysis Powerpoint Template
This PowerPoint template has been designed with graphic of pie chart gear diagram. This PPT slide can be used to display financial analysis. Download this PPT diagram slide to make your presentations more effective.

Pie Charts For Financial Ratio Analysis Powerpoint Slides
This PowerPoint template has been designed with diagram of pie charts. This PPT slide can be used to prepare presentations for profit growth report and also for financial data analysis. You can download finance PowerPoint template to prepare awesome presentations.

Business Diagram Colorful Gear For Swot Analysis Presentation Template
This business slide has been designed with graphics of colorful gear divided into four parts. Download this diagram to present SWOT analysis. Cement your ideas in the minds of your listeners with this slide.

Pie Chart On Magnifying Glass For Business Analysis PowerPoint Template
Visually support your presentation with our above template showing pie chart on magnifying glass. This slide has been professionally designed to emphasize the concept of market research and analysis. Deliver amazing presentations to mesmerize your audience.
Circles With Icons For Swot Analysis PowerPoint Template
Visually support your presentation with our above template showing four circles with icons. This slide has been professionally designed to present SWOT analysis. This template offers an excellent background to build impressive presentation.
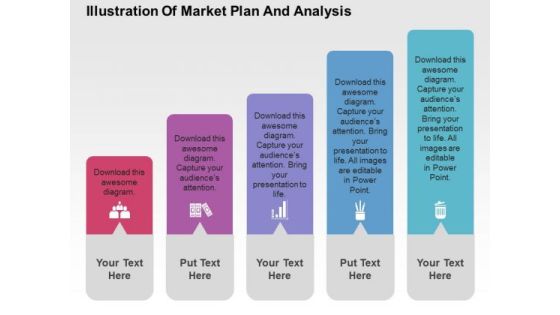
Illustration Of Market Plan And Analysis PowerPoint Templates
The above slide displays five text boxes with icons. This template has been designed to present market plan and analysis. Imprint your concepts with this PPT slide in your presentations.

Fish Bone For Cause And Effect Analysis PowerPoint Templates
This PPT slide has been designed with graphic fish bone diagram. Download this fishbone slide to present cause and effect analysis. Accelerate the impact of your ideas using this image.

Business Meeting For Planning And Analysis Powerpoint Template
Graphic of business meeting has been used to design this power point template diagram. This PPT diagram contains the concept of business planning and analysis. Use this PPT diagram for business and marketing related presentations.
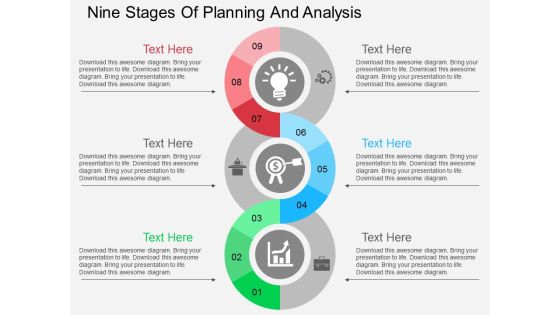
Nine Stages Of Planning And Analysis Powerpoint Templates
Our above business diagram has been designed with spiral info graphic diagram. This slide is suitable to present planning and analysis. Use this business diagram to present your work in a more smart and precise manner.

Alphabet Steps For Financial Strategy Analysis Powerpoint Slides
This PowerPoint template has been designed with alphabet steps with icons. This PPT slide may be used to display financial strategy analysis. Make outstanding business presentation with this template.
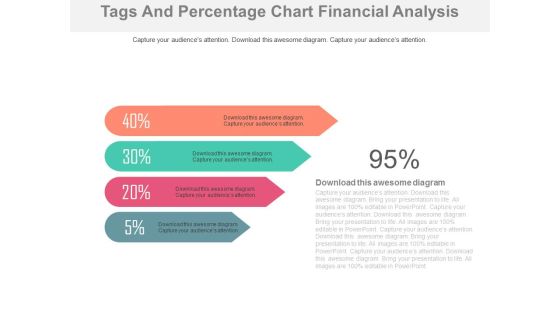
Four Percentage Tags For Financial Analysis Powerpoint Slides
This PowerPoint template contains design of four percentage tags. You may download this PPT slide to display financial analysis. You can easily customize this template to make it more unique as per your need.

Four Text Boxes For Swot Analysis Powerpoint Slides
This PPT slide has been designed with graphics of four steps text boxes diagram. This business diagram helps to exhibit SWOT analysis. Use this PowerPoint template to build an exclusive presentation.

Linear Timeline Steps For Year Based Analysis Powerpoint Slides
This PowerPoint template has been designed with linear timeline steps. This PPT slide may be helpful to display year based business analysis. Download this PowerPoint timeline template to make impressive presentations.

Three Person Tags For Management Analysis Powerpoint Slides
This PowerPoint template has been designed with three persons tags. You may use this slide to display management analysis. Make your mark with this unique slide and create an impression that will endure.

Circle Chart With Percentage Value Analysis Powerpoint Slides
This PowerPoint template has been designed with circular process diagram. This business diagram helps to exhibit financial process control and analysis. Use this diagram to visually support your content.

Four Tags For Financial Review And Analysis Powerpoint Slides
This PowerPoint template has been designed with four tags and financial values. This PowerPoint template helps to exhibit financial review and analysis. Use this diagram slide to build an exclusive presentation.

Four Balls On Scales For Comparison And Analysis Powerpoint Slides
This PowerPoint template has been designed with four balls on scales. You may download this PPT slide to depict comparison and analysis. Add this slide to your presentation and impress your superiors.

Bar Graph For Profit Growth Analysis Powerpoint Slides
This PowerPoint template has been designed with bar graph with percentage values. This diagram is useful to exhibit profit growth analysis. This diagram slide can be used to make impressive presentations.

Bar Graph For Yearly Statistical Analysis Powerpoint Slides
This PowerPoint template has been designed with bar graph. This PowerPoint diagram is useful to exhibit yearly statistical analysis. This diagram slide can be used to make impressive presentations.

World Map With Global Economic Analysis Powerpoint Slides
This PowerPoint template has been designed with graphics of world map. You can download this diagram to exhibit global business analysis. Above PPT slide is suitable for business presentation.

Five Year Tags Analysis Timeline Diagram Powerpoint Slides
This PowerPoint template has been designed with five years tags. This PPT slide may be helpful to display year based business analysis. Download this PowerPoint timeline template to make impressive presentations.
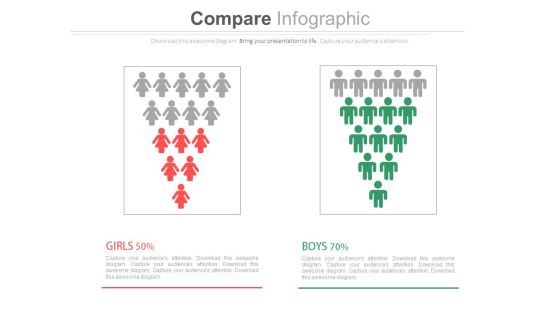
Male Female Gender Ratio Analysis Comparison Chart Powerpoint Slides
This PowerPoint template has been designed with graphics of male and female icons. Download this PPT slide to depict gender ratio analysis. Grab the attention of your team with this eye catching template.

Two Test Tubes For Compare Analysis Powerpoint Slides
This PPT slide contains graphics of two test tubes. Download this PowerPoint template for comparison and analysis. Deliver amazing presentations to mesmerize your audience by using this PPT slide design.

Circular Diagram For Business Deal And Growth Analysis Powerpoint Template
This PowerPoint template has been designed with graphics of circular diagram. You may download this PPT diagram slide to display business deal and growth analysis. Chart the course you intend to take with this slide
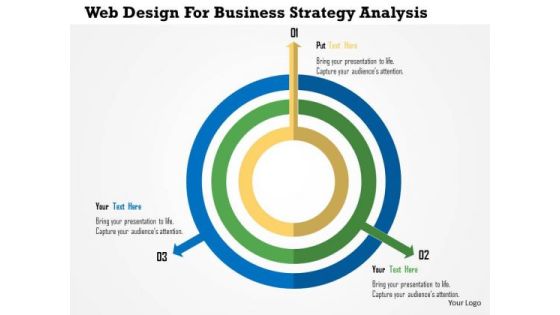
Business Diagram Web Design For Business Strategy Analysis Presentation Template
This business diagram has been designed with concentric circles with three arrows. This slide displays three steps of business process. Download this diagram slide to make professional presentations.
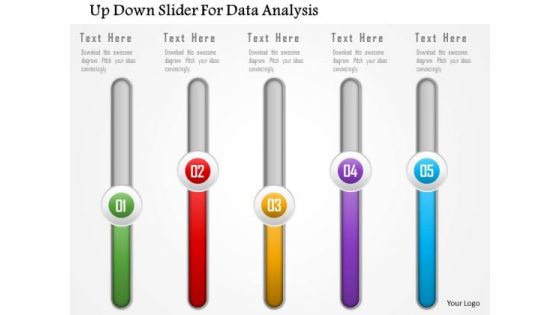
Business Diagram Up Down Slider For Data Analysis Presentation Template
This business diagram has been designed with graphics of slider. You may download this professional slide to display data trends. Transmit your thoughts via this slide.

Finland Map With Economic Data Analysis Powerpoint Slides
This PowerPoint template has been designed with Finland Map and areas highlighted. You may use this slide to display financial strategy analysis. This diagram provides an effective way of displaying information you can edit text, color, shade and style as per you need.
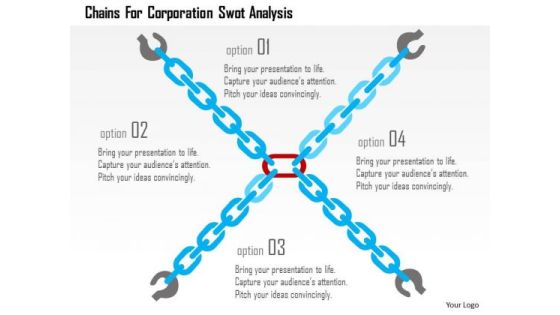
Business Diagram Chains For Corporation Swot Analysis Presentation Template
This image is designed with four interconnected chains graphics. You can use this slide to present SWOT analysis. This diagram provides an effective way of displaying information you can edit text, color, shade and style as per you need. Present your views using this innovative slide and be assured of leaving a lasting impression

Business Target Analysis Timeline With Year Tags Powerpoint Slides
This timeline slide design can be used for project planning and project management. It contains time line diagram with years tags. This timeline template can be used in presentations where you need to display a roadmap or it may be used for business target analysis.

Four Staged Linear Timeline For Growth Analysis Powerpoint Slides
This timeline slide design can be used to display yearly business growth. It contains timeline diagram with four years. This timeline template can be used in presentations where you need to display a roadmap or it may be used for business target analysis.
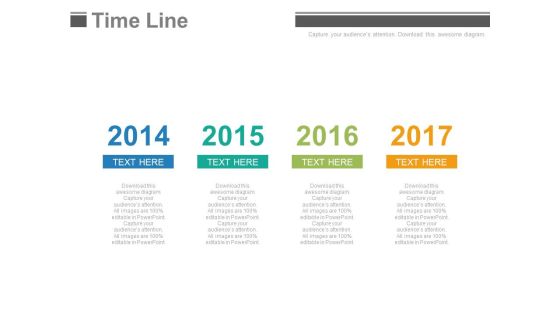
Year Base Timeline For Business Strategy And Analysis Powerpoint Slides
This PowerPoint template has been designed with year based timeline diagram. This timeline template can be used in presentations where you need to display business strategy and analysis. You can modify the template like add new milestones and tasks, or change the colors and shapes.

Year Based Linear Timeline For Sales Analysis Powerpoint Slides
This PowerPoint template has been designed with linear timeline diagram. This timeline template can be used in presentations where you need to display sales planning and analysis. You can modify the template like add new milestones and tasks, or change the colors and shapes.
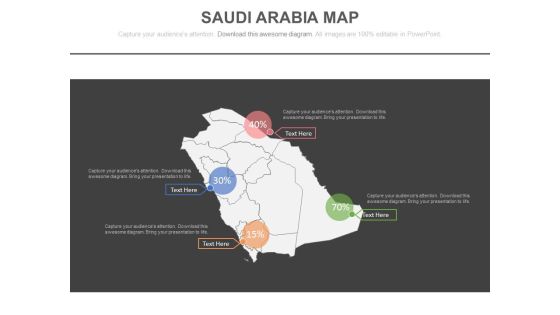
Saudi Arabia Map For Financial Strategy Analysis Powerpoint Slides
This PowerPoint template has been designed with Saudi Arabia Map. You may use this slide to display financial strategy analysis. This diagram provides an effective way of displaying information you can edit text, color, shade and style as per you need.
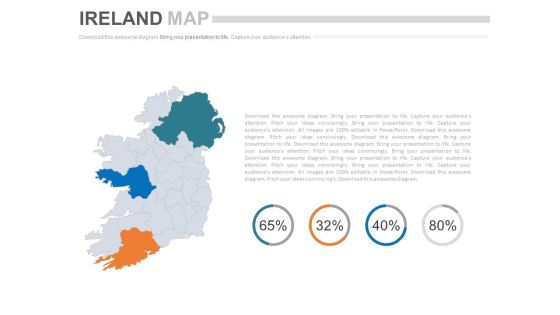
Ireland Map With Financial Ratio Analysis Powerpoint Slides
This PowerPoint template has been designed with Ireland Map and areas highlighted. You may use this slide to display financial strategy analysis. This diagram provides an effective way of displaying information you can edit text, color, shade and style as per you need.

Map Of India With Population Analysis Powerpoint Slides
This PowerPoint template has been designed with graphics of India map. You may use this slide to display population analysis. This diagram provides an effective way of displaying information you can edit text, color, shade and style as per you need.

Three Teams Skill Analysis Comparison Chart Powerpoint Slides
Create visually stunning and define your PPT presentations in a unique and inspiring manner using our above template. It contains graphics of comparison chart. This business slide helps to display teams skill analysis. Deliver amazing presentations to mesmerize your audience by using this PPT slide design.

Bar Graph Of Lego Blocks For Data Analysis Powerpoint Slides
This PowerPoint template contains bar graph made of Lego blocks. You may use this slide to display growth process. This diagram provides an effective way of displaying information you can edit text, color, shade and style as per you need.
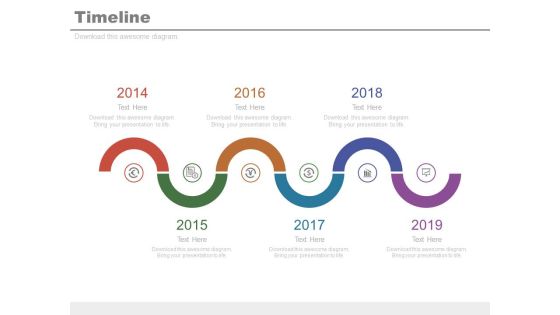
Six Staged Spiral Timeline For Financial Analysis Powerpoint Slides
This infographic template contains graphics of six staged spiral timeline diagram. This PPT slide may be helpful to display financial strategy timeline. Download this PowerPoint timeline template to make impressive presentations.

Product Portfolio Management For New Target Region Product Portfolio Roadmap Sample PDF
Following slide displays product portfolio roadmap that can be used by a firm to plan, schedule and introduce its product portfolio in the new area or region. Here the roadmap includes information about milestones, upcoming products and product family. Deliver and pitch your topic in the best possible manner with this Product Portfolio Management For New Target Region Product Portfolio Roadmap Sample PDF. Use them to share invaluable insights on Product Portfolio Roadmap and impress your audience. This template can be altered and modified as per your expectations. So, grab it now.
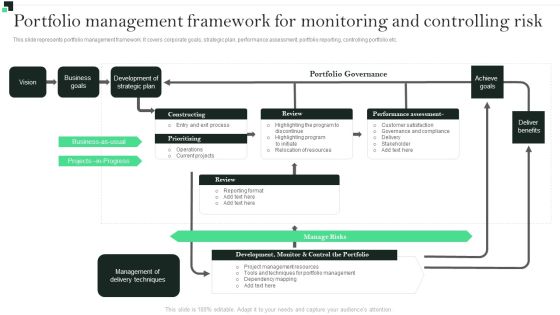
Portfolio Management Framework For Monitoring And Controlling Risk Strategies To Enhance Portfolio Template PDF
This slide represents portfolio management framework. It covers corporate goals, strategic plan, performance assessment, portfolio reporting, controlling portfolio etc.Formulating a presentation can take up a lot of effort and time, so the content and message should always be the primary focus. The visuals of the PowerPoint can enhance the presenters message, so our Portfolio Management Framework For Monitoring And Controlling Risk Strategies To Enhance Portfolio Template PDF was created to help save time. Instead of worrying about the design, the presenter can concentrate on the message while our designers work on creating the ideal templates for whatever situation is needed. Slidegeeks has experts for everything from amazing designs to valuable content, we have put everything into Portfolio Management Framework For Monitoring And Controlling Risk Strategies To Enhance Portfolio Template PDF.

Timeline Design For Year Based Analysis Powerpoint Slides
This PowerPoint diagram consists of timeline tags design representing planning steps. This PowerPoint template may be used to display when events or steps should happen. This timeline design is most useful for showing important milestones and deadlines.

Business Analysis Productivity Measures Ppt Powerpoint Presentation Gallery Background Designs
This is a balance scale with cost and benefits ppt powerpoint presentation show. This is a four stage process. The stages in this process are business, finance, marketing, strategy, compare, management.

Diagram Of Market Research And Analysis Powerpoint Template
Our above PPT slide contains circular web diagram with men icon in center holding megaphone. This business diagram helps to exhibit business strategic model design. Use this diagram to impart more clarity to subject and to create more sound impact on viewers.

Tablet With Charts For Business Analysis Powerpoint Templates
Our compelling template consists with a design of four gear tags and icons. This slide has been professionally designed to exhibit process control. This template offers an excellent background to build impressive presentation.
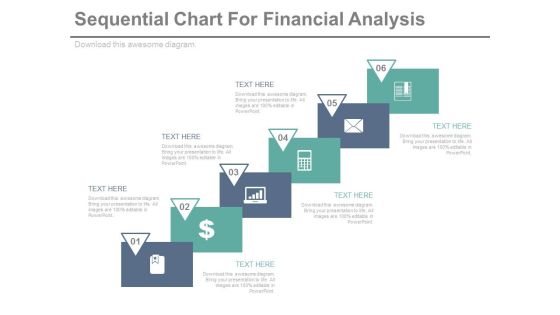
Sequential Steps Chart For Data Analysis Powerpoint Slides
This PowerPoint template has been designed sequential steps chart with icons. This PPT slide can be used to display corporate level financial strategy. You can download finance PowerPoint template to prepare awesome presentations.
Progressive Arrows With Icons For Growth Analysis Powerpoint Slides
This PowerPoint template has been designed with diagram of progressive arrows with icons. The PowerPoint template has a high quality design. You can download this PowerPoint slide for corporate presentations or annual meeting and business plans.

Six Tags For Business Agenda Analysis Powerpoint Slides
This PowerPoint template has been designed with six tags. Download this PPT slide to structure your meeting planning, preparation and execution. Deliver amazing presentations to mesmerize your audience by using this agenda slide design.
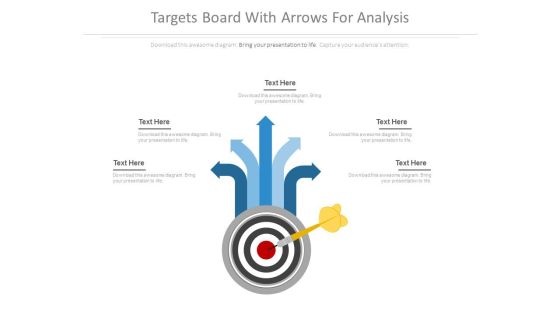
Targets Board With Arrows For Analysis Powerpoint Slides
This PowerPoint template has been designed with target diagram with arrows. Download this slide design for target management development processes. Enlighten others on the process with this innovative PowerPoint template.

Tablet For Finance Planning And Analysis PowerPoint Template
Our professionally designed business diagram is as an effective tool for communicating ideas and planning. It contains graphics of tablet with various symbols. Convey your views with this diagram slide. It will amplify the strength of your logic.
 Home
Home