Porters 5 Forces

Industrial Engineering Project Outline With Execution Timeline Ppt Ideas Design Templates PDF
This slide shows integrated approach to implementing industrial engineering program. It covers key risk and issues faced by management while conducting program. Deliver an awe inspiring pitch with this creative industrial engineering project outline with execution timeline ppt ideas design templates pdf bundle. Topics like cost analysis and control, performance standard development, team member can be discussed with this completely editable template. It is available for immediate download depending on the needs and requirements of the user.

Future Of Big Data Analytics Arrow Diagram Ppt PowerPoint Presentation Summary
This is a future of big data analytics arrow diagram ppt powerpoint presentation summary. This is a four stage process. The stages in this process are big data, process, business, marketing, icons.
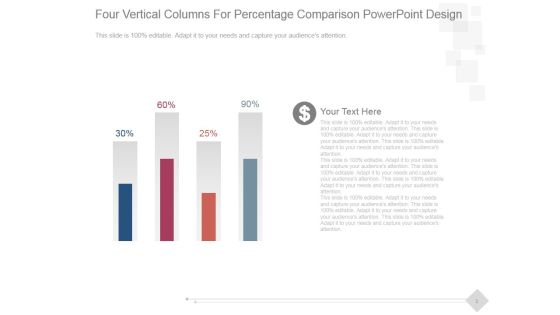
Four Vertical Columns For Percentage Comparison Ppt PowerPoint Presentation Introduction
This is a four vertical columns for percentage comparison ppt powerpoint presentation introduction. This is a four stage process. The stages in this process are business, marketing, success, management, presentation.
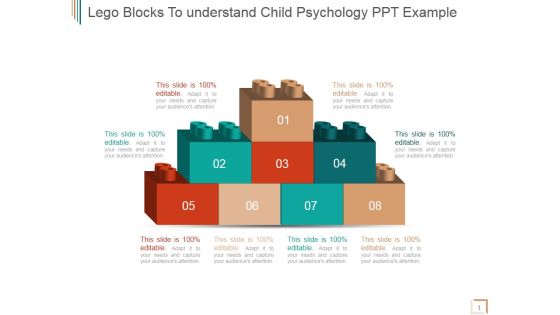
Lego Blocks To Understand Child Psychology Ppt PowerPoint Presentation Ideas
This is a lego blocks to understand child psychology ppt powerpoint presentation ideas. This is a eight stage process. The stages in this process are lego, blocks, game, strategy, management, marketing.
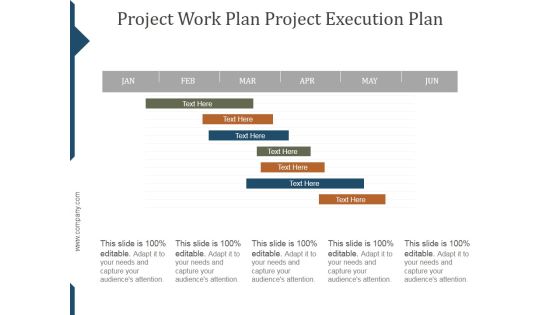
Project Work Plan Project Execution Plan Template Ppt PowerPoint Presentation Styles
This is a project work plan project execution plan template ppt powerpoint presentation styles. This is a seven stage process. The stages in this process are project, management, business, marketing, success.

Key Performance Indicators Template 2 Ppt PowerPoint Presentation Microsoft
This is a key performance indicators template 2 ppt powerpoint presentation microsoft. This is a four stage process. The stages in this process are business, table, marketing, strategy, data.

Product Roadmap Product Launch Deliverables Slide Ppt PowerPoint Presentation Background Images
This is a product roadmap product launch deliverables slide ppt powerpoint presentation background images. This is a ten stage process. The stages in this process are business, table, marketing, strategy, data.
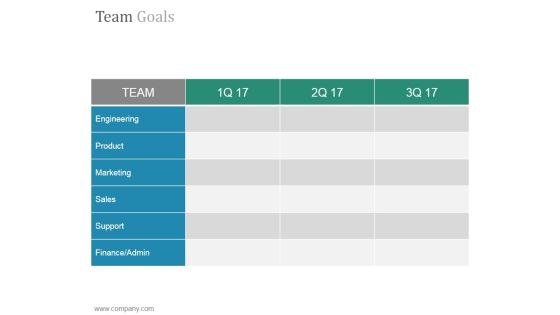
Team Goals Slide Ppt PowerPoint Presentation Tips
This is a team goals slide ppt powerpoint presentation tips. This is a six stage process. The stages in this process are engineering, product, marketing, sales, support, finance admin.
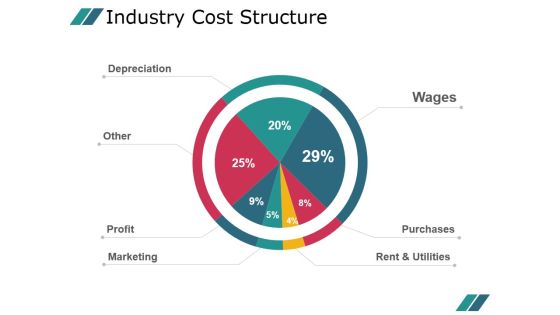
Industry Cost Structure Template 1 Ppt PowerPoint Presentation Example 2015
This is a industry cost structure template 1 ppt powerpoint presentation example 2015. This is a seven stage process. The stages in this process are wages, purchases, rent and utilities, depreciation, other, profit, marketing.
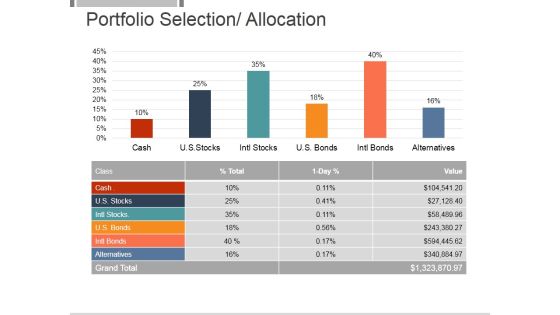
Portfolio Selection Allocation Template 1 Ppt PowerPoint Presentation Themes
This is a portfolio selection allocation template 1 ppt powerpoint presentation themes. This is a six stage process. The stages in this process are financial, business, strategy, management, marketing.

X Bar And R Chart Ppt PowerPoint Presentation Background Designs
This is a x bar and r chart ppt powerpoint presentation background designs. This is a two stage process. The stages in this process are chart, business, marketing, strategy, success.

Magnifying Glass Ppt PowerPoint Presentation Ideas
This is a magnifying glass ppt powerpoint presentation ideas. This is a one stage process. The stages in this process are choose a right person for leadership, business, big data, marketing, technology.

combo chart template 2 ppt powerpoint presentation background images
This is a combo chart template 2 ppt powerpoint presentation background images. This is a four stage process. The stages in this process are business, marketing, finance, timeline, product.

Crm Dashboard Current Lead Status Ppt PowerPoint Presentation Guide
This is a crm dashboard current lead status ppt powerpoint presentation guide. This is a six stage process. The stages in this process are business, marketing, success, presentation, financial.

Crm Dashboard Top Customers Ppt PowerPoint Presentation Graphics
This is a crm dashboard top customers ppt powerpoint presentation graphics. This is a ten stage process. The stages in this process are top customers, business, marketing, process, management.
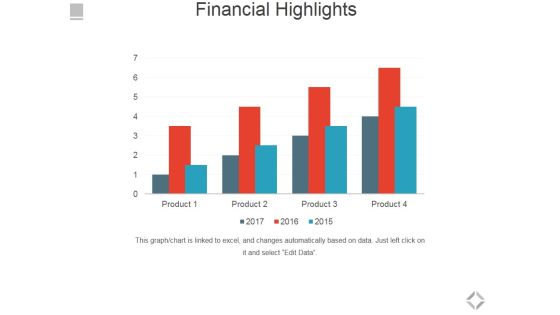
Financial Highlights Template 2 Ppt PowerPoint Presentation Outline Background Image
This is a financial highlights template 2 ppt powerpoint presentation outline background image. This is a four stage process. The stages in this process are financial highlights, business, marketing, success, management.

Midstream Organic Growth Ppt PowerPoint Presentation Ideas Graphics Tutorials
This is a midstream organic growth ppt powerpoint presentation ideas graphics tutorials. This is a three stage process. The stages in this process are business, marketing, bar graph, management, financials.
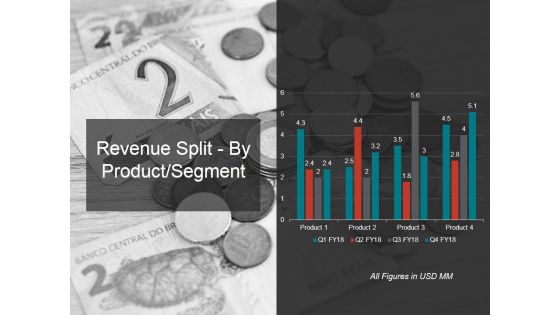
Revenue Split By Product Segment Template 1 Ppt PowerPoint Presentation Infographics Example
This is a revenue split by product segment template 1 ppt powerpoint presentation infographics example. This is a four stage process. The stages in this process are revenue, segment, business, marketing, success.

Bar Graph Ppt PowerPoint Presentation Gallery Skills
This is a bar graph ppt powerpoint presentation gallery skills. This is a four stage process. The stages in this process are in percentage, bar graph, business, marketing, product.

Crm Dashboard Current Lead Status Ppt PowerPoint Presentation Show Slide Portrait
This is a crm dashboard current lead status ppt powerpoint presentation show slide portrait. This is a six stage process. The stages in this process are crm dashboard, current lead status, business, marketing.
Funding Updates Debt Ppt PowerPoint Presentation Icon Background Designs
This is a funding updates debt ppt powerpoint presentation icon background designs. This is a two stage process. The stages in this process are debt, updates, business, marketing, compare, management.

Area Chart Ppt PowerPoint Presentation Slides Deck
This is a area chart ppt powerpoint presentation slides deck. This is a two stage process. The stages in this process are financial, sales in percentage, business, marketing, management.

Clustered Bar Ppt PowerPoint Presentation Summary Design Inspiration
This is a clustered bar ppt powerpoint presentation summary design inspiration. This is a two stage process. The stages in this process are product, clustered bar, profit, business, marketing.
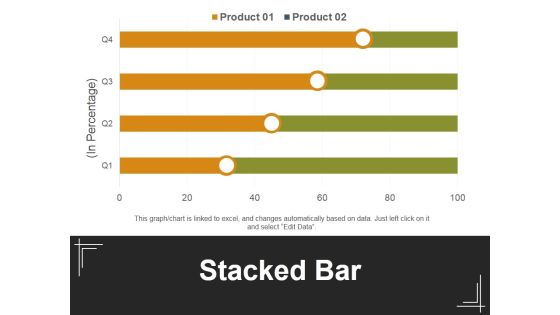
Stacked Bar Template 1 Ppt PowerPoint Presentation Inspiration Background Designs
This is a stacked bar template 1 ppt powerpoint presentation inspiration background designs. This is a four stage process. The stages in this process are in percentage, stacked bar, product, business, marketing.
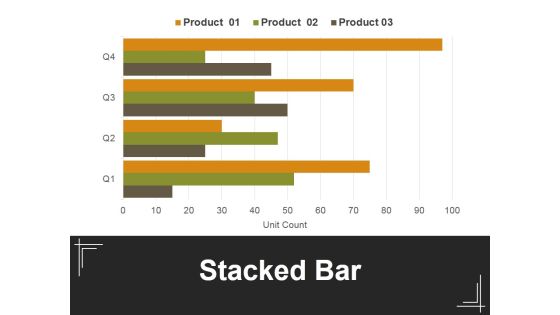
Stacked Bar Template 2 Ppt PowerPoint Presentation Professional Example
This is a stacked bar template 2 ppt powerpoint presentation professional example. This is a four stage process. The stages in this process are in percentage, stacked bar, product, business, marketing.

Stacked Line With Marker Ppt PowerPoint Presentation Ideas Themes
This is a stacked line with marker ppt powerpoint presentation ideas themes. This is a two stage process. The stages in this process are profit, stacked bar, product, business, marketing.
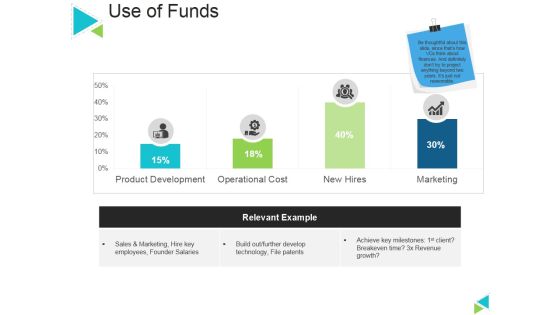
Use Of Funds Ppt PowerPoint Presentation Layouts Graphics Template
This is a use of funds ppt powerpoint presentation layouts graphics template. This is a four stage process. The stages in this process are relevant example, marketing, business, product development, new hires.

Bar Graph Ppt PowerPoint Presentation Professional Guide
This is a bar graph ppt powerpoint presentation professional guide. This is a eight stage process. The stages in this process are axis title, bar graph, business, marketing, management.
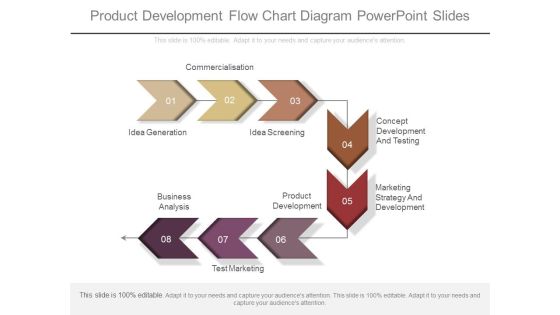
Product Development Flow Chart Diagram Powerpoint Slides
This is a product development flow chart diagram powerpoint slides. This is a eight stage process. The stages in this process are concept development and testing, marketing strategy and development, test marketing, business analysis, product development, idea screening, idea generation, commercialisation.

Stages Of Investment Process Sample Diagram Ppt Presentation
This is a stages of investment process sample diagram ppt presentation. This is a ten stage process. The stages in this process are investment process, portfolio construction, valuation, analysis, investment policy, portfolio evaluation, intrinsic value, market, investible fund, diversification, appraisal, intrinsic value, market, investible fund, diversification, appraisal.

New Product Launch Sales Strategy Ppt Sample
This is a new product launch sales strategy ppt sample. This is a two stage process. The stages in this process are idea generation, idea screening, concept development and testing, marketing strategy and development, commercialization, test marketing, product development, business analysis.

Young Business People Pie Chart Marketing PowerPoint Templates Ppt Backgrounds For Slides
We present our young business people pie chart marketing PowerPoint templates PPT backgrounds for slides.Download our Business PowerPoint Templates because These PowerPoint Templates and Slides will give the updraft to your ideas. See them soar to great heights with ease. Present our Finance PowerPoint Templates because you can Set pulses racing with our PowerPoint Templates and Slides. They will raise the expectations of your team. Download and present our Marketing PowerPoint Templates because Your ideas provide food for thought. Our PowerPoint Templates and Slides will help you create a dish to tickle the most discerning palate. Use our People PowerPoint Templates because They will Put the wind in your sails. Skim smoothly over the choppy waters of the market. Download and present our Success PowerPoint Templates because Our PowerPoint Templates and Slides will embellish your thoughts. See them provide the desired motivation to your team.Use these PowerPoint slides for presentations relating to 3d, analysis, boardroom, business, cartoon, character, chart, clipart, committee, company, concept, corporate, council, directors, display, document, economics, executive, figure, finance, financial, group, growth, guy, human, management, market, meeting, performance, presentation, report, table, team. The prominent colors used in the PowerPoint template are Black, White, Gray. The feedback we get is that our young business people pie chart marketing PowerPoint templates PPT backgrounds for slides are designed by a team of presentation professionals. Professionals tell us our committee PowerPoint templates and PPT Slides help you meet deadlines which are an element of today's workplace. Just browse and pick the slides that appeal to your intuitive senses. PowerPoint presentation experts tell us our young business people pie chart marketing PowerPoint templates PPT backgrounds for slides are visually appealing. People tell us our character PowerPoint templates and PPT Slides are readymade to fit into any presentation structure. Presenters tell us our young business people pie chart marketing PowerPoint templates PPT backgrounds for slides will make the presenter successul in his career/life. Professionals tell us our chart PowerPoint templates and PPT Slides are effectively colour coded to prioritise your plans They automatically highlight the sequence of events you desire.

Case Competition Petroleum Sector Issues Case Study Of Downstream Oil And Gas Industry Research Microsoft PDF
The slide provides a case study of oil and gas company that is seeking to expand its operations in new geographies. The case includes the challenge major point of concern, the process research, study, analyses etc. to solve the issue, and the result outcome of the process. This is a case competition petroleum sector issues case study of downstream oil and gas industry research microsoft pdf template with various stages. Focus and dispense information on three stages using this creative set, that comes with editable features. It contains large content boxes to add your information on topics like target growth segment, evaluate market size, analysis and key recommendations, supply chain analysis and business model. You can also showcase facts, figures, and other relevant content using this PPT layout. Grab it now.

Common Revenue Projection Models For Business Owners Ppt PowerPoint Presentation File Slides PDF
The following slide showcases different sales projection methods which can assist executives in predicting company sales. The methods outlined in the slide are historical forecasting, multivariable analysis, test market analysis, and length of sales cycle forecasting. Here you can discover an assortment of the finest PowerPoint and Google Slides templates. With these templates, you can create presentations for a variety of purposes while simultaneously providing your audience with an eye catching visual experience. Download Common Revenue Projection Models For Business Owners Ppt PowerPoint Presentation File Slides PDF to deliver an impeccable presentation. These templates will make your job of preparing presentations much quicker, yet still, maintain a high level of quality. Slidegeeks has experienced researchers who prepare these templates and write high quality content for you. Later on, you can personalize the content by editing the Common Revenue Projection Models For Business Owners Ppt PowerPoint Presentation File Slides PDF.
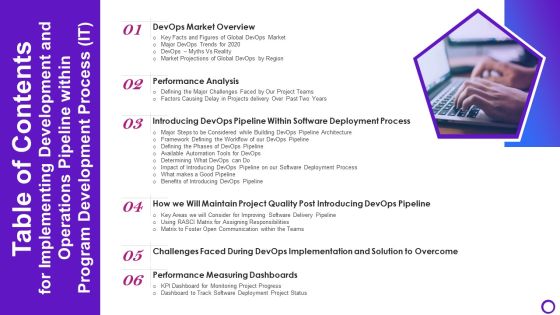
Table Of Contents For Implementing Development And Operations Pipeline Within Program Development Process IT Inspiration PDF
This is a table of contents for implementing development and operations pipeline within program development process it inspiration pdf template with various stages. Focus and dispense information on six stages using this creative set, that comes with editable features. It contains large content boxes to add your information on topics like devops market overview, performance analysis, introducing devops pipeline You can also showcase facts, figures, and other relevant content using this PPT layout. Grab it now.

Business Diagram With Dollars Money PowerPoint Templates And PowerPoint Themes 1012
Visually support your Microsoft office PPT Presentation with our above template illustrating a business diagram on stack of dollars. This image represents the concept of financial analysis. This image has been conceived to enable you to emphatically communicate your ideas in your Business PPT presentations on finance, market, investment and success. Create captivating presentations to deliver comparative and weighted arguments.

Business Framework Decision Matrix PowerPoint Presentation
This image slide displays decision matrix business framework. Use this image slide to express views on marketing research and analysis. You may change color size and orientation of any icon to your liking. This image slide will impart professional appearance to your presentations.
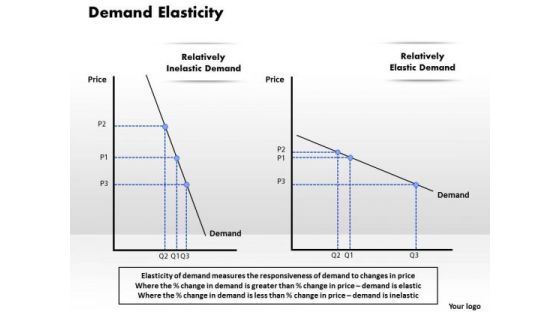
Business Framework Demand Elasticity PowerPoint Presentation
This image slide displays demand elasticity business framework. Use this image slide to express views on marketing mix analysis. You may change color size and orientation of any icon to your liking. This image slide will impart professional appearance to your presentations.

Business Framework Demand Generation PowerPoint Presentation
This image slide displays demand generation business framework. Use this image slide to express views on marketing research and analysis. You may change color size and orientation of any icon to your liking. This image slide will impart professional appearance to your presentations.
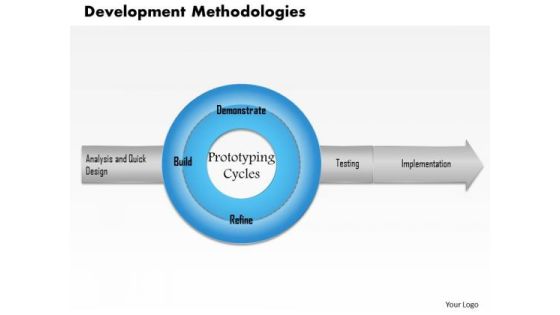
Business Framework Development Methodologies PowerPoint Presentation
This image slide displays business framework for development methodologies. This image slide may be used in your presentations to express views on business, marketing, research and analysis. You may change color, size and orientation of any icon to your liking. Create professional presentations using this image slide.

Business Framework Diminishing Marginal Returns PowerPoint Presentation
This image slide displays business framework for diminishing marginal returns. This image slide may be used in your presentations to depict business planning and market analysis. You may change color, size and orientation of any icon to your liking. Create wonderful presentations using this image slide.
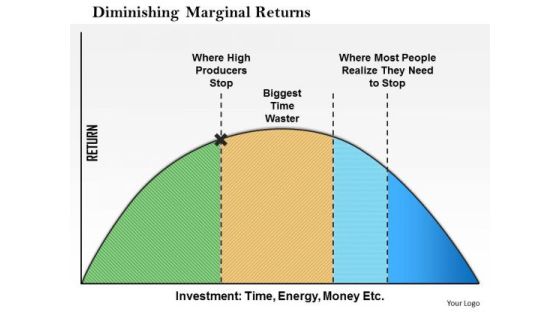
Business Framework Diminishing Marginal Returns PowerPoint Presentation 1
This image slide displays business framework for diminishing marginal returns. This image slide may be used in your presentations to depict business planning and market analysis. You may change color, size and orientation of any icon to your liking. Create wonderful presentations using this image slide.
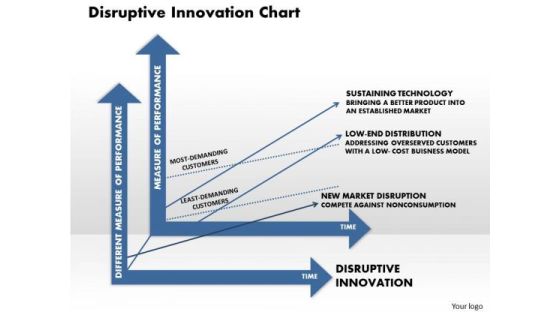
Business Framework Disruptive Innovation Chart PowerPoint Presentation
This image slide displays business framework for diminishing marginal returns. This image slide may be used in your presentations to depict analysis in marketing and business. You may change color, size and orientation of any icon to your liking. Create wonderful presentations using this image slide.
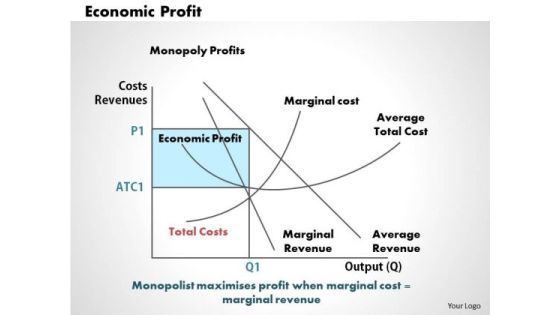
Business Framework Economic Profit PowerPoint Presentation
This image slide displays business framework for economic profit. This image slide may be used in your presentations to depict analysis in marketing profits and accounting business management. You may change color, size and orientation of any icon to your liking. Create wonderful presentations using this image slide.

Business Framework Efficiency Ratio PowerPoint Presentation
This image slide has been designed to depict efficiency ratio. This image slide displays formulas to calculate asset turnover ratio and NWC ratio. This image slide may be used to exhibit business marketing analysis in your presentations. This image slide will give edge to your presentations.
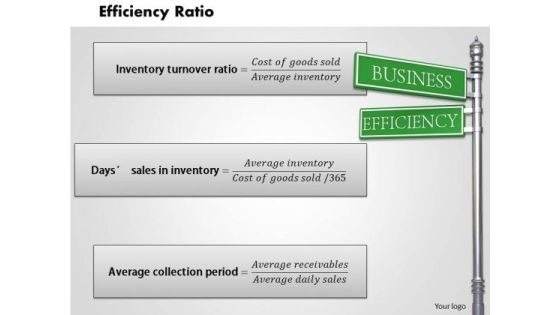
Business Framework Efficiency Ratio PowerPoint Presentation 1
This image slide has been designed to depict efficiency ratio. This image slide displays formulas to calculate average collection period, days sales in inventory, inventory turnover ratio. This image slide may be used to exhibit business marketing analysis in your presentations. This image slide will give edge to your presentations.
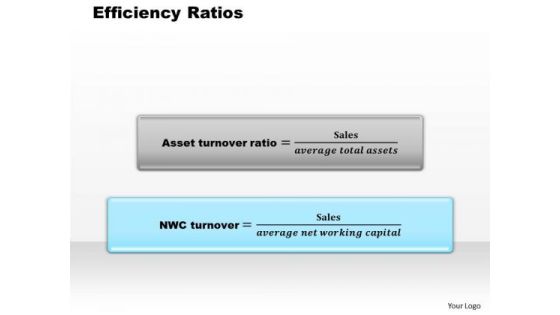
Business Framework Efficiency Ratios PowerPoint Presentation
This image slide has been designed to depict efficiency ratio. This image slide displays formulas to calculate asset turnover ratio and NWC ratio. This image slide may be used to exhibit business marketing analysis in your presentations. This image slide will give edge to your presentations.
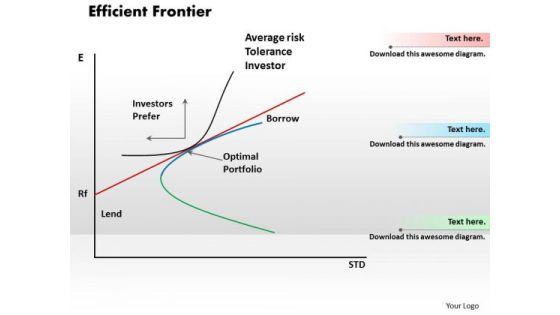
Business Framework Efficient Frontier PowerPoint Presentation
This image slide has been designed to depict efficient frontier diagram. This image slide display graph to show expected level of return for its level of risk. This image slide may be used to exhibit business marketing analysis in your presentations. This image slide will give edge to your presentations.
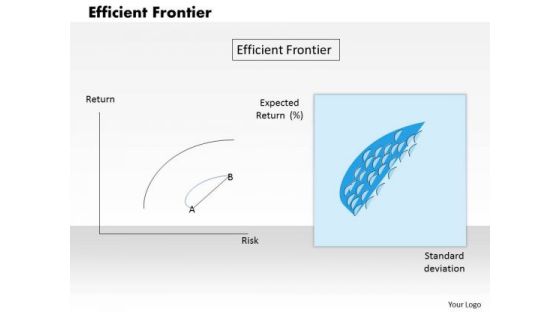
Business Framework Efficient Frontier PowerPoint Presentation 1
This image slide has been designed to depict efficiency ratio. This image slide displays formulas to calculate asset ratio and NWC ratio. This image slide may be used to exhibit business marketing analysis in your presentations. This image slide will give edge to your presentations.
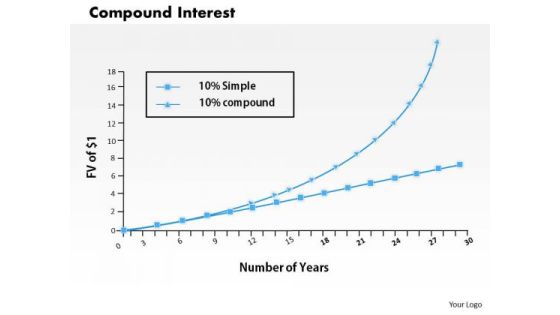
Business Framework Compound Interest PowerPoint Presentation
This business framework template displays compound interest graph. This image slide has been crafted to depict financial ratio analysis. Use this image slide, in your presentations to express views on business and marketing management. This image slide will enhance the quality of your presentations.
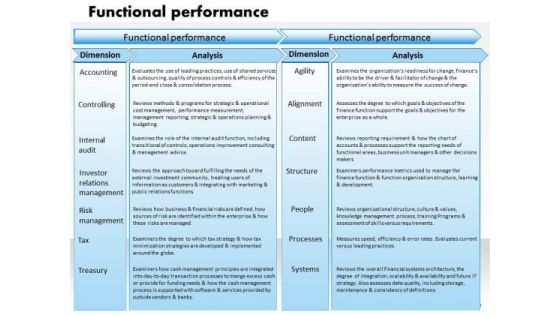
Business Framework Functional Performance PowerPoint Presentation
This image slide has been designed to displays functional performance diagram. This image slide has been designed with textboxes horizontal process diagram with functional performance, dimensions and analysis attributes. Use this image slide in business and marketing presentations to depict accounting, risk management, tax and various dimensions of business. This image slide will enhance the quality of your presentations.

Business Management And Administration Ppt Presentation Slides
This is a business management and administration ppt presentation slides. This is a seven stage process. The stages in this process are business management and administration, administrative and information support, business analysis, business financial mgmt and accounting, human resources, management, marketing.

Example Of B2b Brand Auditing Ppt Presentation
This is a example of b2b brand auditing ppt presentation. This is a six stage process. The stages in this process are b2b brand auditing, brand audit, objective of audit, internal description, ext data research, analysis, findings and report, brand score card, b2b service marketing characteristics, intangibility, variability, inseparability, perishability, brand score card.

Global Business Factors Presentation Slides
This is a global business factors presentation slides. This is a seven stage process. The stages in this process are ways to export, industry analysis, company assessment, marketing issues, legal and political situation, currency exchange, sources of financing, decision to go global.
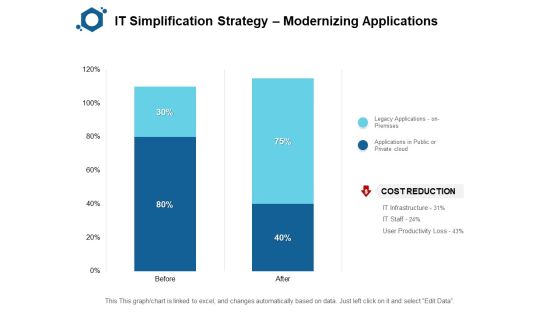
IT Simplification Strategy Modernizing Applications Ppt PowerPoint Presentation Layouts Aids
Presenting this set of slides with name it simplification strategy modernizing applications ppt powerpoint presentation layouts aids. The topics discussed in these slides are finance, marketing, management, investment, analysis. This is a completely editable PowerPoint presentation and is available for immediate download. Download now and impress your audience.

Workforce Diversity By Age Group Ppt PowerPoint Presentation Infographics Slides
This is a workforce diversity by age group ppt powerpoint presentation infographics slides. This is a three stage process. The stages in this process are finance, analysis, success, strategy, business, marketing.
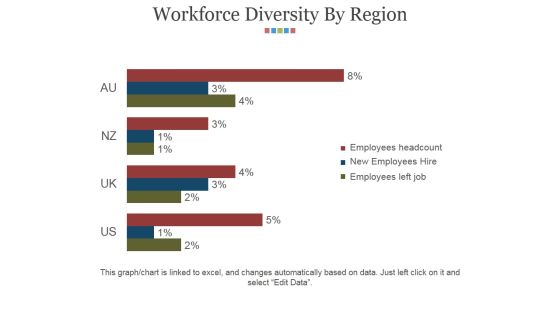
Workforce Diversity By Region Ppt PowerPoint Presentation Infographics Grid
This is a workforce diversity by region ppt powerpoint presentation infographics grid. This is a four stage process. The stages in this process are finance, analysis, success, strategy, business, marketing.
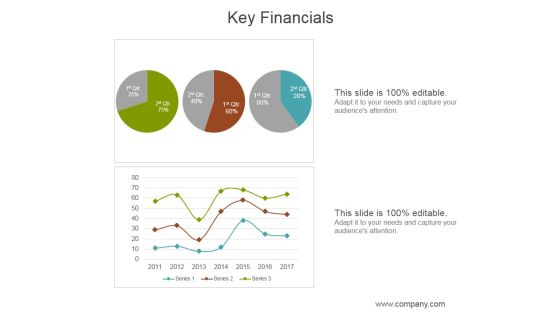
Key Financials Ppt PowerPoint Presentation Ideas
This is a key financials ppt powerpoint presentation ideas. This is a three stage process. The stages in this process are business, marketing, planning, financials, management.
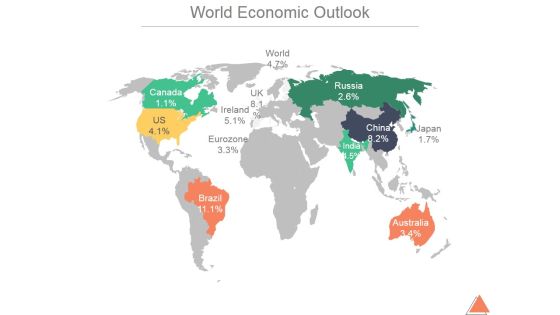
World Economic Outlook Ppt PowerPoint Presentation Background Image
This is a world economic outlook ppt powerpoint presentation background image. This is a twelve stage process. The stages in this process are business, marketing, management, location, outlook.
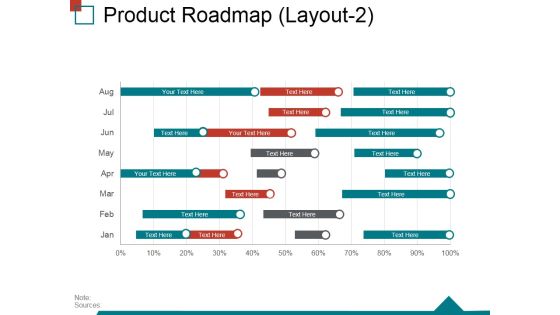
Product Roadmap Layout2 Ppt PowerPoint Presentation Gallery Template
This is a product roadmap layout2 ppt powerpoint presentation gallery template. This is a nine stage process. The stages in this process are product roadmap, business, marketing, management.

 Home
Home