Pollution

Area Chart Ppt PowerPoint Presentation Summary Example Introduction
This is a area chart ppt powerpoint presentation summary example introduction. This is a two stage process. The stages in this process are product, sales in percentage, percentage, area chart, business.

Column Chart Ppt PowerPoint Presentation Model Graphics Download
This is a column chart ppt powerpoint presentation model graphics download. This is a two stage process. The stages in this process are product, financial year, sales in percentage, bar graph, success.
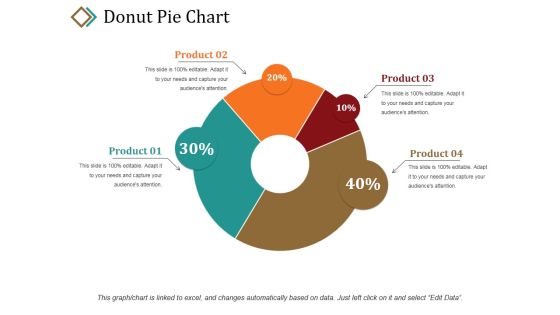
Donut Pie Chart Ppt PowerPoint Presentation Portfolio Graphic Tips
This is a donut pie chart ppt powerpoint presentation portfolio graphic tips. This is a four stage process. The stages in this process are product, percentage, business, marketing, donut.

Line Chart Ppt PowerPoint Presentation Layouts Example
This is a line chart ppt powerpoint presentation layouts example. This is a two stage process. The stages in this process are sales in percentage, product, financial years, growth, success.
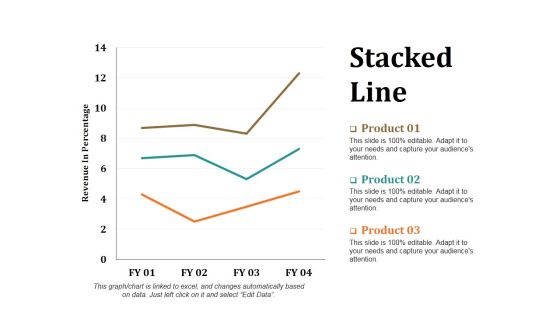
Stacked Line Ppt PowerPoint Presentation Layouts Portrait
This is a stacked line ppt powerpoint presentation layouts portrait. This is a three stage process. The stages in this process are revenue in percentage, stacked line, product, growth, success.
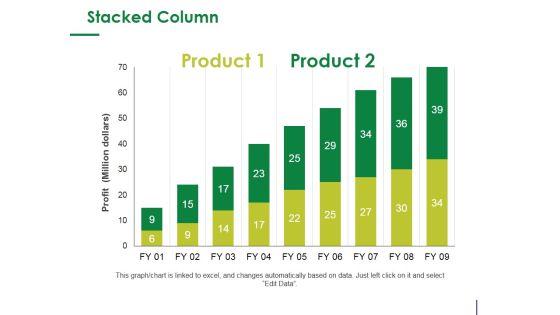
Stacked Column Ppt PowerPoint Presentation Infographic Template Design Ideas
This is a stacked column ppt powerpoint presentation infographic template design ideas. This is a two stage process. The stages in this process are product, profit, bar graph, growth, success.

Clustered Column Line Ppt PowerPoint Presentation Summary Background Image
This is a clustered column line ppt powerpoint presentation summary background image. This is a four stage process. The stages in this process are in percentage, product, graph, growth, success.

Clustered Column Ppt PowerPoint Presentation File Graphics
This is a clustered column ppt powerpoint presentation file graphics. This is a two stage process. The stages in this process are product, financial year, sales in percentage, graph, growth.
Donut Pie Chart Ppt PowerPoint Presentation Icon Background Designs
This is a donut pie chart ppt powerpoint presentation icon background designs. This is a four stage process. The stages in this process are product, percentage, finance, donut, business.

Our Team Template 2 Ppt PowerPoint Presentation Infographics Layouts
This is a our team template 2 ppt powerpoint presentation infographics layouts. This is a six stage process. The stages in this process are ceo, web designer, product manager, editing, marketing.

Radar Chart Ppt PowerPoint Presentation Infographic Template Microsoft
This is a radar chart ppt powerpoint presentation infographic template microsoft. This is a three stage process. The stages in this process are product, radar chart, shapes, business, marketing.

Column Chart Ppt PowerPoint Presentation Model Clipart Images
This is a column chart ppt powerpoint presentation model clipart images. This is a two stage process. The stages in this process are product, bar graph, growth, success, business.

Line Chart Ppt PowerPoint Presentation File Example File
This is a line chart ppt powerpoint presentation file example file. This is a two stage process. The stages in this process are product, in percentage, in years, growth, success.
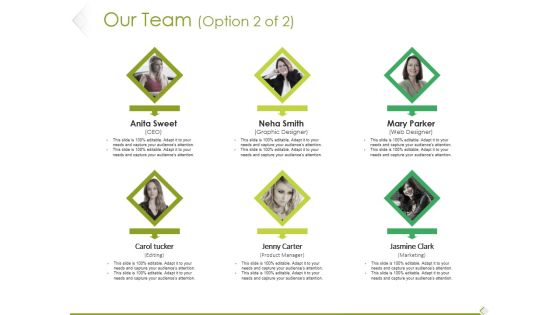
Our Team Template 2 Ppt PowerPoint Presentation Layouts Objects
This is a our team template 2 ppt powerpoint presentation layouts objects. This is a six stage process. The stages in this process are ceo, graphic designer, web designer, editing, product manager.

Combo Chart Ppt PowerPoint Presentation Inspiration Background
This is a combo chart ppt powerpoint presentation inspiration background. This is a three stage process. The stages in this process are product, bar graph, market size, growth, growth rate.
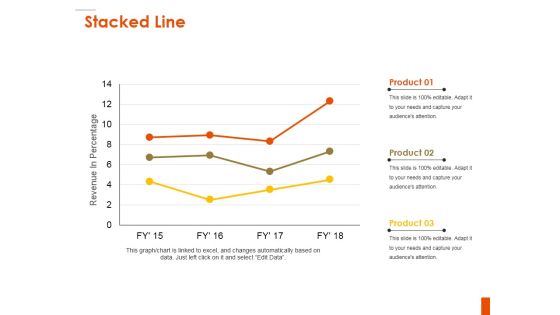
Stacked Line Ppt PowerPoint Presentation Outline Inspiration
This is a stacked line ppt powerpoint presentation outline inspiration. This is a three stage process. The stages in this process are revenue in percentage, product, growth, business, success.

Area Chart Ppt PowerPoint Presentation Ideas Icon
This is a area chart ppt powerpoint presentation ideas icon. This is a two stage process. The stages in this process are product, area chart, sales in percentage, growth, success.

Column Chart Ppt PowerPoint Presentation Infographics Deck
This is a column chart ppt powerpoint presentation infographics deck. This is a two stage process. The stages in this process are product, expenditure in, years, bar graph, growth.

Meet Our Team Ppt PowerPoint Presentation Portfolio Infographic Template
This is a meet our team ppt powerpoint presentation portfolio infographic template. This is a three stage process. The stages in this process are ceo and founder, finance manager, product manager, teamwork, communication.

Volume High Low Close Chart Ppt PowerPoint Presentation Infographics Good
This is a volume high low close chart ppt powerpoint presentation infographics good. This is a two stage process. The stages in this process are high, volume, low, product, close.

Line Chart Ppt PowerPoint Presentation Summary Graphic Tips
This is a line chart ppt powerpoint presentation summary graphic tips. This is a two stage process. The stages in this process are line chart, product, in percentage, analysis, business.

Our Team Ppt PowerPoint Presentation Show Microsoft
This is a our team ppt powerpoint presentation show microsoft. This is a six stage process. The stages in this process are ceo, graphic designer, web designer, editing, product manager, marketing.
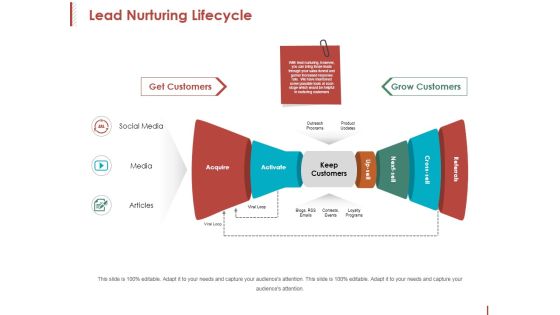
Lead Nurturing Lifecycle Ppt PowerPoint Presentation Professional Templates
This is a lead nurturing lifecycle ppt powerpoint presentation professional templates. This is a seven stage process. The stages in this process are acquire, activate, keep customers, outreach programs, product updates.
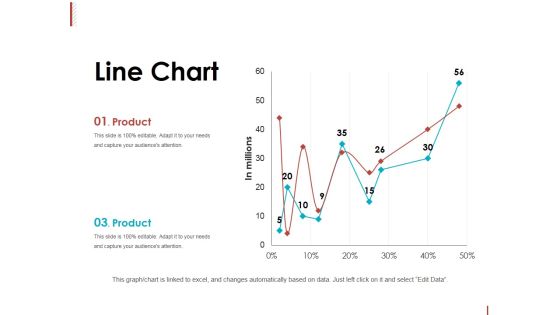
Line Chart Ppt PowerPoint Presentation Slides Graphics Tutorials
This is a line chart ppt powerpoint presentation slides graphics tutorials. This is a two stage process. The stages in this process are product, in millions, line chart, percentage, finance.

Marketing Growth Strategy Ppt PowerPoint Presentation File Ideas
This is a marketing growth strategy ppt powerpoint presentation file ideas. This is a three stage process. The stages in this process are marketing and sales, acquiring customers, customer service, keeping customers, product development.

ansoff matrix for growth strategy ppt powerpoint presentation model demonstration
This is a ansoff matrix for growth strategy ppt powerpoint presentation model demonstration. This is a four stage process. The stages in this process are market penetration, market development , diversification, product development, existing.
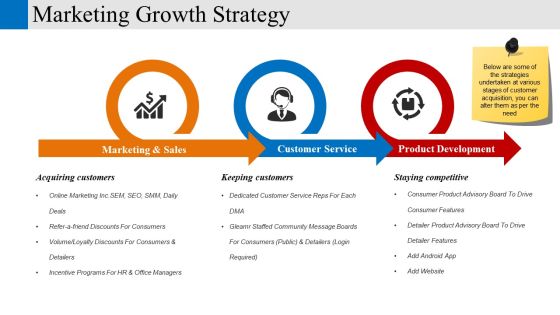
Marketing Growth Strategy Ppt PowerPoint Presentation Styles Display
This is a marketing growth strategy ppt powerpoint presentation styles display. This is a three stage process. The stages in this process are marketing and sales, customer service, product development, business, icons.

Ansoff Matrix For Growth Strategy Ppt PowerPoint Presentation Portfolio Layouts
This is a handoff matrix for growth strategy ppt powerpoint presentation portfolio layouts. This is a four stage process. The stages in this process are market penetration, market development , product development, diversification, business.

Lead Nurturing Lifecycle Ppt PowerPoint Presentation Infographics Designs
This is a lead nurturing lifecycle ppt powerpoint presentation infographics designs. This is a two stage process. The stages in this process are social media, media, articles, outreach programs, product updates.
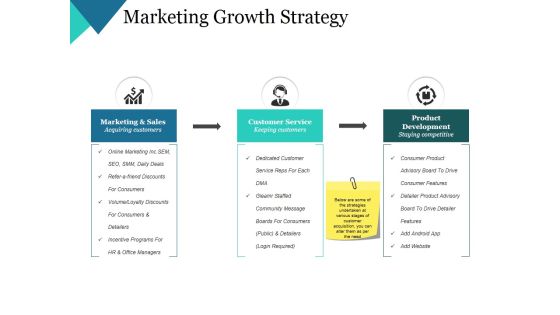
Marketing Growth Strategy Ppt PowerPoint Presentation Model Layout Ideas
This is a marketing growth strategy ppt powerpoint presentation model layout ideas. This is a three stage process. The stages in this process are marketing and sales, customer service, product development, business, icons.

Clustered Column Line Ppt PowerPoint Presentation Icon Good
This is a clustered column line ppt powerpoint presentation icon good. This is a three stage process. The stages in this process are product, financial year, bar graph, business, growth.

Combo Chart Ppt PowerPoint Presentation Slides Show
This is a combo chart ppt powerpoint presentation slides show. This is a three stage process. The stages in this process are combo chart, market size, product, bar graph, growth.
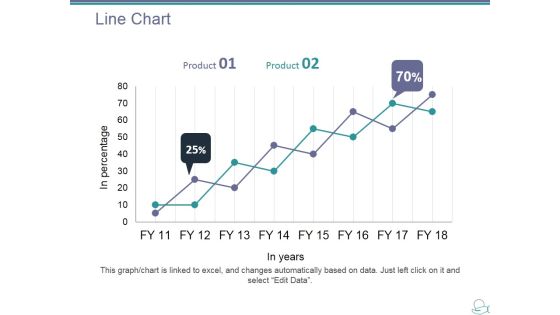
Line Chart Ppt PowerPoint Presentation Layouts Show
This is a line chart ppt powerpoint presentation layouts show. This is a two stage process. The stages in this process are product, in years, in percentage, line chart, growth.

Scatter Chart Ppt PowerPoint Presentation Ideas Designs Download
This is a scatter chart ppt powerpoint presentation ideas designs download. This is a one stage process. The stages in this process are product, dollar, in percentage, growth, success.
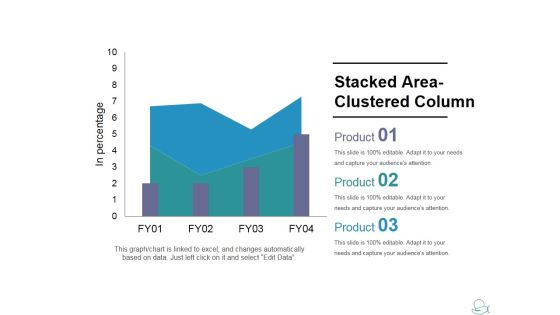
Stacked Area Clustered Column Ppt PowerPoint Presentation Slides Shapes
This is a stacked area clustered column ppt powerpoint presentation slides shapes. This is a three stage process. The stages in this process are product, growth, success graph, business.
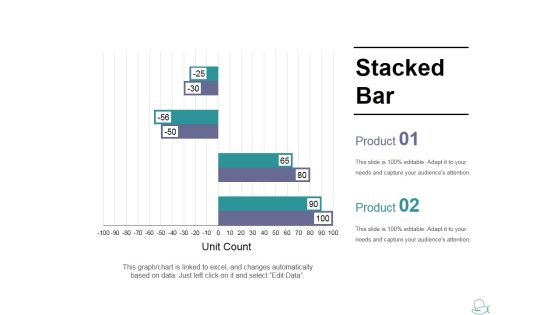
Stacked Bar Ppt PowerPoint Presentation Infographic Template Graphics Download
This is a stacked bar ppt powerpoint presentation infographic template graphics download. This is a two stage process. The stages in this process are product, stacked bar, business, unit count, marketing.

Bar Chart Ppt PowerPoint Presentation Icon Information
This is a bar chart ppt powerpoint presentation icon information. This is a one stage process. The stages in this process are product, sales in percentage, financial years, bar graph, growth.

Column Chart Ppt PowerPoint Presentation Layouts Background Images
This is a column chart ppt powerpoint presentation layouts background images. This is a two stage process. The stages in this process are product, in months, graph, growth, success.
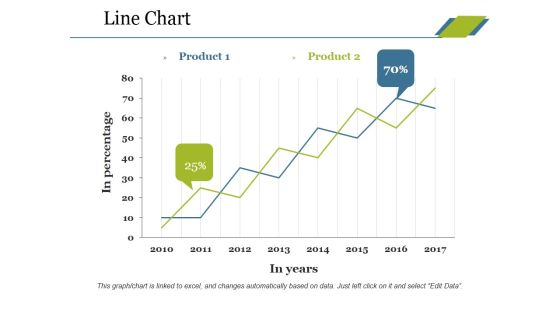
Line Chart Ppt PowerPoint Presentation Professional Tips
This is a line chart ppt powerpoint presentation professional tips. This is a two stage process. The stages in this process are product, in percentage, in years, growth, success.

Business Overview Ppt PowerPoint Presentation File Graphics Pictures
This is a business overview ppt powerpoint presentation file graphics pictures. This is a six stage process. The stages in this process are highlights, financial highlights, product offering, our team, quarter track record.

Clustered Bar Ppt PowerPoint Presentation Pictures Example
This is a clustered bar ppt powerpoint presentation pictures example. This is a three stage process. The stages in this process are product, unit count, clustered bar, business, marketing.

Comparison Based On Criteria Ppt PowerPoint Presentation Infographics Elements
This is a comparison based on criteria ppt powerpoint presentation infographics elements. This is a four stage process. The stages in this process are design, price, performance, product, competitor.
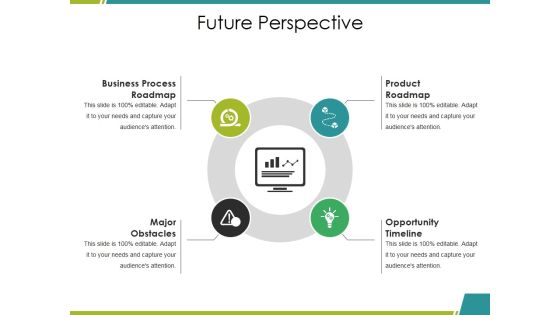
Future Perspective Ppt PowerPoint Presentation Inspiration Design Inspiration
This is a future perspective ppt powerpoint presentation inspiration design inspiration. This is a four stage process. The stages in this process are product roadmap, opportunity timeline, major obstacles, business process roadmap.
Our Team Ppt PowerPoint Presentation Model Icon
This is a our team ppt powerpoint presentation model icon. This is a four stage process. The stages in this process are teamwork, ceo, marketing manager, product manager, financial manager.

Sales Kpi Performance Summary Ppt PowerPoint Presentation Infographic Template Elements
This is a sales kpi performance summary ppt powerpoint presentation infographic template elements. This is a seven stage process. The stages in this process are revenue comparison, quantity comparison, product sales mix, regional sales mix, budget.
Sales Kpi Tracker Ppt PowerPoint Presentation Layout
This is a sales kpi tracker ppt powerpoint presentation layout. This is a six stage process. The stages in this process are leads created, sales ratio, opportunities won, top products in revenue, actual.
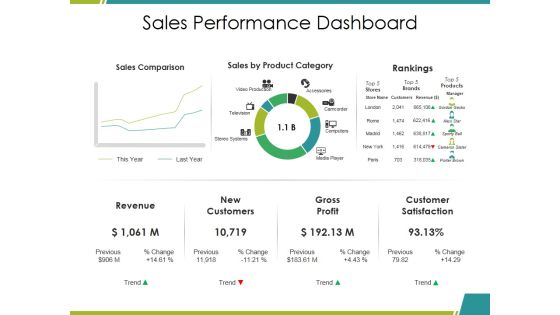
Sales Performance Dashboard Ppt PowerPoint Presentation Infographics Mockup
This is a sales performance dashboard ppt powerpoint presentation infographics mockup. This is a three stage process. The stages in this process are sales comparison, sales by product category, rankings, revenue, gross profit.

Sales Performance Ppt PowerPoint Presentation Pictures Format Ideas
This is a sales performance ppt powerpoint presentation pictures format ideas. This is a six stage process. The stages in this process are quarterly sales review, sales by region, sales performance dashboard, sales revenue by product.

Business Overview Ppt PowerPoint Presentation Styles Icons
This is a business overview ppt powerpoint presentation styles icons. This is a six stage process. The stages in this process are highlights, financial highlights, product offering, revenue split by country, quarter track record.
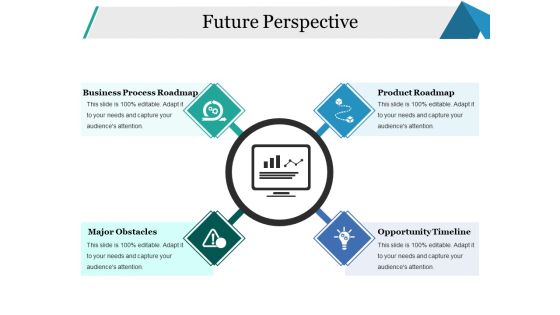
Future Perspective Ppt PowerPoint Presentation Portfolio Template
This is a future perspective ppt powerpoint presentation portfolio template. This is a four stage process. The stages in this process are business process roadmap, major obstacles, opportunity timeline, product roadmap, business.
Sales KPI Tracker Ppt PowerPoint Presentation Icon Themes
This is a sales kpi tracker ppt powerpoint presentation icon themes. This is a six stage process. The stages in this process are business, marketing, opportunities won, top products in revenue, leads created.

Sales Performance Dashboard Ppt PowerPoint Presentation Gallery Background
This is a sales performance dashboard ppt powerpoint presentation gallery backgroun. This is a six stage process. The stages in this process are sales comparison, sales by product category, rankings, revenue, new customers.
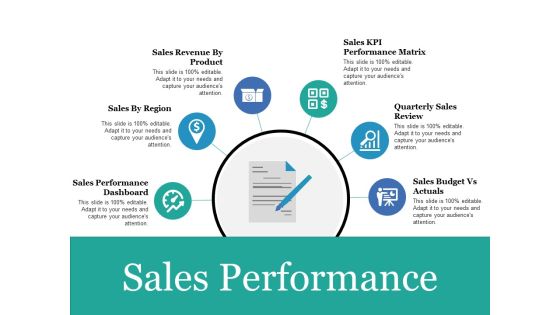
Sales Performance Ppt PowerPoint Presentation Portfolio Show
This is a sales performance ppt powerpoint presentation portfolio show. This is a six stage process. The stages in this process are sales performance dashboard, sales by region, sales revenue by product, quarterly sales review, sales budget vs actuals.

Business Overview Ppt PowerPoint Presentation Infographic Template Visuals
This is a business overview ppt powerpoint presentation infographic template visuals. This is a six stage process. The stages in this process are highlights, financial highlights, product offering, revenue split by country, quarter track record.
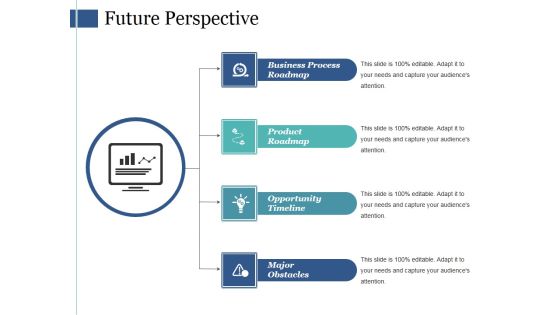
Future Perspective Ppt PowerPoint Presentation Show Diagrams
This is a future perspective ppt powerpoint presentation show diagrams. This is a four stage process. The stages in this process are business process roadmap, product roadmap, opportunity timeline, major obstacles.
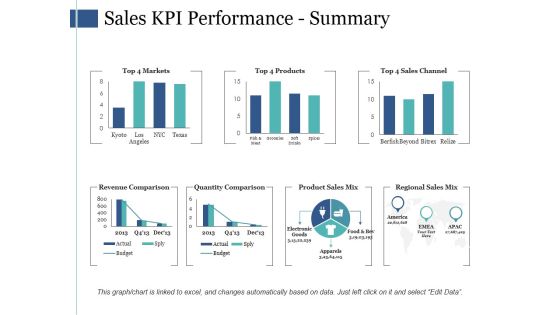
Sales Kpi Performance Summary Ppt PowerPoint Presentation Infographic Template Infographics
This is a sales kpi performance summary ppt powerpoint presentation infographic template infographics. This is a seven stage process. The stages in this process are revenue comparison, quantity comparison, product sales mix, regional sales mix.
Sales Kpi Tracker Ppt PowerPoint Presentation Visual Aids Files
This is a sales kpi tracker ppt powerpoint presentation visual aids files. This is a six stage process. The stages in this process are leads created, sales ratio, opportunities won, top products in revenue, open deals vs last yr.
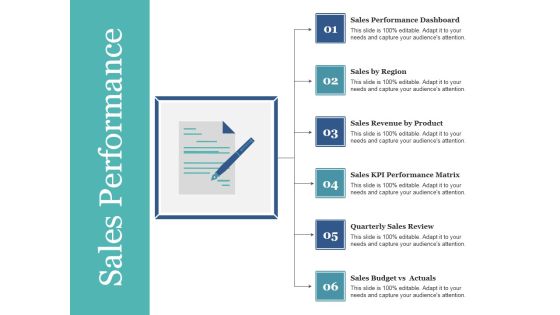
Sales Performance Ppt PowerPoint Presentation Summary Influencers
This is a sales performance ppt powerpoint presentation summary influencers. This is a six stage process. The stages in this process are sales performance dashboard, sales by region, sales revenue by product, sales kpi performance matrix, quarterly sales review.

Business Overview Ppt PowerPoint Presentation File Ideas
This is a business overview ppt powerpoint presentation file ideas. This is a six stage process. The stages in this process are highlights, financial highlights, product offering, revenue split by country, our team.
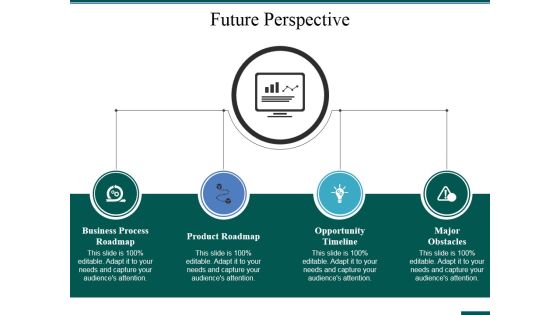
Future Perspective Ppt PowerPoint Presentation Model Example
This is a future perspective ppt powerpoint presentation model example. This is a four stage process. The stages in this process are business process roadmap, product roadmap, opportunity timeline, major obstacles.


 Continue with Email
 Sign up for an account
 Home
Home


