Plan

Metrics To Measure Business Performance Effective Rate Metrics By Customer And Offering Diagrams PDF
This slide covers effective rate metrics. It shows over year over comparison of effective rate per customer as well as effective rate per offering. Deliver and pitch your topic in the best possible manner with this Metrics To Measure Business Performance Effective Rate Metrics By Customer And Offering Diagrams PDF. Use them to share invaluable insights on Effective Rate, Per Customer, Per Offering and impress your audience. This template can be altered and modified as per your expectations. So, grab it now.

Metrics To Measure Business Performance Financial Performance Indicator Dashboard Pictures PDF
This slide shows financial performance indicator dashboard covering net profit and net sales, profitability indicator ratios, cogs and net profit by region or channel. Deliver an awe inspiring pitch with this creative Metrics To Measure Business Performance Financial Performance Indicator Dashboard Pictures PDF bundle. Topics like Net Profit, Net Sales, Cost Goods, Sold Breakdown can be discussed with this completely editable template. It is available for immediate download depending on the needs and requirements of the user.

Metrics To Measure Business Performance Profit Margin Dashboard Designs PDF
Following slide illustrates profit margin dashboard with a 12 months format. It also includes gross profit margin, operating profit margin and net profit margin. Deliver and pitch your topic in the best possible manner with this Metrics To Measure Business Performance Profit Margin Dashboard Designs PDF. Use them to share invaluable insights on Gross Profit Margin, Operating Profit Margin, Net Profit Margin and impress your audience. This template can be altered and modified as per your expectations. So, grab it now.
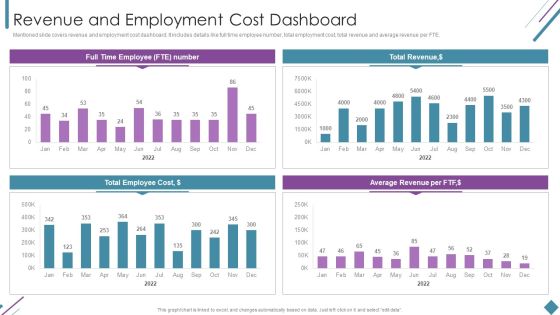
Metrics To Measure Business Performance Revenue And Employment Cost Dashboard Clipart PDF
Mentioned slide covers revenue and employment cost dashboard. It includes details like full time employee number, total employment cost, total revenue and average revenue per FTE. Deliver and pitch your topic in the best possible manner with this Metrics To Measure Business Performance Revenue And Employment Cost Dashboard Clipart PDF. Use them to share invaluable insights on Total Revenue, Average Revenue Per, Total Employee Cost and impress your audience. This template can be altered and modified as per your expectations. So, grab it now.

Digital Marketing Company Profile Competitive Analysis Summary PDF
This slide highlights the digital marketing company competitive analysis on the basis of net sales, unicorn clients, total experience, clients, client retention rate, total advertising channels and customed service offerings.Deliver an awe inspiring pitch with this creative Digital Marketing Company Profile Competitive Analysis Summary PDF bundle. Topics like Client Retention, Customized Services, Total Experience can be discussed with this completely editable template. It is available for immediate download depending on the needs and requirements of the user.

Digital Marketing Company Profile Revenue And Net Profit Download PDF
This slide highlights the revenue and net profit of digital marketing agency through bar graph and tabular format. It covers three years data of revenue, gross margin and net profit.Deliver an awe inspiring pitch with this creative Digital Marketing Company Profile Revenue And Net Profit Download PDF bundle. Topics like Increase Revenue, Gross Margin, Net Profit can be discussed with this completely editable template. It is available for immediate download depending on the needs and requirements of the user.

Digital Marketing Company Profile Sales Revenue By Market And Services Mockup PDF
This slide highlights the digital marketing company sales revenue by market share and services. It includes Northeast, Southwest, Southeast, Midwest regions sales revenue.Deliver and pitch your topic in the best possible manner with this Digital Marketing Company Profile Sales Revenue By Market And Services Mockup PDF. Use them to share invaluable insights on Conversion Optimization, Sales Revenue, Total Revenue and impress your audience. This template can be altered and modified as per your expectations. So, grab it now.
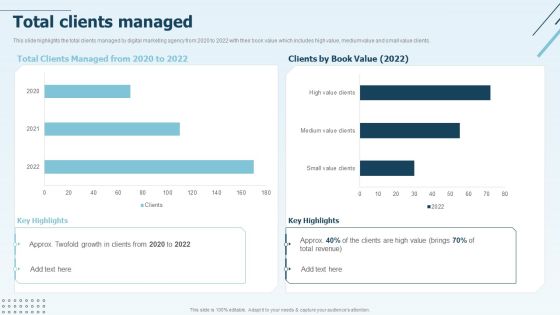
Digital Marketing Company Profile Total Clients Managed Formats PDF
This slide highlights the total clients managed by digital marketing agency from 2020 to 2022 with their book value which includes high value, medium value and small value clients. Deliver an awe inspiring pitch with this creative Digital Marketing Company Profile Total Clients Managed Formats PDF bundle. Topics like Clients Managed, Approx Twofold, Total Revenue can be discussed with this completely editable template. It is available for immediate download depending on the needs and requirements of the user.

Box Office Collection In Last Five Years Film Media Company Profile Ppt PowerPoint Presentation Icon Show PDF
This slide represents the box office collection of our film production house in last five years from 2018 to 2022 which shows maximum collection in 2021.Deliver and pitch your topic in the best possible manner with this Box Office Collection In Last Five Years Film Media Company Profile Ppt PowerPoint Presentation Icon Show PDF. Use them to share invaluable insights on Collection Increased, Released, Office Collection and impress your audience. This template can be altered and modified as per your expectations. So, grab it now.

Competitive Assessment Based On Market Share Film Media Company Profile Ppt PowerPoint Presentation File Design Inspiration PDF
This slide represents the film production house comparison with competitors based on market share which shows our leading company with greatest share in US market.Deliver and pitch your topic in the best possible manner with this Competitive Assessment Based On Market Share Film Media Company Profile Ppt PowerPoint Presentation File Design Inspiration PDF. Use them to share invaluable insights on Compared Competitors, Calculated Based, Office Revenue and impress your audience. This template can be altered and modified as per your expectations. So, grab it now.
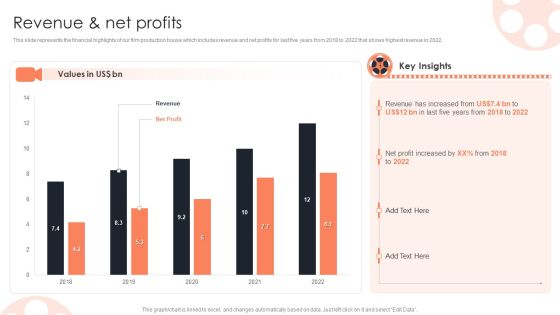
Revenue And Net Profits Film Media Company Profile Ppt PowerPoint Presentation Model Summary PDF
Deliver an awe inspiring pitch with this creative Revenue And Net Profits Film Media Company Profile Ppt PowerPoint Presentation Model Summary PDF bundle. Topics like Revenue Increased, Profit Increased, Values can be discussed with this completely editable template. It is available for immediate download depending on the needs and requirements of the user.

Revenue Split By Geography Film Media Company Profile Ppt PowerPoint Presentation Infographics Infographics PDF
This slide represents the financial highlights of our film production house which includes revenue and net profits for last five years from 2018 to 2022 that shows highest revenue in 2022.Deliver and pitch your topic in the best possible manner with this Revenue Split By Geography Film Media Company Profile Ppt PowerPoint Presentation Infographics Infographics PDF. Use them to share invaluable insights on United States, Revenue Distribution, Key Insights and impress your audience. This template can be altered and modified as per your expectations. So, grab it now.
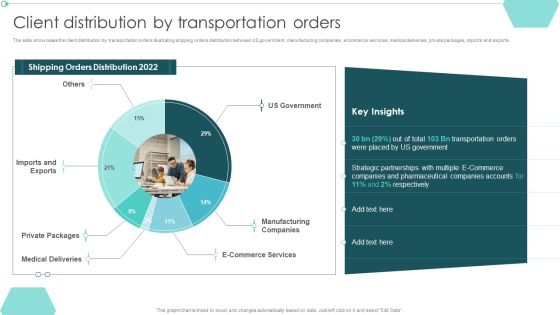
Transportation Company Profile Client Distribution By Transportation Orders Ppt PowerPoint Presentation Infographic Template Demonstration PDF
The slide showcases the client distribution by transportation orders illustrating shipping orders distribution between US government, manufacturing companies, ecommerce services, medical deliveries, private packages, imports and exports.Deliver an awe inspiring pitch with this creative Transportation Company Profile Client Distribution By Transportation Orders Ppt PowerPoint Presentation Infographic Template Demonstration PDF bundle. Topics like Manufacturing Companies, Private Packages, Medical Deliveries can be discussed with this completely editable template. It is available for immediate download depending on the needs and requirements of the user.
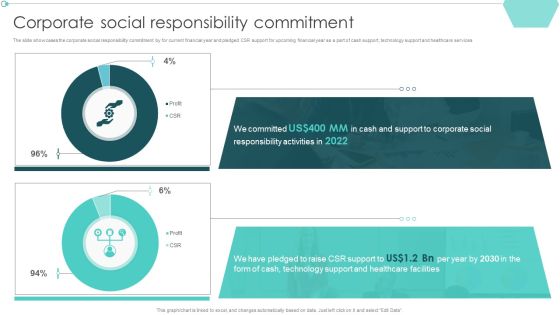
Transportation Company Profile Corporate Social Responsibility Commitment Ppt PowerPoint Presentation Model Master Slide PDF
The slide showcases the corporate social responsibility commitment by for current financial year and pledged CSR support for upcoming financial year as a part of cash support, technology support and healthcare services.Deliver an awe inspiring pitch with this creative Transportation Company Profile Corporate Social Responsibility Commitment Ppt PowerPoint Presentation Model Master Slide PDF bundle. Topics like Responsibility Activities, Pledged Raise, Technology Support can be discussed with this completely editable template. It is available for immediate download depending on the needs and requirements of the user.
Transportation Company Profile CSR Support For Sustainable Growth Ppt PowerPoint Presentation Icon Outfit PDF
The slide highlights the CSR support for society and spend distribution for current year. It depicts poverty support, quench hunger, health support, quality education, clean drinking water, gender equality, others, clean energy, global warming and clean ocean drive.Deliver and pitch your topic in the best possible manner with this Transportation Company Profile CSR Support For Sustainable Growth Ppt PowerPoint Presentation Icon Outfit PDF. Use them to share invaluable insights on Quench Hunger, Quality Education, Health Support and impress your audience. This template can be altered and modified as per your expectations. So, grab it now.
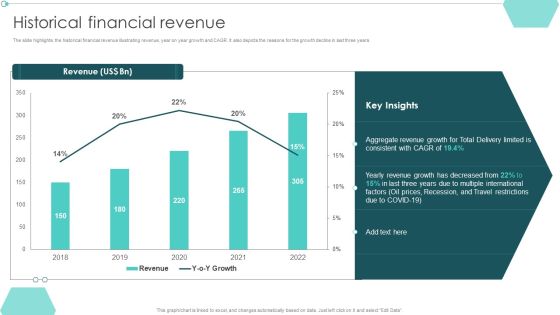
Transportation Company Profile Historical Financial Revenue Ppt PowerPoint Presentation File Layout PDF
The slide highlights the historical financial revenue illustrating revenue, year on year growth and CAGR. It also depicts the reasons for the growth decline in last three years.Deliver and pitch your topic in the best possible manner with this Transportation Company Profile Historical Financial Revenue Ppt PowerPoint Presentation File Layout PDF. Use them to share invaluable insights on Aggregate Revenue, Multiple International, Prices Recession and impress your audience. This template can be altered and modified as per your expectations. So, grab it now.

Transportation Company Profile Net Profit And Margin Ppt PowerPoint Presentation Summary Diagrams PDF
Deliver an awe inspiring pitch with this creative Transportation Company Profile Net Profit And Margin Ppt PowerPoint Presentation Summary Diagrams PDF bundle. Topics like Overall Profit, Increase In Crude, Profit Growth can be discussed with this completely editable template. It is available for immediate download depending on the needs and requirements of the user.
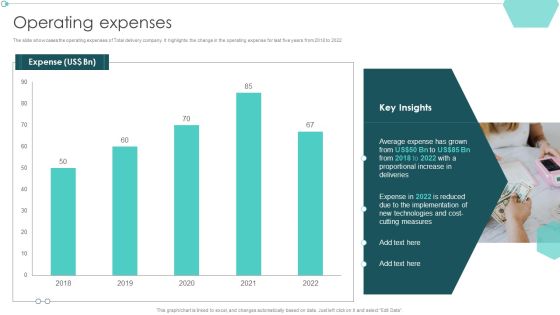
Transportation Company Profile Operating Expenses Ppt PowerPoint Presentation Portfolio Grid PDF
Deliver and pitch your topic in the best possible manner with this Transportation Company Profile Operating Expenses Ppt PowerPoint Presentation Portfolio Grid PDF. Use them to share invaluable insights on New Technologies, Cutting Measures, Proportional Increase and impress your audience. This template can be altered and modified as per your expectations. So, grab it now.
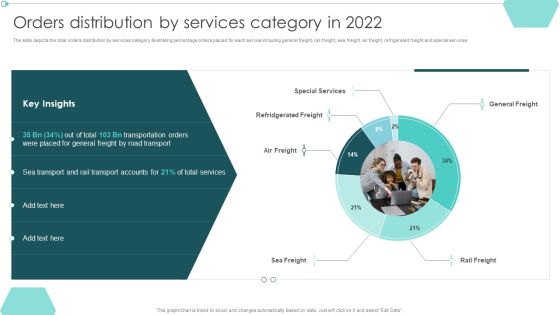
Transportation Company Profile Orders Distribution By Services Category In 2022 Ppt PowerPoint Presentation Slides Guidelines PDF
Deliver an awe inspiring pitch with this creative Transportation Company Profile Orders Distribution By Services Category In 2022 Ppt PowerPoint Presentation Slides Guidelines PDF bundle. Topics like Transportation Orders, Placed General, Transport Accounts can be discussed with this completely editable template. It is available for immediate download depending on the needs and requirements of the user.
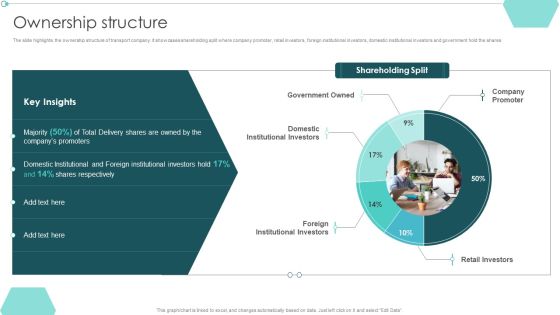
Transportation Company Profile Ownership Structure Ppt PowerPoint Presentation Show Introduction PDF
Deliver and pitch your topic in the best possible manner with this Transportation Company Profile Ownership Structure Ppt PowerPoint Presentation Show Introduction PDF. Use them to share invaluable insights on Domestic Institutional, Shares Respectively, Foreign Institutional and impress your audience. This template can be altered and modified as per your expectations. So, grab it now.

Departmental Goals And Progress Status Dashboard Ppt Portfolio Samples PDF
This slide illustrates statistics and graphical representation of team progress. It includes testing team, sales team, development team, members and progress status graphs etc. Pitch your topic with ease and precision using this Departmental Goals And Progress Status Dashboard Ppt Portfolio Samples PDF. This layout presents information on Testing Team, Sales Team, Development Team. It is also available for immediate download and adjustment. So, changes can be made in the color, design, graphics or any other component to create a unique layout.

Sales Departmental Goals Achievement Graph Ppt Inspiration Slide Download PDF
This slide illustrates graphical representation of achievement percentage of each team member. It includes achievement percent, name, due date and target of respective member. Pitch your topic with ease and precision using this Sales Departmental Goals Achievement Graph Ppt Inspiration Slide Download PDF. This layout presents information on Sales Departmental, Goals, Achievement Graph. It is also available for immediate download and adjustment. So, changes can be made in the color, design, graphics or any other component to create a unique layout.

Dashboard For Education Institutes With Student Retention Metrics Slides PDF
This slide covers dashboard for tracking student and faculty members details. It include metrics such as faculty to student ratio, student attendance rate, faculty retention rate, student enrollment details, examination results overview, etc. Showcasing this set of slides titled Dashboard For Education Institutes With Student Retention Metrics Slides PDF. The topics addressed in these templates are Student Enrollment Details, Examination Results Overview, Faculty Student Ratio. All the content presented in this PPT design is completely editable. Download it and make adjustments in color, background, font etc. as per your unique business setting.
Education Dashboard For Tracking Gender Based Retention Metrics Template PDF
This slide illustrates student retention analysis dashboard. It include metrics based on gender, campus, ethnicity, and age group. Pitch your topic with ease and precision using this Education Dashboard For Tracking Gender Based Retention Metrics Template PDF. This layout presents information on Gender Based, Retention Rates, Age Group, Campus Wise. It is also available for immediate download and adjustment. So, changes can be made in the color, design, graphics or any other component to create a unique layout.

Education Dashboard With Absenteeism And Grade Details Metrics Diagrams PDF
This slide covers dashboard for tracking causes and rates of student absenteeism. It also include metrics such as average grades by subject and department. Pitch your topic with ease and precision using this Education Dashboard With Absenteeism And Grade Details Metrics Diagrams PDF. This layout presents information on Grade Department, English Proficiency, Medical Abs. It is also available for immediate download and adjustment. So, changes can be made in the color, design, graphics or any other component to create a unique layout.
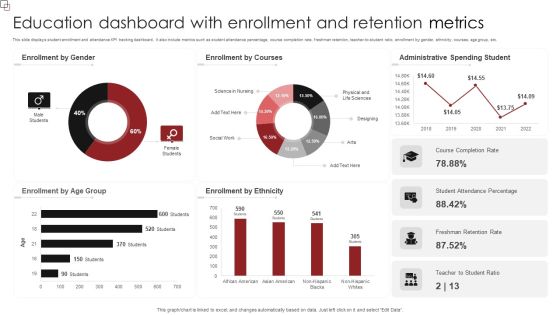
Education Dashboard With Enrollment And Retention Metrics Sample PDF
This slide displays student enrollment and attendance KPI tracking dashboard. It also include metrics such as student attendance percentage, course completion rate, freshman retention, teacher-to-student ratio, enrollment by gender, ethnicity, courses, age group, etc. Pitch your topic with ease and precision using this Education Dashboard With Enrollment And Retention Metrics Sample PDF. This layout presents information on Enrollment Gender, Enrollment Courses, Administrative Spending Student. It is also available for immediate download and adjustment. So, changes can be made in the color, design, graphics or any other component to create a unique layout.
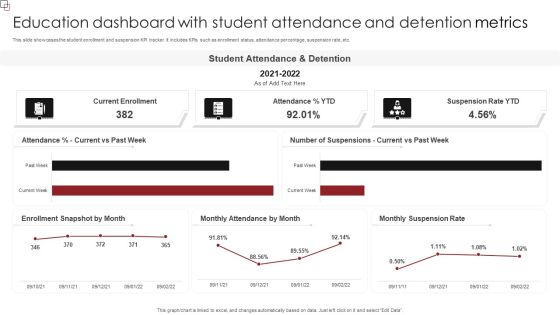
Education Dashboard With Student Attendance And Detention Metrics Inspiration PDF
This slide showcases the student enrollment and suspension KPI tracker. It includes KPIs such as enrollment status, attendance percentage, suspension rate, etc. Pitch your topic with ease and precision using this Education Dashboard With Student Attendance And Detention Metrics Inspiration PDF. This layout presents information on Student Attendance, Suspension Rate YTD, Current Enrollment. It is also available for immediate download and adjustment. So, changes can be made in the color, design, graphics or any other component to create a unique layout.
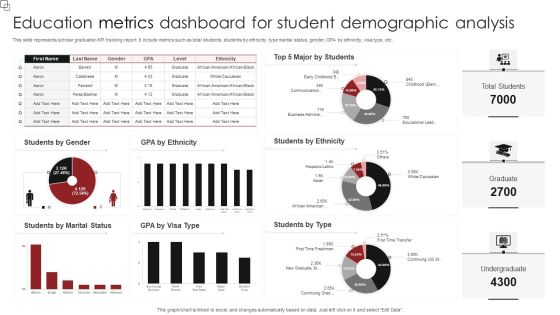
Education Metrics Dashboard For Student Demographic Analysis Diagrams PDF
This slide represents scholar graduation KPI tracking report. It include metrics such as total students, students by ethnicity, type marital status, gender, GPA by ethnicity, visa type, etc. Showcasing this set of slides titled Education Metrics Dashboard For Student Demographic Analysis Diagrams PDF. The topics addressed in these templates are Students Ethnicity, Students Type, Students Marital Status. All the content presented in this PPT design is completely editable. Download it and make adjustments in color, background, font etc. as per your unique business setting.
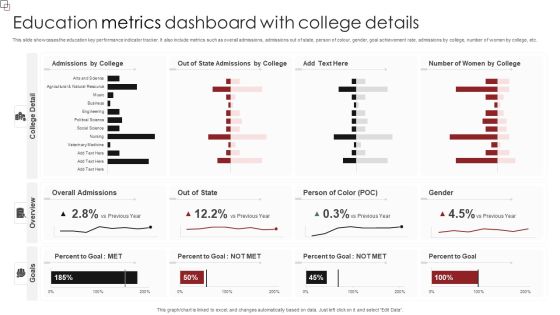
Education Metrics Dashboard With College Details Formats PDF
This slide showcases the education key performance indicator tracker. It also include metrics such as overall admissions, admissions out of state, person of colour, gender, goal achievement rate, admissions by college, number of women by college, etc. Pitch your topic with ease and precision using this Education Metrics Dashboard With College Details Formats PDF. This layout presents information on Overall Admissions, Person Of Color, Percent To Goal. It is also available for immediate download and adjustment. So, changes can be made in the color, design, graphics or any other component to create a unique layout.
Education Metrics Tracker For Students Performance Evaluation Professional PDF
This slide covers student performance analysis dashboard. It include metrics student count, student attendance, average subject score, branch examination results, student count by grade, etc. Showcasing this set of slides titled Education Metrics Tracker For Students Performance Evaluation Professional PDF. The topics addressed in these templates are Students Count, Grade And Gender, Students Details, Examination Results Branch. All the content presented in this PPT design is completely editable. Download it and make adjustments in color, background, font etc. as per your unique business setting.

Education Scorecard With Division Based Enrolment Metrics Professional PDF
This slide showcases dashboard for tracking student enrollment in a district. It include metrics such as student-teacher ratio, enrolment by gender, education assessment score, detention by school type, etc. Pitch your topic with ease and precision using this Education Scorecard With Division Based Enrolment Metrics Professional PDF. This layout presents information on Education Assessment Score, Enrollment Gender. It is also available for immediate download and adjustment. So, changes can be made in the color, design, graphics or any other component to create a unique layout.
Education Metrics Dashboard For Tracking Student Ethnicity And Specially Abled Characteristics Brochure PDF
This slide covers the education key performance indicator tracker. It include metrics such as total applications, conversion rate, offers year to date, applications by ethnicity and disabilities, etc. Showcasing this set of slides titled Education Metrics Dashboard For Tracking Student Ethnicity And Specially Abled Characteristics Brochure PDF. The topics addressed in these templates are Total Applications, Conversion Rate 2022, Ethnicity. All the content presented in this PPT design is completely editable. Download it and make adjustments in color, background, font etc. as per your unique business setting.

Actual Vs Budgeted Expenses Graph For Human Resource Activities Guidelines PDF
This slide showcases graph that can help organization to compare the actual and budgeted expenses incurred in conducting human resource activities. Its key components are workplace safety, labour relations, recruitment and employee health. Showcasing this set of slides titled Actual Vs Budgeted Expenses Graph For Human Resource Activities Guidelines PDF. The topics addressed in these templates are Safety Equipment Webinars, Employee, Expenses. All the content presented in this PPT design is completely editable. Download it and make adjustments in color, background, font etc. as per your unique business setting.

Annual Human Resource Report With Employee Hiring And Promotion Graph Mockup PDF
This slide showcases HR report and graph that can help organization to identify number of of employees demoted and promoted in the company. It showcases comparison for a period of last three years. Pitch your topic with ease and precision using this Annual Human Resource Report With Employee Hiring And Promotion Graph Mockup PDF. This layout presents information on Technology, Product, Employees. It is also available for immediate download and adjustment. So, changes can be made in the color, design, graphics or any other component to create a unique layout.
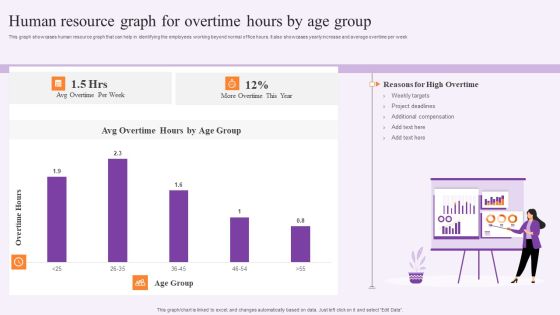
Human Resource Graph For Overtime Hours By Age Group Rules PDF
This graph showcases human resource graph that can help in identifying the employees working beyond normal office hours. It also showcases yearly increase and average overtime per week. Pitch your topic with ease and precision using this Human Resource Graph For Overtime Hours By Age Group Rules PDF. This layout presents information on Weekly Targets, Project Deadlines. It is also available for immediate download and adjustment. So, changes can be made in the color, design, graphics or any other component to create a unique layout.

Human Resource Graph To Compare Yearly Employee Count By Department Professional PDF
This slide showcases graph that can help organization to compare the yearly change in employees numbers of different departments. It showcases comparison for a period of two years. Showcasing this set of slides titled Human Resource Graph To Compare Yearly Employee Count By Department Professional PDF. The topics addressed in these templates are Marketing Department, Sales Department, Research Department. All the content presented in this PPT design is completely editable. Download it and make adjustments in color, background, font etc. as per your unique business setting.

Yearly Comparison Graph For Human Resource Employees Salary Template PDF
This slide showcases yearly comparison of salary of different employees in organization and identify the increment growth rate. It showcases comparative assessment for a period of 4 years. Pitch your topic with ease and precision using this Yearly Comparison Graph For Human Resource Employees Salary Template PDF. This layout presents information on Human Resource, Employees Salary. It is also available for immediate download and adjustment. So, changes can be made in the color, design, graphics or any other component to create a unique layout.
Quarterly Employee Performance Tracking With KPI Dashboard Portrait PDF
The following slide depicts the employee performance analysis on quarterly basis to identify their effectiveness and inefficiencies. It includes elements such as absenteeism, training cost, overtime, labor effectiveness etc. Showcasing this set of slides titled Quarterly Employee Performance Tracking With KPI Dashboard Portrait PDF. The topics addressed in these templates are Training Costs, Quarterly Average, Target. All the content presented in this PPT design is completely editable. Download it and make adjustments in color, background, font etc. as per your unique business setting.

Quarterly Financial Performance Kpis With Balance Sheet Designs PDF
The given slide highlights the quarterly financial performance of a company. It also includes KPIs such as ROA, working capital ratio, return on equity, debt equity ratio etc. Pitch your topic with ease and precision using this Quarterly Financial Performance Kpis With Balance Sheet Designs PDF. This layout presents information on Total Liabilities, Return On Equity, Working Capital Ratio. It is also available for immediate download and adjustment. So, changes can be made in the color, design, graphics or any other component to create a unique layout.

Quarterly Marketing Performance Review Kpis Background PDF
The given below slide highlights the marketing insights to maximize the performance. It includes KPIs such as total marketing expenditure compared to target budget, total impressions, clicks, acquisitions, cost per acquisition etc. Showcasing this set of slides titled Quarterly Marketing Performance Review Kpis Background PDF. The topics addressed in these templates are Total Acquisitions, Cost Per Acquisition, Marketing Expenditure. All the content presented in this PPT design is completely editable. Download it and make adjustments in color, background, font etc. as per your unique business setting.

Quarterly Overall Business Performance Assessment With Kpi Dashboard Microsoft PDF
The given below slide showcases the overall business performance to evaluate the trends and KPAs. It includes quarterly insights of elements such as revenue, new customers, net profit, customer satisfaction, sales profitability, growth etc. Pitch your topic with ease and precision using this Quarterly Overall Business Performance Assessment With Kpi Dashboard Microsoft PDF. This layout presents information on Revenue, Customer Satisfaction, Net Profit. It is also available for immediate download and adjustment. So, changes can be made in the color, design, graphics or any other component to create a unique layout.

Quarterly Sales Team Performance Analysis Kpis Slides PDF
The following slide depicts the efforts made my sales team in increasing companys growth. It also includes KPAs such as new customers acquired, sales, profit, average revenue per unit, customer lifetime value, acquisition cost etc. Showcasing this set of slides titled Quarterly Sales Team Performance Analysis Kpis Slides PDF. The topics addressed in these templates are Above Sales Target, Average Sales Revenue, Average Customer. All the content presented in this PPT design is completely editable. Download it and make adjustments in color, background, font etc. as per your unique business setting.
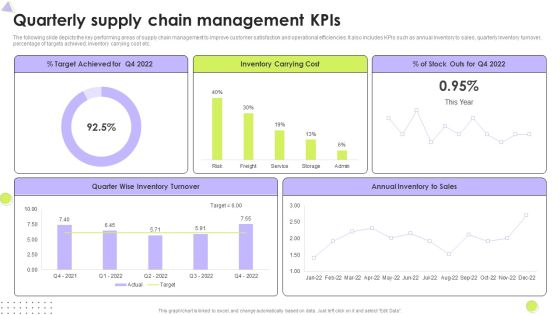
Quarterly Supply Chain Management Kpis Mockup PDF
The following slide depicts the key performing areas of supply chain management to improve customer satisfaction and operational efficiencies. It also includes KPIs such as annual inventory to sales, quarterly inventory turnover, percentage of targets achieved, inventory carrying cost etc. Pitch your topic with ease and precision using this Quarterly Supply Chain Management Kpis Mockup PDF. This layout presents information on Inventory Turnover, Inventory Carrying Cost, Target Achieved. It is also available for immediate download and adjustment. So, changes can be made in the color, design, graphics or any other component to create a unique layout.
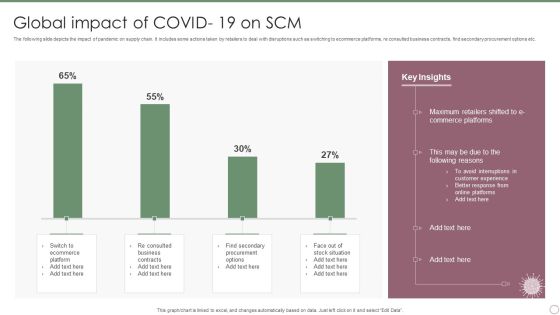
Global Impact Of COVID 19 On SCM Ppt PowerPoint Presentation File Sample PDF
The following slide depicts the impact of pandemic on supply chain. It includes some actions taken by retailers to deal with disruptions such as switching to ecommerce platforms, re consulted business contracts, find secondary procurement options etc. Showcasing this set of slides titled Global Impact Of COVID 19 On SCM Ppt PowerPoint Presentation File Sample PDF. The topics addressed in these templates are Maximum Retailers Shifted, Commerce Platforms, Customer Experience. All the content presented in this PPT design is completely editable. Download it and make adjustments in color, background, font etc. as per your unique business setting.
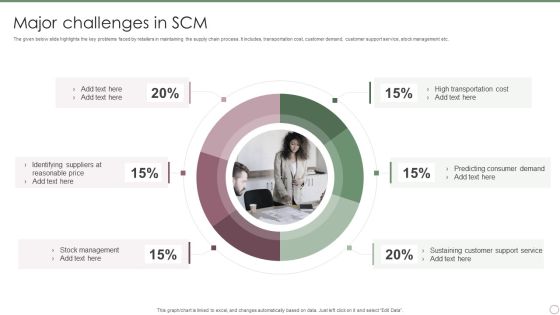
Major Challenges In SCM Ppt PowerPoint Presentation Gallery Pictures PDF
The given below slide highlights the key problems faced by retailers in maintaining the supply chain process. It includes, transportation cost, customer demand, customer support service, stock management etc. Pitch your topic with ease and precision using this Major Challenges In SCM Ppt PowerPoint Presentation Gallery Pictures PDF. This layout presents information on High Transportation Cost, Predicting Consumer Demand, Sustaining Customer, Support Service. It is also available for immediate download and adjustment. So, changes can be made in the color, design, graphics or any other component to create a unique layout.
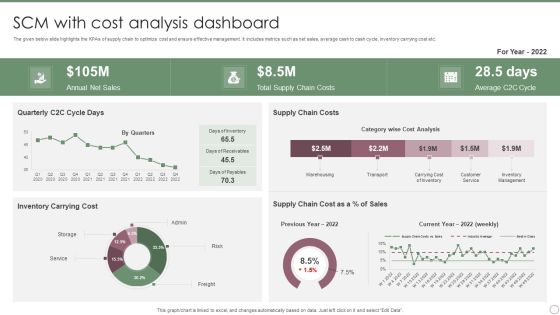
SCM With Cost Analysis Dashboard Ppt PowerPoint Presentation File Slides PDF
The given below slide highlights the KPAs of supply chain to optimize cost and ensure effective management. It includes metrics such as net sales, average cash to cash cycle, inventory carrying cost etc. Showcasing this set of slides titled SCM With Cost Analysis Dashboard Ppt PowerPoint Presentation File Slides PDF. The topics addressed in these templates are Annual Net Sales, Total Supply Chain, Costs, Average C2C Cycle. All the content presented in this PPT design is completely editable. Download it and make adjustments in color, background, font etc. as per your unique business setting.
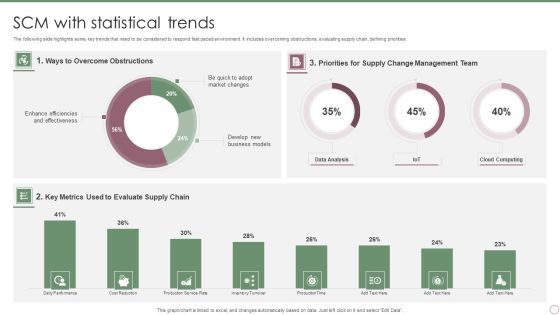
SCM With Statistical Trends Ppt PowerPoint Presentation Gallery Examples PDF
The following slide highlights some key trends that need to be considered to respond fast paced environment. It includes overcoming obstructions, evaluating supply chain, defining priorities. Pitch your topic with ease and precision using this SCM With Statistical Trends Ppt PowerPoint Presentation Gallery Examples PDF. This layout presents information on Ways To Overcome, Obstructions, Key Metrics, Evaluate Supply Chain. It is also available for immediate download and adjustment. So, changes can be made in the color, design, graphics or any other component to create a unique layout.

BPO Call Center Company Profile Revenue And Profit Of Call Centers Template PDF
This slide highlights the revenue and profit of call center company through bar graph format which includes data from last 5 years from financial year 2018 to 2022.Deliver and pitch your topic in the best possible manner with this BPO Call Center Company Profile Revenue And Profit Of Call Centers Template PDF. Use them to share invaluable insights on Revenue Increased, Profit Increased, Profit Million and impress your audience. This template can be altered and modified as per your expectations. So, grab it now.

BPO Call Center Company Profile Revenue Breakdown Of Services By Industries And Regions Professional PDF
This slide highlights the revenue breakdown of call center company on the basis of different industries and regions which include healthcare, telecom, manufacturing, BFSI, travel, ecommerce and retail sectors along with European, Russian and Asian regions. Deliver an awe inspiring pitch with this creative BPO Call Center Company Profile Revenue Breakdown Of Services By Industries And Regions Professional PDF bundle. Topics like Ecommerce Retail, Ecommerce Generates, Healthcare Comprises can be discussed with this completely editable template. It is available for immediate download depending on the needs and requirements of the user.

Companys Existing Social Media Engagement Scenario Introduction PDF
This slide depicts current social media engagement performance of organization. It includes information about organic reach, average shares per post, new likes and followers and leads generated from social media platforms. Deliver an awe inspiring pitch with this creative Companys Existing Social Media Engagement Scenario Introduction PDF bundle. Topics like Advertisement Budget, Brand Awareness, Social Media can be discussed with this completely editable template. It is available for immediate download depending on the needs and requirements of the user.
Global Outlook Of Social Media Platforms Customer Group Engagement Through Social Media Channels Icons PDF
This slide shows worldwide highlights of social media platforms. It provides information about network, users, demographic information, population, accounts, apps, active users, etc. Deliver and pitch your topic in the best possible manner with this Global Outlook Of Social Media Platforms Customer Group Engagement Through Social Media Channels Icons PDF. Use them to share invaluable insights on Statistics, Product, Potential Organic and impress your audience. This template can be altered and modified as per your expectations. So, grab it now.

Posting Relevant Content For Social Media Platforms Customer Group Engagement Through Social Media Channels Summary PDF
This slide depicts facts and figures of suitable content on social media platforms. It provides information such as video, stories, text posts, URL, photos, Twitter, Instagram, Facebook, etc. Deliver an awe inspiring pitch with this creative Posting Relevant Content For Social Media Platforms Customer Group Engagement Through Social Media Channels Summary PDF bundle. Topics like Average Organic Reach, Margin can be discussed with this completely editable template. It is available for immediate download depending on the needs and requirements of the user.

Social Media Campaign Performance Dashboard Customer Group Engagement Through Social Media Channels Infographics PDF
Deliver and pitch your topic in the best possible manner with this Social Media Campaign Performance Dashboard Customer Group Engagement Through Social Media Channels Infographics PDF . Use them to share invaluable insights on Cost Per Conversion, Campaigns Funnel and impress your audience. This template can be altered and modified as per your expectations. So, grab it now.
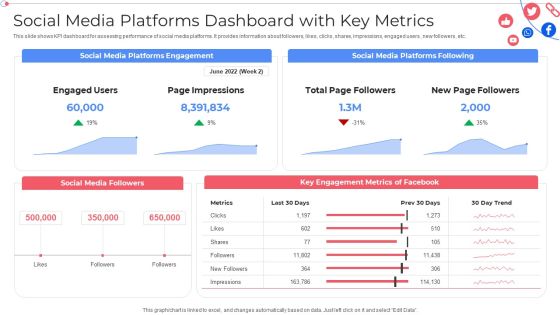
Social Media Platforms Dashboard With Key Metrics Customer Group Engagement Through Social Media Channels Infographics PDF
This slide shows KPI dashboard for assessing performance of social media platforms. It provides information about followers, likes, clicks, shares, impressions, engaged users , new followers, etc. Deliver an awe inspiring pitch with this creative Social Media Platforms Dashboard With Key Metrics Customer Group Engagement Through Social Media Channels Infographics PDF bundle. Topics like Social Media Followers, Key Engagement Metrics can be discussed with this completely editable template. It is available for immediate download depending on the needs and requirements of the user.

Data Lake Development With Azure Cloud Software Centralized Repository Data Lake Reporting Dashboard Demonstration PDF
This slide represents the data lake reporting dashboard by covering the total number of users, total lake size, trusted zone size, conversion rate, and retention. Deliver an awe inspiring pitch with this creative Data Lake Development With Azure Cloud Software Centralized Repository Data Lake Reporting Dashboard Demonstration PDF bundle. Topics like Conversion Rate, Services And Support can be discussed with this completely editable template. It is available for immediate download depending on the needs and requirements of the user.
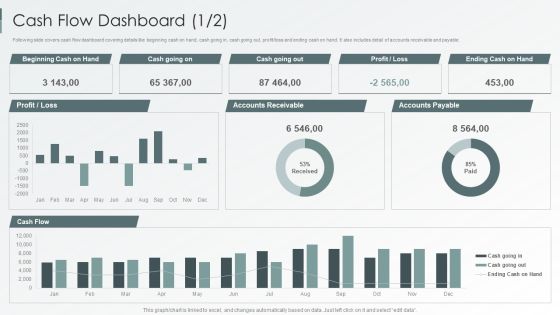
Enterprise Sustainability Performance Metrics Cash Flow Dashboard Inspiration PDF
Following slide covers cash flow dashboard covering details like beginning cash on hand, cash going in, cash going out, profit loss and ending cash on hand. It also includes detail of accounts receivable and payable.Deliver an awe inspiring pitch with this creative Enterprise Sustainability Performance Metrics Cash Flow Dashboard Inspiration PDF bundle. Topics like Accounts Receivable, Accounts Payable, Profit Loss can be discussed with this completely editable template. It is available for immediate download depending on the needs and requirements of the user.
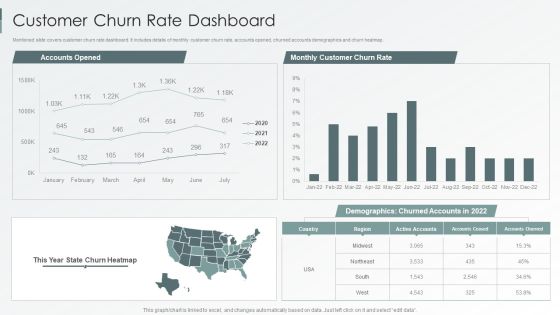
Enterprise Sustainability Performance Metrics Customer Churn Rate Dashboard Summary PDF
Mentioned slide covers customer churn rate dashboard. It includes details of monthly customer churn rate, accounts opened, churned accounts demographics and churn heatmap.Deliver an awe inspiring pitch with this creative Enterprise Sustainability Performance Metrics Customer Churn Rate Dashboard Summary PDF bundle. Topics like Accounts Opened, Demographics Churned, Monthly Customer can be discussed with this completely editable template. It is available for immediate download depending on the needs and requirements of the user.
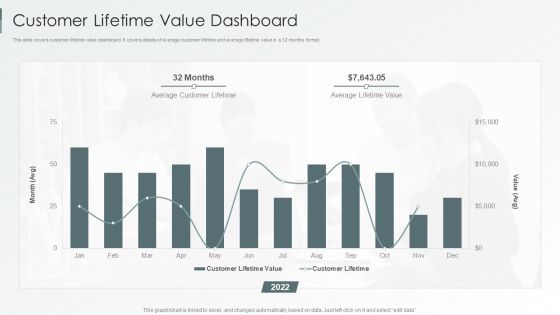
Enterprise Sustainability Performance Metrics Customer Lifetime Value Dashboard Graphics PDF
This slide covers customer lifetime value dashboard. It covers details of average customer lifetime and average lifetime value in a 12 months format.Deliver and pitch your topic in the best possible manner with this Enterprise Sustainability Performance Metrics Customer Lifetime Value Dashboard Graphics PDF. Use them to share invaluable insights on Average Customer, Lifetime Value, Customer Lifetime and impress your audience. This template can be altered and modified as per your expectations. So, grab it now.
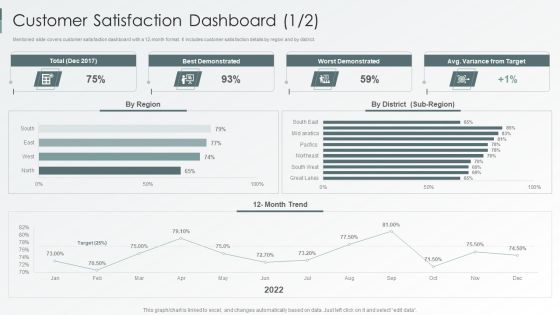
Enterprise Sustainability Performance Metrics Customer Satisfaction Dashboard Designs PDF
Mentioned slide covers customer satisfaction dashboard with a 12-month format. It includes customer satisfaction details by region and by district. Deliver an awe inspiring pitch with this creative Enterprise Sustainability Performance Metrics Customer Satisfaction Dashboard Designs PDF bundle. Topics like Best Demonstrated, Worst Demonstrated, Variance Target can be discussed with this completely editable template. It is available for immediate download depending on the needs and requirements of the user.
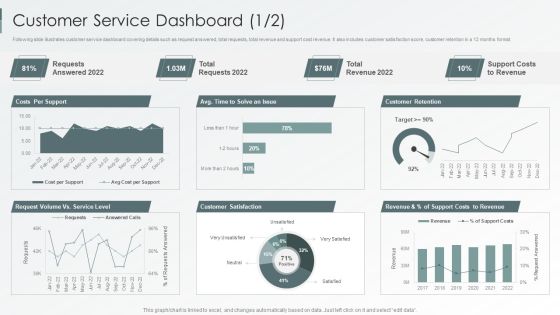
Enterprise Sustainability Performance Metrics Customer Service Dashboard Professional PDF
Following slide illustrates customer service dashboard covering details such as request answered, total requests, total revenue and support cost revenue. It also includes customer satisfaction score, customer retention in a 12 months format.Deliver and pitch your topic in the best possible manner with this Enterprise Sustainability Performance Metrics Customer Service Dashboard Professional PDF. Use them to share invaluable insights on Customer Satisfaction, Customer Retention, Support Revenue and impress your audience. This template can be altered and modified as per your expectations. So, grab it now.


 Continue with Email
 Sign up for an account
 Home
Home


