Plan
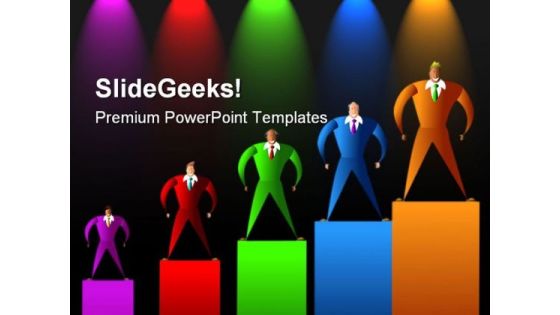
Success Leadership PowerPoint Themes And PowerPoint Slides 0511
Microsoft PowerPoint Theme and Slide with colourful executives with different sales results

Business Win Success PowerPoint Themes And PowerPoint Slides 0611
Microsoft PowerPoint Theme and Slide with male executive writing motivation concept

PowerPoint Slidelayout Company Double Ring Ppt Slides
PowerPoint Slidelayout Company Double Ring PPT Slides-The Circle of Life - a concept emmbedded in our minds and hence easy to comprehend. Life and Business is made up of processes comprising stages that flow from one to another. An excellent graphic to attract the attention of and understanding by your audience to improve earnings.-These amazing PowerPoint pre-designed slides and PowerPoint templates have been carefully created by our team of experts to help you impress your audience. Our stunning collection of Powerpoint slides are 100% editable and can easily fit in any PowerPoint presentations. By using these animations and graphics in PowerPoint and you can easily make professional presentations. Any text can be entered at any point in the PowerPoint template or slide. Just DOWNLOAD our awesome PowerPoint templates and you are ready to go.
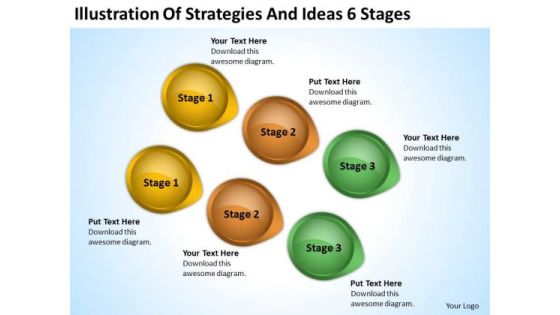
Massively Parallel Processing Database 6 Stages PowerPoint Templates Ppt Backgrounds For Slides
We present our massively parallel processing database 6 stages PowerPoint templates PPT backgrounds for slides.Download and present our Business PowerPoint Templates because You can Be the puppeteer with our PowerPoint Templates and Slides as your strings. Lead your team through the steps of your script. Use our Arrows PowerPoint Templates because You can Be the star of the show with our PowerPoint Templates and Slides. Rock the stage with your ideas. Use our Circle Charts PowerPoint Templates because You should Bet on your luck with our PowerPoint Templates and Slides. Be assured that you will hit the jackpot. Download our Shapes PowerPoint Templates because You should Press the right buttons with our PowerPoint Templates and Slides. They will take your ideas down the perfect channel. Present our Symbol PowerPoint Templates because Our PowerPoint Templates and Slides will let you Hit the right notes. Watch your audience start singing to your tune.Use these PowerPoint slides for presentations relating to abstract, arrow, art, background, banner, blue, bright, business, circle, color, colorful, concept, conceptual, connection, creative, cycle, design, different, element, empty, flower, form, frame, graphic, green, group, idea, illustration, match, message, order, part, petal, piece, place, red, ring, shape, solution, special, speech, strategy, symbol, template, text, usable, vector, web, website. The prominent colors used in the PowerPoint template are Yellow, Green, Brown. People tell us our massively parallel processing database 6 stages PowerPoint templates PPT backgrounds for slides will make the presenter look like a pro even if they are not computer savvy. People tell us our business PowerPoint templates and PPT Slides have awesome images to get your point across. Presenters tell us our massively parallel processing database 6 stages PowerPoint templates PPT backgrounds for slides are designed by professionals We assure you our banner PowerPoint templates and PPT Slides will generate and maintain the level of interest you desire. They will create the impression you want to imprint on your audience. Presenters tell us our massively parallel processing database 6 stages PowerPoint templates PPT backgrounds for slides are readymade to fit into any presentation structure. Professionals tell us our background PowerPoint templates and PPT Slides will impress their bosses and teams.
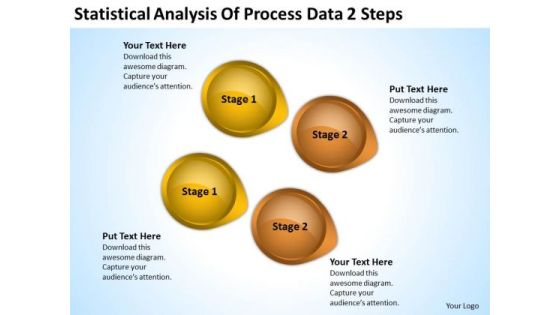
Power Point Arrows Statistical Analysis Of Process Data 2 Steps PowerPoint Templates
We present our power point arrows statistical analysis of process data 2 steps PowerPoint templates.Download and present our Business PowerPoint Templates because It is Aesthetically crafted by artistic young minds. Our PowerPoint Templates and Slides are designed to display your dexterity. Present our Arrows PowerPoint Templates because You can Rise to the occasion with our PowerPoint Templates and Slides. You will bring your audience on their feet in no time. Download and present our Circle Charts PowerPoint Templates because Our PowerPoint Templates and Slides help you pinpoint your timelines. Highlight the reasons for your deadlines with their use. Present our Shapes PowerPoint Templates because You aspire to touch the sky with glory. Let our PowerPoint Templates and Slides provide the fuel for your ascent. Present our Symbol PowerPoint Templates because You have gained great respect for your brilliant ideas. Use our PowerPoint Templates and Slides to strengthen and enhance your reputation.Use these PowerPoint slides for presentations relating to abstract, arrow, art, background, banner, blue, bright, business, circle, color, colorful, concept, conceptual, connection, creative, cycle, design, different, element, empty, flower, form, frame, graphic, green, group, idea, illustration, match, message, order, part, petal, piece, place, red, ring, shape, solution, special, speech, strategy, symbol, template, text, usable, vector, web, website. The prominent colors used in the PowerPoint template are Yellow, Brown, Black. People tell us our power point arrows statistical analysis of process data 2 steps PowerPoint templates will impress their bosses and teams. People tell us our circle PowerPoint templates and PPT Slides are designed by professionals Presenters tell us our power point arrows statistical analysis of process data 2 steps PowerPoint templates are second to none. We assure you our banner PowerPoint templates and PPT Slides will make the presenter successul in his career/life. Presenters tell us our power point arrows statistical analysis of process data 2 steps PowerPoint templates will help you be quick off the draw. Just enter your specific text and see your points hit home. Professionals tell us our background PowerPoint templates and PPT Slides will make the presenter look like a pro even if they are not computer savvy.

Investment Pitch To Generate Capital From Series B Venture Round Competitors Analysis Framework Company Specific And Target Customers Summary PDF
The slide provides the competitors analysis related to company specific Founded, Funding, Investors details etc. and target customers Product, Primary Buyers, Customer Service etc. Deliver and pitch your topic in the best possible manner with this investment pitch to generate capital from series b venture round competitors analysis framework company specific and target customers summary pdf. Use them to share invaluable insights on company specific, target customer, competitor and impress your audience. This template can be altered and modified as per your expectations. So, grab it now.

Cloud Intelligence Framework For Application Consumption Key Tech Trends In A Post COVID 19 World Diagrams PDF
The slide provides the technology trends under the major technologies AI, cloud computing, internet of things, cybersecurity in a Post-COVID-19 world. Presenting cloud intelligence framework for application consumption key tech trends in a post covid 19 world diagrams pdf to provide visual cues and insights. Share and navigate important information on four stages that need your due attention. This template can be used to pitch topics like businesses organize effective logistics, cybersecurity, technologies for organizations, artificial intelligence. In addtion, this PPT design contains high resolution images, graphics, etc, that are easily editable and available for immediate download.

Cloud Intelligence Framework Application Consumption Case Study 3 Re Engineering Of Smart Infrastructure Solution In A Utility Company Download PDF
The slide provides the case study of a Utility company that covered the details such as client overview, major challenge, smart infrastructure solution, and the result. This is a cloud intelligence framework application consumption case study 3 re engineering of smart infrastructure solution in a utility company download pdf template with various stages. Focus and dispense information on three stages using this creative set, that comes with editable features. It contains large content boxes to add your information on topics like case overview, smart infrastructure solution, technologies, provider serving, developed an integrated. You can also showcase facts, figures, and other relevant content using this PPT layout. Grab it now.
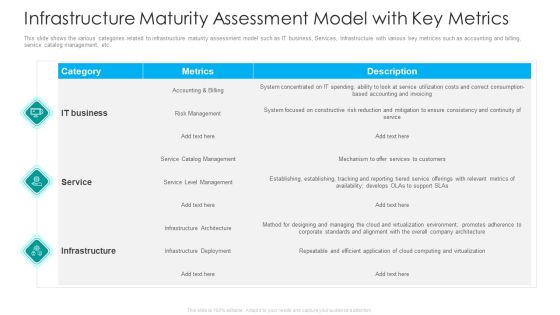
IT Facilities Maturity Framework For Strong Business Financial Position Infrastructure Maturity Assessment Model With Key Metrics Download PDF
This slide shows the various categories related to infrastructure maturity assessment model such as IT business, Services, Infrastructure with various key metrices such as accounting and billing, service catalog management, etc. Deliver an awe inspiring pitch with this creative it facilities maturity framework for strong business financial position infrastructure maturity assessment model with key metrics download pdf bundle. Topics like it business, service, infrastructure, risk management, deployment can be discussed with this completely editable template. It is available for immediate download depending on the needs and requirements of the user.
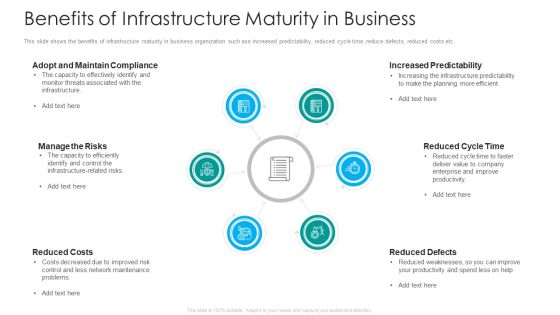
IT Facilities Maturity Framework For Strong Business Financial Position Benefits Of Infrastructure Maturity In Business Download PDF
This slide shows the benefits of infrastructure maturity in business organization such ass increased predictability, reduced cycle time, reduce defects, reduced costs etc. This is a it facilities maturity framework for strong business financial position benefits of infrastructure maturity in business download pdf template with various stages. Focus and dispense information on six stages using this creative set, that comes with editable features. It contains large content boxes to add your information on topics like reduced costs, reduced defects, reduced cycle time. You can also showcase facts, figures, and other relevant content using this PPT layout. Grab it now.

IT Facilities Maturity Framework For Strong Business Financial Position Benefits Of Transformation To The Business Introduction PDF
This slide shows the various benefits related to the transformation of infrastructure such as asset utilization, lower operating costs, lower capital costs, faster service delivery, etc. Presenting it facilities maturity framework for strong business financial position benefits of transformation to the business introduction pdf to provide visual cues and insights. Share and navigate important information on seven stages that need your due attention. This template can be used to pitch topics like asset utilization, lower operating costs, faster service delivery, more value for the customer. In addtion, this PPT design contains high resolution images, graphics, etc, that are easily editable and available for immediate download.

IT Facilities Maturity Framework For Strong Business Financial Position Specific Areas For Practice For Infrastructure Maturity Inspiration PDF
This slide depicts the specific areas for practice while considering infrastructure maturity such as build management and continuous integration, data management, environment and deployment, etc. Presenting it facilities maturity framework for strong business financial position specific areas for practice for infrastructure maturity inspiration pdf to provide visual cues and insights. Share and navigate important information on eight stages that need your due attention. This template can be used to pitch topics like configuration management, data management, testing, release management, environments and deployment. In addtion, this PPT design contains high resolution images, graphics, etc, that are easily editable and available for immediate download.
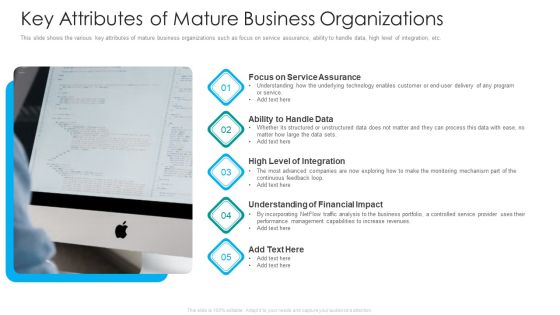
IT Facilities Maturity Framework For Strong Business Financial Position Key Attributes Of Mature Business Organizations Diagrams PDF
This slide shows the various key attributes of mature business organizations such as focus on service assurance, ability to handle data, high level of integration, etc. This is a it facilities maturity framework for strong business financial position key attributes of mature business organizations diagrams pdf template with various stages. Focus and dispense information on five stages using this creative set, that comes with editable features. It contains large content boxes to add your information on topics like focus on service assurance, ability to handle data, high level of integration, understanding of financial impact. You can also showcase facts, figures, and other relevant content using this PPT layout. Grab it now.

Summary Of Cloud ERP System Framework Popular ERP Softwares That Can Be Implemented By The Company Brochure PDF
This slide provides information about the most popular and trending ERP system softwares that can be used by the company This is a Summary Of Cloud ERP System Framework Popular ERP Softwares That Can Be Implemented By The Company Brochure PDF template with various stages. Focus and dispense information on six stages using this creative set, that comes with editable features. It contains large content boxes to add your information on topics like Resources To Operations, Customer Management, Implementation Costs You can also showcase facts, figures, and other relevant content using this PPT layout. Grab it now.
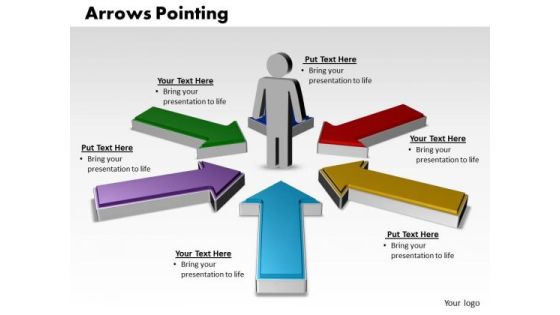
Business Charts PowerPoint Templates Arrows Pointing Inwards With Circular Direction Editable Sales
Business Charts PowerPoint templates arrows pointing inwards with circular direction editable Sales-This PowerPoint Diagram shows the five different colored Arrows pointing towards the man .It imitates the conceptualization of Success, Business, Marketing, Finance, Insurance etc.

3d Illustration Of Business Success Chart With Arrow PowerPoint Templates And PowerPoint Themes 0912
3d Illustration Of Business Success Chart with Arrow PowerPoint Templates And PowerPoint Themes 0912-Microsoft Powerpoint Templates and Background with business success with arrow-Business success with arrow, finance, marketing, success, arrows, business
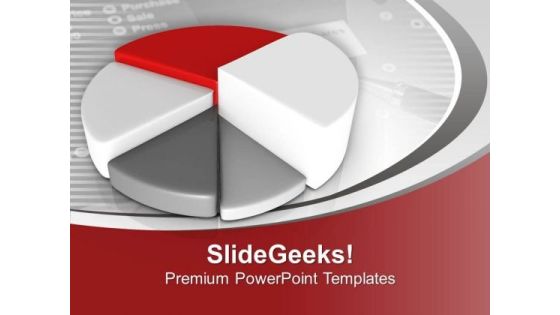
Pie Chart For Financial Growth PowerPoint Templates Ppt Backgrounds For Slides 0513
Timeline Crunches Are A Fact Of Life. Meet All Deadlines Using Our pie charts Power Point Templates. Connect The Dots Using Our marketing Power Point Templates. Fan Expectations As The Whole Picture Emerges.
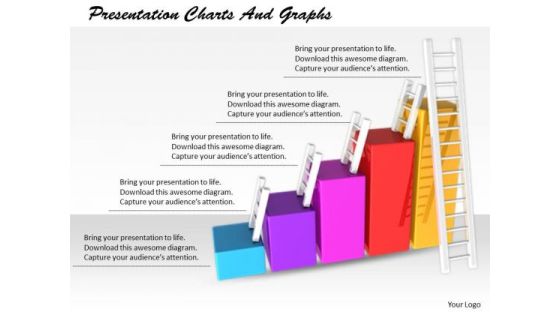
Stock Photo Innovative Marketing Concepts Presentation Charts And Graphs Business Clipart
Put In A Dollop Of Our stock photo innovative marketing concepts presentation charts and graphs business clipart Powerpoint Templates. Give Your Thoughts A Distinctive Flavor. Create Your Domain With Our Success Powerpoint Templates. Rule Minds With Your Thoughts.
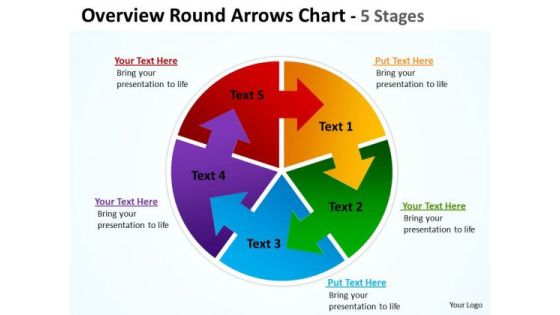
Marketing Diagram Overview Round Diagram Colorful Arrows Chart 5 Stages Consulting Diagram
Our Marketing Diagram Overview Round Diagram Colorful Arrows Chart 5 Stages Consulting Diagram Powerpoint Templates Team Are A Dogged Lot. They Keep At It Till They Get It Right.
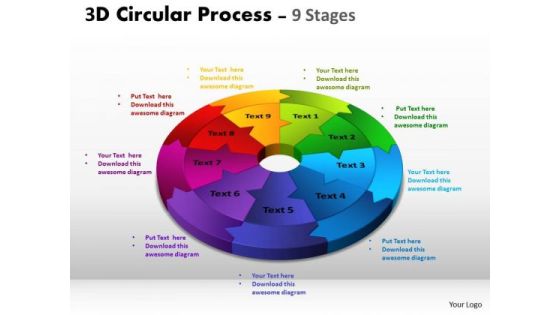
Consulting Diagram 3d Circular Process Cycle Diagram Chart 9 Stages Business Diagram
Our Consulting Diagram 3D Circular Process Cycle Diagram Chart 9 Stages Business Diagram Powerpoint Templates Team Are A Dogged Lot. They Keep At It Till They Get It Right.

Consulting Diagram 3d Circular Process Cycle Diagram Chart 10 Stages Design 2 Business Diagram
Get The Domestics Right With Our Consulting Diagram 3d Circular Process Cycle Diagram Chart 10 Stages Design 2 Business Diagram Powerpoint Templates. Create The Base For Thoughts To Grow.

Consulting Diagram 3d Circular Process Cycle Diagram Chart 11 Stages Business Diagram
Our Consulting Diagram 3d Circular Process Cycle Diagram Chart 11 Stages Business Diagram Powerpoint Templates Team Are A Dogged Lot. They Keep At It Till They Get It Right.

Stock Photo Black Brown Pie Chart For Business Result PowerPoint Slide
This high quality image is designed with pie chart. Use this image to make business reports. Use this outstanding image in presentations relating to data analysis and reports. Go ahead and add charm to your presentations.
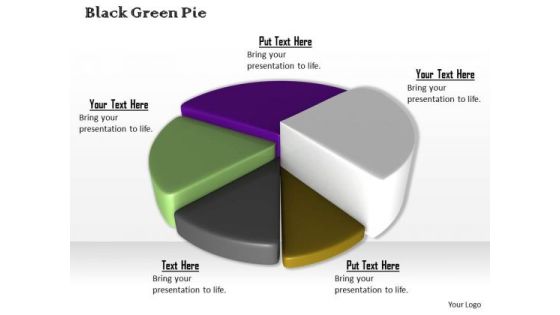
Stock Photo Colorful 3d Pie Chart For Business Result PowerPoint Slide
This high quality image is designed with pie chart. Use this image to make business reports. Use this outstanding image in presentations relating to data analysis and reports. Go ahead and add charm to your presentations.

Business Diagram Colored 3d Flow Chart For Data Processing Presentation Template
Colored 3d flow chart has been used to design this power point template. This PPT contains the concept of data processing. Use this PPT for your data communication and analysis related presentations.
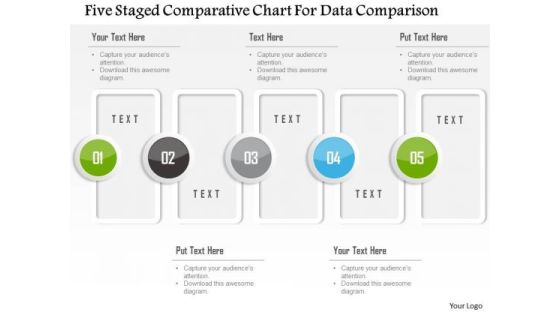
Business Diagram Five Staged Comparative Chart For Data Comparison Presentation Template
Five staged comparative chart has been used to design this power point template. This PPT contains the concept of data comparison. Use this PPT for your business and finance based data comparison in any financial presentation.
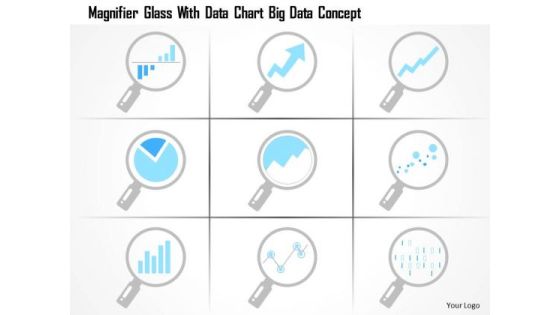
Business Diagram Magnifier Glass With Data Chart Big Data Concept Ppt Slide
This technology diagram has been designed with graphic of magnifier glass and big data chart. This diagram slide depicts the concept of data search. Use this diagram for your data search and focus related topics.

Business Diagram Four Colorful Pie Charts For Data Representation Presentation Template
This diagram is designed with four colorful pie charts. Download this diagram to analyze the key points. This diagram offers a way for your audience to visually conceptualize the process.
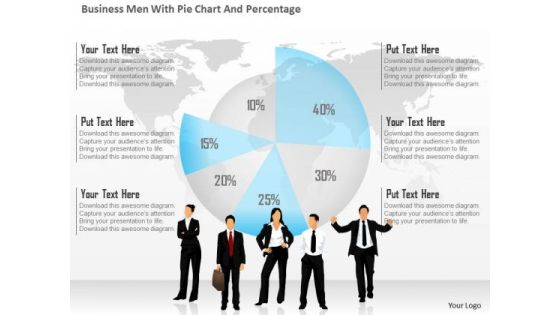
Business Diagram Business Men With Pie Chart And Percentage Presentation Template
This business diagram has been designed with graphic of business people and pie chart with percentage. This diagram is designed to depict team meeting on financial matter. This diagram offers a way for your audience to visually conceptualize the process.
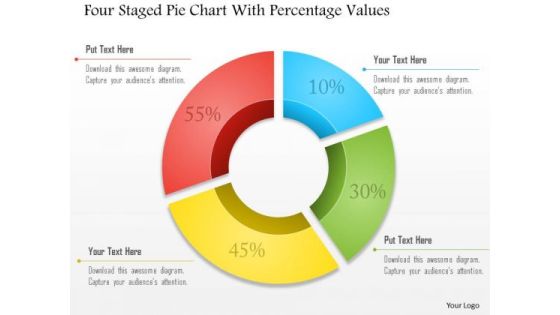
Business Diagram Four Staged Pie Chart With Percentage Values Presentation Template
Four staged pie chart and percentage values are used to design this business slide. Download this diagram to make business and financial reports. Use our above diagram to express information in a visual way.

Business Diagram Three Different Pie Charts For Result Analysis Presentation Template
Three different pie charts are used to designed this power point template slide. This PPT slide contains the concept of result analysis. Use this PPT slide for your data and process related presentations.
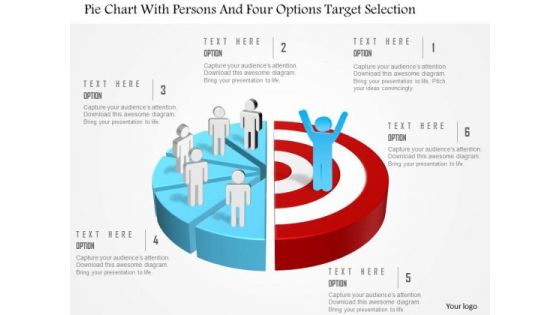
Business Diagram Pie Chart With Persons And Four Options Target Selection Presentation Template
This power point template slide has been crafted with graphic of pie chart ,persons and four options. This PPT contains the concept of option representation for targets selection. This PPT diagram is can be used business and sales presentations.
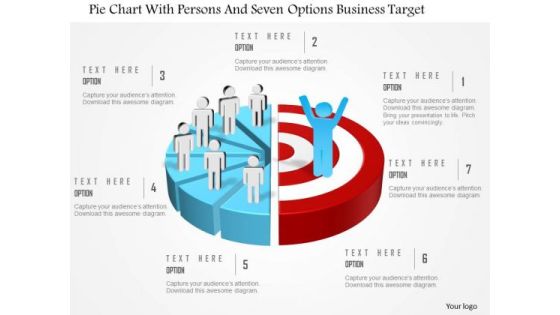
Business Diagram Pie Chart With Persons And Seven Options Business Target Presentation Template
This power point template slide has been crafted with graphic of pie chart ,persons and seven options. This PPT contains the concept of option representation for business targets. This PPT diagram is can be used business and marketing presentations.

Business Diagram Pie Chart With Persons And Three Options Marketing Targets Presentation Template
This power point template slide has been crafted with graphic of pie chart and three persons. This PPT contains the concept of option representation for marketing targets. This PPT diagram is suitable for marketing presentations.
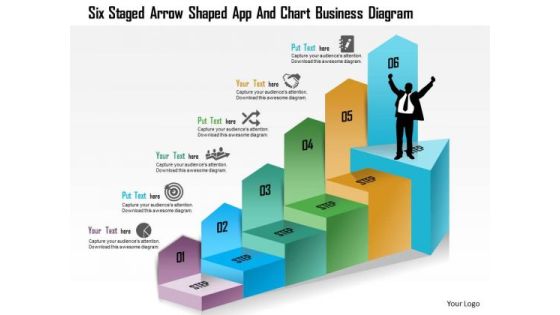
Business Diagram Six Staged Arrow Shaped App And Chart Business Diagram Presentation Template
Six staged arrow shaped aap and chart has been used to decorate this power point template. This PPT contains the concept of text representation. This PPT can be used for business and technology related topics in any presentation.
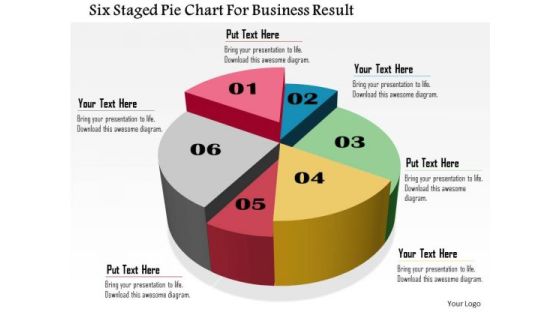
Business Daigram Six Staged Pie Chart For Business Result Presentation Templets
Six staged pie chart is used to design this business slide. Download this diagram to make business and financial reports. Use our above diagram to express information in a visual way.
Business Diagram Pie Chart With Icons For Result Analysis Presentation Template
This business slide contains graphics of pie chart with business icons. Download this impressive diagram to present marketing performance measurement. This image slide is best to present your newer thoughts.
Business Diagram Pie Chart With Icons For Financial Analysis Presentation Template
This professional business diagram slide has been designed with pie chart and icons. It contains concept of financial analysis. Use this slide to build exclusive presentations for your viewers.

Business Diagram Pie Chart In Shape Of Lock For Trading Costs Presentation Template
This slide has been designed with pie chart in shape of lock. This diagram contains the concept of trading costs, finance and marketing. Use this slide for your business related presentations.

Linear Flow Chart Of Channel Marketing Flow For Consumer Diagram Powerpoint Slides Design Templates
This is a linear flow chart of channel marketing flow for consumer diagram powerpoint slides design templates. This is a five stage process. The stages in this process are manufacture, distributor, wholesaler, retailer, consumer.

Supply Chain Web With E Commerce Retail Trade Chart Ppt Example
This is a supply chain web with e commerce retail trade chart ppt example. This is a five stage process. The stages in this process are imports, manufacturing, wholesale, retail, consumer.
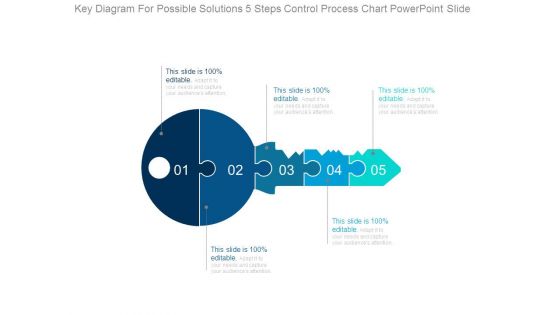
Key Diagram For Possible Solutions 5 Steps Control Process Chart Powerpoint Slide
This is a key diagram for possible solutions 5 steps control process chart powerpoint slide. This is a five stage process. The stages in this process are puzzles, business, problem, solution, game pieces, key.

Customer Service Benchmarking Chart Ppt PowerPoint Presentation Infographic Template Graphics Tutorials
This is a customer service benchmarking chart ppt powerpoint presentation infographic template graphics tutorials. This is a eight stage process. The stages in this process are category, business, marketing, management.
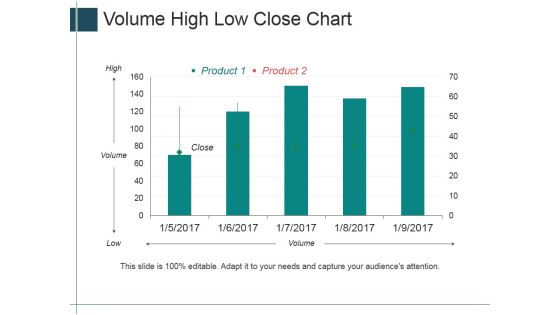
Volume High Low Close Chart Ppt PowerPoint Presentation Summary Layout Ideas
This is a volume high low close chart ppt powerpoint presentation summary layout ideas. This is a five stage process. The stages in this process are high, volume, low, close, product.

Competitive Analysis Template 6 Scatter Chart Ppt PowerPoint Presentation Icon Example Topics
This is a competitive analysis template 6 scatter chart ppt powerpoint presentation icon example topics. This is a eight stage process. The stages in this process are users interface, data import, example, pricing, support, update, tutorials, easy to use.
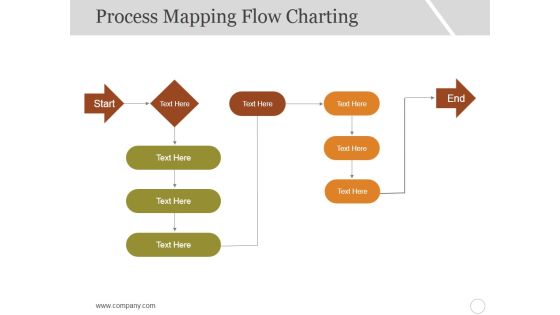
Process Mapping Flow Charting Ppt PowerPoint Presentation Infographic Template Graphics Pictures
This is a process mapping flow charting ppt powerpoint presentation infographic template graphics pictures. This is a five stage process. The stages in this process are start, end, business, marketing, management.

High Low Close Chart Template 1 Ppt PowerPoint Presentation Infographics Graphics Design
This is a high low close chart template 1 ppt powerpoint presentation infographics graphics design. This is a five stage process. The stages in this process are close, high, volume, low, open, product.

Volume Open High Low Close Chart Ppt PowerPoint Presentation Infographics Guide
This is a volume open high low close chart ppt powerpoint presentation infographics guide. This is a two stage process. The stages in this process are close, high, volume, low, open, product.

Project Management Gantt Chart Template 2 Ppt PowerPoint Presentation Pictures Outfit
This is a project management gantt chart template 2 ppt powerpoint presentation pictures outfit. This is a three stage process. The stages in this process are start, duration, task, complete, sub task.
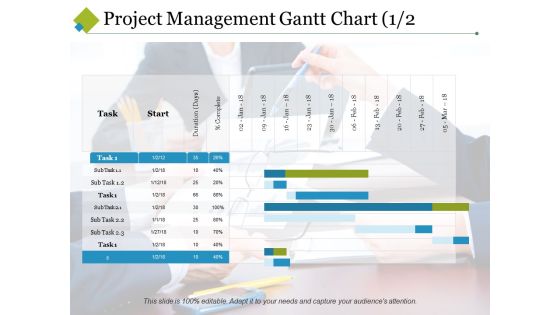
Project Management Gantt Chart Template 1 Ppt PowerPoint Presentation Visual Aids Summary
This is a project management gantt chart template 1 ppt powerpoint presentation visual aids summary. This is a two stage process. The stages in this process are start, task, sub task, duration, complete.
Volume Open High Low Close Chart Ppt PowerPoint Presentation Icon Design Inspiration
This is a volume open high low close chart ppt powerpoint presentation icon design inspiration. This is a three stage process. The stages in this process are close, high, low, volume, open.

Bar Chart For Business Performance Evaluation Ppt PowerPoint Presentation Infographics Professional
This is a bar chart for business performance evaluation ppt powerpoint presentation infographics professional. This is a five stage process. The stages in this process are metrics icon, kpis icon, statistics icon.

Chart With Magnifying Glass For Business Research Ppt PowerPoint Presentation Inspiration Shapes
This is a chart with magnifying glass for business research ppt powerpoint presentation inspiration shapes. This is a two stage process. The stages in this process are metrics icon, kpis icon, statistics icon.
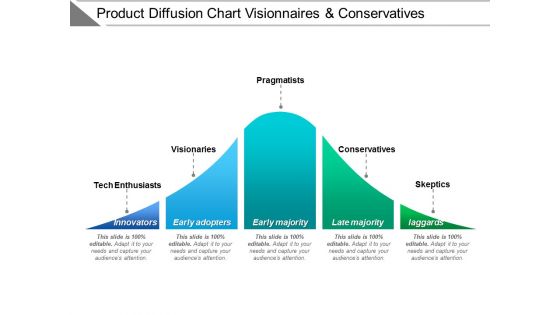
Product Diffusion Chart Visionaries And Conservatives Ppt PowerPoint Presentation Model Clipart
This is a product diffusion chart visionaries and conservatives ppt powerpoint presentation model clipart. This is a five stage process. The stages in this process are adoption curve, crossing the chasm, hype cycle.

Scatter Bubble Chart Highest Sale Ppt PowerPoint Presentation Show Slide Download
This is a scatter bubble chart highest sale ppt powerpoint presentation show slide download. This is a two stage process. The stages in this process are finance, investment, analysis, business, marketing.

Open High Low Close Chart Ppt PowerPoint Presentation Slides File Formats
This is a open high low close chart ppt powerpoint presentation slides file formats. This is a five stage process. The stages in this process are open, high, low, close, finance.

Company Competitors Analysis Chart Market Share And Return On Equity Ppt PowerPoint Presentation Picture
This is a company competitors analysis chart market share and return on equity ppt powerpoint presentation picture. This is a seven stage process. The stages in this process are competitive analysis, benchmark competition, competition landscape.

Volume Open High Low Close Chart Ppt PowerPoint Presentation Professional Maker
This is a volume open high low close chart ppt powerpoint presentation professional maker. This is a two stage process. The stages in this process are percentage, product, marketing.

Pie Chart With Dollar Symbol Ppt PowerPoint Presentation Infographic Template Graphics Design
This is a pie chart with dollar symbol ppt powerpoint presentation infographic template graphics design. This is a two stage process. The stages in this process are sectioned circle, segmented circle, partitioned circle.
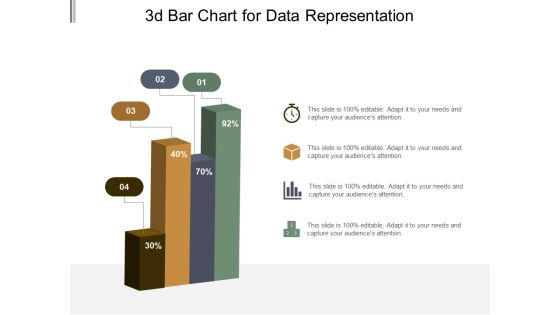
3D Bar Chart For Data Representation Ppt PowerPoint Presentation Model Graphic Tips
This is a 3d bar chart for data representation ppt powerpoint presentation model graphic tips. This is a four stage process. The stages in this process are art, colouring, paint brush.

3D Bar Chart For Percentage Values Comparison Ppt PowerPoint Presentation Professional Visual Aids
This is a 3d bar chart for percentage values comparison ppt powerpoint presentation professional visual aids. This is a five stage process. The stages in this process are art, colouring, paint brush.

3D Bar Chart For Technical Analysis Ppt PowerPoint Presentation Summary Visuals
This is a 3d bar chart for technical analysis ppt powerpoint presentation summary visuals. This is a five stage process. The stages in this process are art, colouring, paint brush.

3D Bar Chart To Display Data Ppt PowerPoint Presentation Icon Design Inspiration
This is a 3d bar chart to display data ppt powerpoint presentation icon design inspiration. This is a four stage process. The stages in this process are art, colouring, paint brush.

3D Chart For Graphical Display Of Data Ppt PowerPoint Presentation Styles Icon
This is a 3d chart for graphical display of data ppt powerpoint presentation styles icon. This is a four stage process. The stages in this process are art, colouring, paint brush.

3D Charts For Comparing Amounts And Volume Ppt PowerPoint Presentation Show Deck
This is a 3d charts for comparing amounts and volume ppt powerpoint presentation show deck. This is a five stage process. The stages in this process are art, colouring, paint brush.
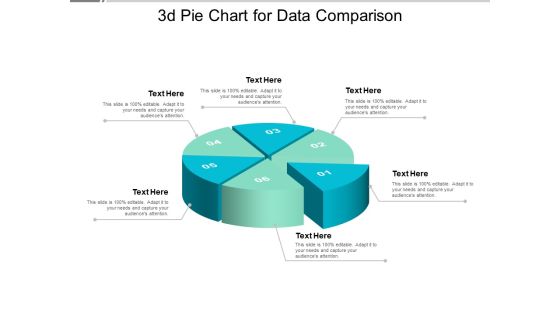
3D Pie Chart For Data Comparison Ppt PowerPoint Presentation Model Design Ideas
This is a 3d pie chart for data comparison ppt powerpoint presentation model design ideas. This is a six stage process. The stages in this process are art, colouring, paint brush.
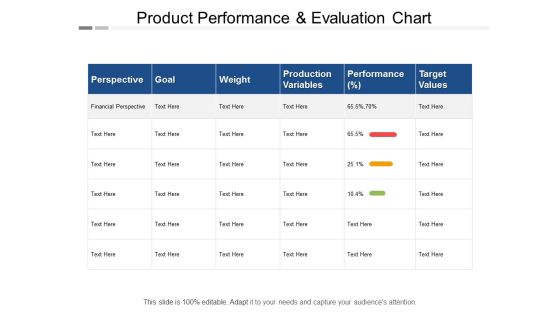
Product Performance And Evaluation Chart Ppt PowerPoint Presentation Pictures Slide Download
This is a product performance and evaluation chart ppt powerpoint presentation pictures slide download. This is a sex stage process. The stages in this process are production management, production performance, production improvement.

Bar Charts For Business Performance Analysis Ppt PowerPoint Presentation Show Slideshow
This is a bar charts for business performance analysis ppt powerpoint presentation show slideshow. This is a two stage process. The stages in this process are compare, comparison of two, competitive analysis.

Career Progression And Growth Chart Ppt PowerPoint Presentation Professional Design Inspiration
This is a career progression and growth chart ppt powerpoint presentation professional design inspiration. This is a three stage process. The stages in this process are career progression, career aspiration, career promotion powerpoint presentation slides.
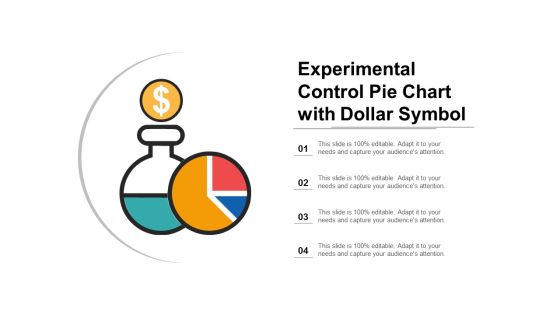
Experimental Control Pie Chart With Dollar Symbol Ppt Powerpoint Presentation Infographics Background Images
This is a experimental control pie chart with dollar symbol ppt powerpoint presentation infographics background images. This is a four stage process. The stages in this process are exploratory, experimental, investigational.

Data Comparison And Analysis Chart Ppt Powerpoint Presentation File Background Images
This is a data comparison and analysis chart ppt powerpoint presentation file background images. This is a four stage process. The stages in this process are data presentation, content presentation, information presentation.

Cost Reduction Analysis Bar Chart Ppt Powerpoint Presentation File Graphics Design
This is a cost reduction analysis bar chart ppt powerpoint presentation file graphics design. This is a five stage process. The stages in this process are data analysis, data science, information science.

Computer Screen With Pie Chart For Data Analysis Ppt PowerPoint Presentation Show Picture
This is a computer screen with pie chart for data analysis ppt powerpoint presentation show picture. This is a six stage process. The stages in this process are computer icon, desktop icon, laptop screen icon.

Business Performance Evaluation And Feedback Flow Chart Ppt Powerpoint Presentation Model Example Topics
This is a business performance evaluation and feedback flow chart ppt powerpoint presentation model example topics. This is a three stage process. The stages in this process are performance management, structure conduct performance, performance review and analysis.
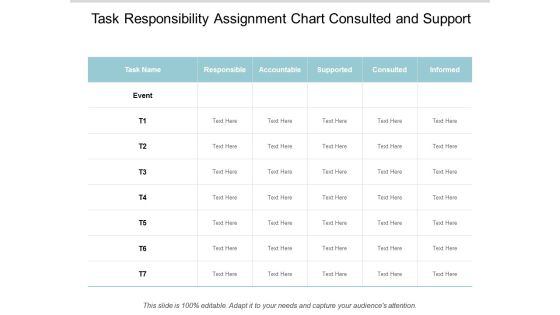
Task Responsibility Assignment Chart Consulted And Support Ppt Powerpoint Presentation Styles Background
This is a task responsibility assignment chart consulted and support ppt powerpoint presentation styles background. This is a seven stage process. The stages in this process are authority matrix, responsibility matrix, leadership matrix.

Pie Chart For Data Presentation Vector Ppt Powerpoint Presentation Summary Display
This is a pie chart for data presentation vector ppt powerpoint presentation summary display. This is a three stage process. The stages in this process are data visualization icon, data management icon.

Pie Of Pie Chart Finance Ppt Powerpoint Presentation File Design Templates
This is a pie of pie chart finance ppt powerpoint presentation file design templates. This is a four stage process. The stages in this process are finance, marketing, management, investment, analysis.

Employee Time Management Evaluation Chart Ppt PowerPoint Presentation File Graphic Images
This is a employee time management evaluation chart ppt powerpoint presentation file graphic images. This is a two stage process. The stages in this process are compare, business, management, marketing.

Bar Chart With Magnifying Glass For Financial Analysis Ppt Powerpoint Presentation Infographics Designs Download
This is a bar chart with magnifying glass for financial analysis ppt powerpoint presentation infographics designs download. This is a three stage process. The stages in this process are business metrics, business kpi, business dashboard.

Business Analysis Data Charts And Reports Ppt Powerpoint Presentation Ideas Portrait
This is a business analysis data charts and reports ppt powerpoint presentation ideas portrait. This is a three stage process. The stages in this process are business metrics, business kpi, business dashboard.

Computer Screen With Business Data Charts Ppt Powerpoint Presentation Show Vector
This is a computer screen with business data charts ppt powerpoint presentation show vector. This is a four stage process. The stages in this process are business metrics, business kpi, business dashboard.

Data Statistics Charts And Key Performance Indicators Ppt Powerpoint Presentation Layouts Guide
This is a data statistics charts and key performance indicators ppt powerpoint presentation layouts guide. This is a four stage process. The stages in this process are business metrics, business kpi, business dashboard.

Financial Charts And Graphs For Statistical Analysis Ppt Powerpoint Presentation Show Layout
This is a financial charts and graphs for statistical analysis ppt powerpoint presentation show layout. This is a four stage process. The stages in this process are business metrics, business kpi, business dashboard.
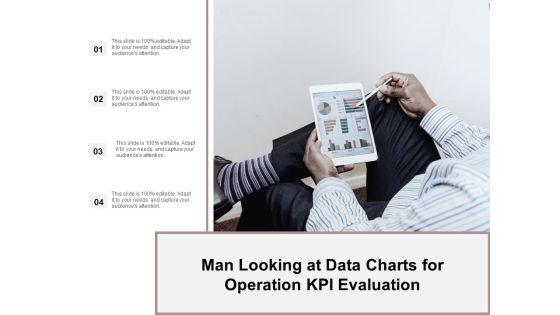
Man Looking At Data Charts For Operation Kpi Evaluation Ppt Powerpoint Presentation Ideas Demonstration
This is a man looking at data charts for operation kpi evaluation ppt powerpoint presentation ideas demonstration. This is a four stage process. The stages in this process are business metrics, business kpi, business dashboard.
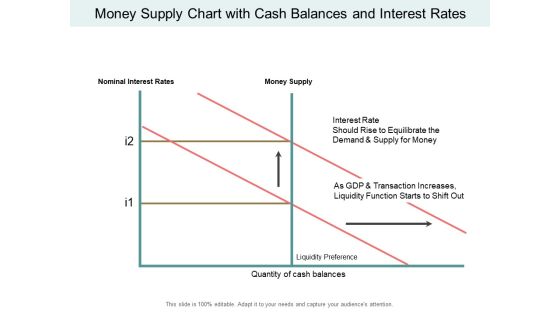
Money Supply Chart With Cash Balances And Interest Rates Ppt PowerPoint Presentation Inspiration Background Images
This is a money supply chart with cash balances and interest rates ppt powerpoint presentation inspiration background images. This is a two stage process. The stages in this process are liquidity, cash assets, solvency.

Thank You Consumer Service Process Flow Chart Ppt Powerpoint Presentation Gallery Outfit
This is a thank you consumer service process flow chart ppt powerpoint presentation gallery outfit. This is a one stage process. The stages in this process are thank you.

Pie Chart To Survey Business Outcomes Ppt Powerpoint Presentation Infographic Template Gridlines
This is a pie chart to survey business outcomes ppt powerpoint presentation infographic template gridlines. This is a seven stage process. The stages in this process are business outcomes, business results, business output.

Donut Chart Finance Marketing Ppt Powerpoint Presentation Infographics Skills Ppt Powerpoint Presentation File Skills
This is a donut chart finance marketing ppt powerpoint presentation infographics skills ppt powerpoint presentation file skills. This is a four stage process. The stages in this process are finance, marketing, management, investment, analysis.

Product Backlog Process Flow Chart Ppt PowerPoint Presentation Model Design Templates
This is a product backlog process flow chart ppt powerpoint presentation model design templates. This is a two stage process. The stages in this process are backlog, uncompleted work, pending work.
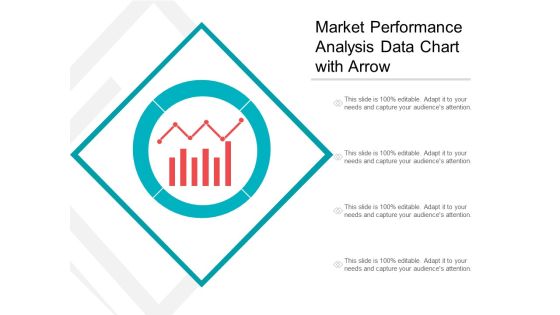
Market Performance Analysis Data Chart With Arrow Ppt PowerPoint Presentation Inspiration Graphics
This is a market performance analysis data chart with arrow ppt powerpoint presentation inspiration graphics. This is a four stage process. The stages in this process are marketing analytics, marketing performance, marketing discovery.
Marketing Campaign Development Process Ppt PowerPoint Presentation Diagram Graph Charts Cpb
This is a marketing campaign development process ppt powerpoint presentation diagram graph charts cpb. This is a four stage process. The stages in this process are marketing campaign development process.
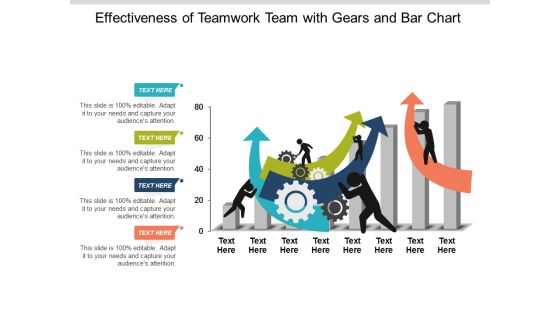
Effectiveness Of Teamwork Team With Gears And Bar Chart Ppt Powerpoint Presentation Ideas Information
This is a effectiveness of teamwork team with gears and bar chart ppt powerpoint presentation ideas information. This is a four stage process. The stages in this process are team performance, member performance, group performance.
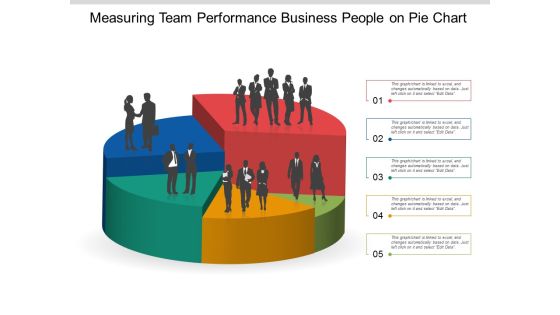
Measuring Team Performance Business People On Pie Chart Ppt Powerpoint Presentation Gallery Smartart
This is a measuring team performance business people on pie chart ppt powerpoint presentation gallery smartart. This is a five stage process. The stages in this process are team performance, member performance, group performance.
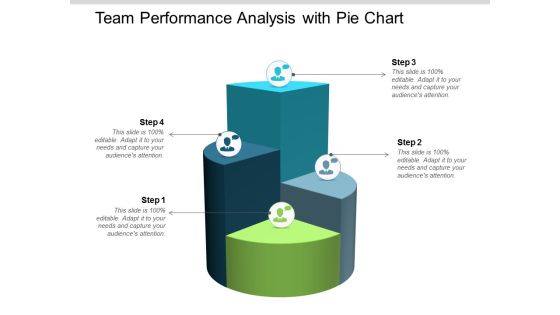
Team Performance Analysis With Pie Chart Ppt Powerpoint Presentation Infographic Template Slideshow
This is a team performance analysis with pie chart ppt powerpoint presentation infographic template slideshow. This is a four stage process. The stages in this process are team performance, member performance, group performance.
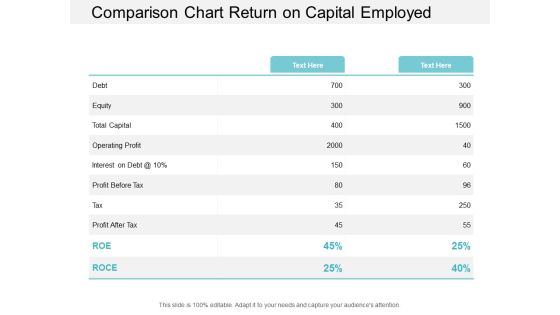
Comparison Chart Return On Capital Employed Ppt PowerPoint Presentation Portfolio Templates
This is a comparison chart return on capital employed ppt powerpoint presentation portfolio templates. This is a two stage process. The stages in this process are accounting ratio, roce, return on capital employed.
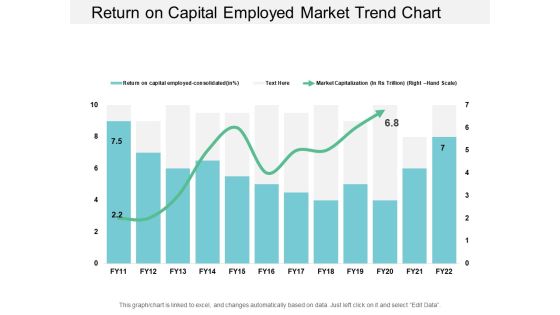
Return On Capital Employed Market Trend Chart Ppt PowerPoint Presentation Styles Examples
This is a return on capital employed market trend chart ppt powerpoint presentation styles examples. This is a two stage process. The stages in this process are accounting ratio, roce, return on capital employed.

Return On Capital Employed Product Performance Chart Ppt PowerPoint Presentation Portfolio Visuals
This is a return on capital employed product performance chart ppt powerpoint presentation portfolio visuals. This is a three stage process. The stages in this process are accounting ratio, roce, return on capital employed.
Risk Assessment Chart Report Vector Icon Ppt PowerPoint Presentation Ideas Deck
This is a risk assessment chart report vector icon ppt powerpoint presentation ideas deck. This is a four stage process. The stages in this process are risk management, governance icon, compliance icon.

Gantt Chart For Project Management And Process Mapping Ppt PowerPoint Presentation Model Styles
This is a gantt chart for project management and process mapping ppt powerpoint presentation model styles. This is a four stage process. The stages in this process are swim lane diagram, flowchart, management.

Project Management Swim Lane Flow Chart Ppt PowerPoint Presentation Pictures Brochure
This is a project management swim lane flow chart ppt powerpoint presentation pictures brochure. This is a four stage process. The stages in this process are swim lane diagram, flowchart, management.
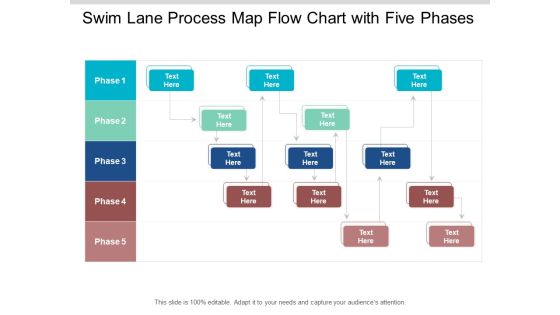
Swim Lane Process Map Flow Chart With Five Phases Ppt PowerPoint Presentation Layouts Example
This is a swim lane process map flow chart with five phases ppt powerpoint presentation layouts example. This is a five stage process. The stages in this process are swim lane diagram, flowchart, management.

Donut Pie Chart Marketing Ppt Powerpoint Presentation Infographic Template Graphics Template
This is a donut pie chart marketing ppt powerpoint presentation infographic template graphics template. This is a six stage process. The stages in this process are finance, marketing, management, investment, analysis.
Percentage Value Comparison Pie Chart Icon Ppt PowerPoint Presentation Model Clipart Images
This is a percentage value comparison pie chart icon ppt powerpoint presentation model clipart images. This is a three stage process. The stages in this process are percentage icon, dividend icon, portion icon.

Timeline For Application Development Design Implement And Release Ppt PowerPoint Presentation Diagram Graph Charts
This is a timeline for application development design implement and release ppt powerpoint presentation diagram graph charts. This is a five stage process. The stages in this process are overlapping timeline, overlapping roadmap, overlapping linear roadmap.

Thank You Customer Service Process Flow Chart Ppt PowerPoint Presentation Slides Ideas
This is a thank you customer service process flow chart ppt powerpoint presentation slides ideas. This is a one stage process. The stages in this process are thank you, greeting, word.

Customer Service Process Flow Chart Ppt PowerPoint Presentation Complete Deck With Slides
This is a customer service process flow chart ppt powerpoint presentation complete deck with slides. This is a one stage process. The stages in this process are business, management, marketing.
Workload Management Chart With Employee Name And Activity Ppt PowerPoint Presentation Icon
This is a workload management chart with employee name and activity ppt powerpoint presentation icon. This is a eight stage process. The stages in this process are activity tracker, business, marketing.
Product Features Comparison Chart With Icons Ppt Powerpoint Presentation Portfolio Diagrams
This is a product features comparison chart with icons ppt powerpoint presentation portfolio diagrams. This is a four stage process. The stages in this process are product differentiation, product comparison, brand differentiation.

Two Products Features And Performance Comparison Chart Ppt Powerpoint Presentation Ideas Layout Ideas
This is a two products features and performance comparison chart ppt powerpoint presentation ideas layout ideas. This is a two stage process. The stages in this process are product differentiation, product comparison, brand differentiation.
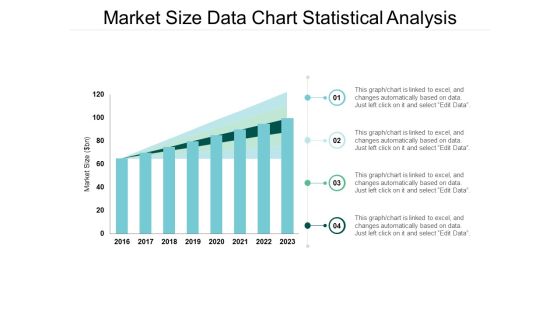
Market Size Data Chart Statistical Analysis Ppt Powerpoint Presentation Model Format
This is a market size data chart statistical analysis ppt powerpoint presentation model format. The topics discussed in this diagram are market growth, market opportunity, market profitability. This is a completely editable PowerPoint presentation, and is available for immediate download.
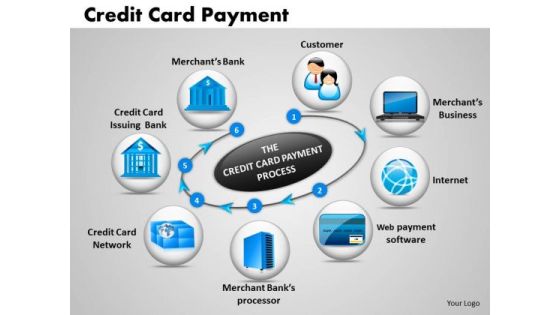
Business Circle Charts PowerPoint Templates Business Credit Card Payment Ppt Slides
Business Circle Charts PowerPoint Templates Business Credit Card Payment PPT Slides-This PowerPoint diagram shows Circles representing related points in an idea. You can also use it as credit card payment slide-Business Circle Charts PowerPoint Templates Business Credit Card Payment PPT Slides-This template can be used for presentations relating to Account, Bank, Business, Buy, Buying, Cards, Cash, Chips, Close-Up, Commerce, Credit, Credits, Date, Ecommerce, Expiration, Expire, Expired, Finance, Financial, Gold, Limit, Macro, Master, Money, Now, Online, Order, Paid, Pay, Paying, Payment
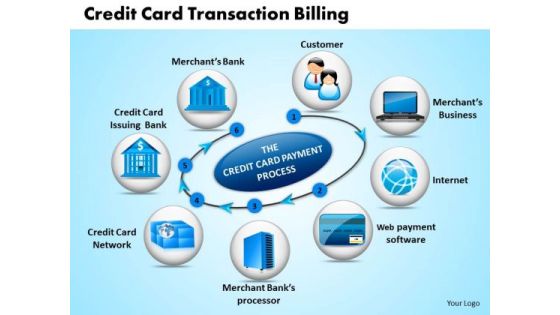
Business Circle Charts PowerPoint Templates Business Credit Card Transaction Billing Ppt Slides
Business Circle Charts PowerPoint Templates Business credit card transaction billing PPT Slides-This PowerPoint diagram shows Circles representing related points in an idea. You can also use it as credit card transaction slide-Business Circle Charts PowerPoint Templates Business credit card transaction billing PPT Slides-This template can be used for presentations relating to Account, Bank, Business, Buy, Buying, Cards, Cash, Chips, Close-Up, Commerce, Credit, Credits, Date, Ecommerce, Expiration, Expire, Expired, Finance, Financial, Gold, Limit, Macro, Master, Money, Now, Online, Order, Paid, Pay, Paying, Payment

Business Circle Charts PowerPoint Templates Business Periodic Table Of Elements Ppt Slides
Business Circle Charts PowerPoint Templates Business periodic table of elements PPT Slides-Use this graphic to represent a continuing sequence of stages, tasks, or events in a circular flow and emphasize the connection between all components. -Business Circle Charts PowerPoint Templates Business periodic table of elements PPT Slides-This template can be used for presentations relating to Actinoids, Atom, Atomic, Chemistry, Electrons, Element, Helium, Hydrogen, Lanthanoids, Liquid, Molecule, Noble, Periodic, Physics, Plutonium, Quantum, Radium, Science, Scientific, Solid, Symbol, Table
Business Chart PowerPoint Templates Business Creative Labels Or Text Boxes Ppt Slides
Business Chart PowerPoint Templates Business creative labels or text boxes PPT Slides-This PowerPoint text boxes diagram template is designed to help you place your text in a professional layout. Thus an excellent graphic to attract the attention of and understanding by your audience.-Business Chart PowerPoint Templates Business creative labels or text boxes PPT Slides-This ppt can be used for concepts relating to- textboxes PowerPoint, text boxes presentation and PowerPoint text.
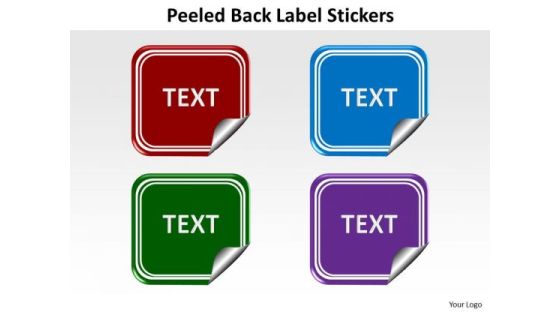
Business Chart PowerPoint Templates Business Peeled Back Label Stickers Ppt Slides
Business Chart PowerPoint Templates Business peeled back label stickers PPt Slides-This PowerPoint text boxes diagram template is designed to help you place your text in a professional layout. Thus an excellent graphic to attract the attention of and understanding by your audience. Business Chart PowerPoint Templates Business peeled back label stickers PPt Slides-This ppt can be used for concepts relating to- textboxes PowerPoint, text boxes presentation and PowerPoint text.

Ppt Linear Flow Process Charts 3 Power Point Stage Style1 PowerPoint Templates
PPT linear flow process charts 3 power point stage style1 PowerPoint Templates-You can show various processes with these linear designed puzzle pieces. The separate pieces are in linear order. Arrow in the end can declare a process as concluded.-PPT linear flow process charts 3 power point stage style1 PowerPoint Templates-Amusement, Arrow, Board, Cardboard, Children, Deficient, Direction, Diversion, Entertainment, Game, Illustration, Image, Jigsaw, Logo, Lots, Many, Paper, Perspective, Pieces, Play, Puzzle, Vector

Market Development Matrix Chart Ppt PowerPoint Presentation Styles Example Introduction Cpb
Presenting this set of slides with name market development matrix chart ppt powerpoint presentation styles example introduction cpb. This is an editable Powerpoint five stages graphic that deals with topics like market development matrix chart to help convey your message better graphically. This product is a premium product available for immediate download and is 100 percent editable in Powerpoint. Download this now and use it in your presentations to impress your audience.

Cash Management Process Flow Chart Ppt PowerPoint Presentation Show Icons Cpb
Presenting this set of slides with name cash management process flow chart ppt powerpoint presentation show icons cpb. This is an editable Powerpoint three stages graphic that deals with topics like cash management process flow chart to help convey your message better graphically. This product is a premium product available for immediate download and is 100 percent editable in Powerpoint. Download this now and use it in your presentations to impress your audience.

Lead Generation Process Flow Chart Ppt PowerPoint Presentation Gallery Styles Cpb
Presenting this set of slides with name lead generation process flow chart ppt powerpoint presentation gallery styles cpb. This is an editable Powerpoint three stages graphic that deals with topics like lead generation process flow chart to help convey your message better graphically. This product is a premium product available for immediate download and is 100 percent editable in Powerpoint. Download this now and use it in your presentations to impress your audience.
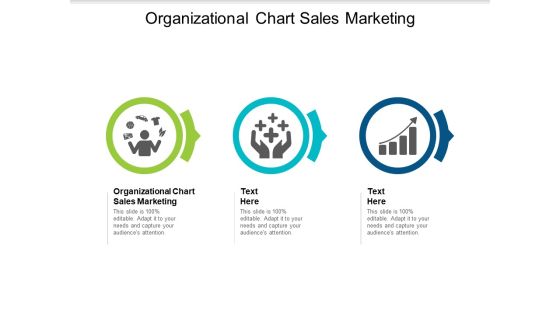
Organizational Chart Sales Marketing Ppt PowerPoint Presentation Infographic Template Microsoft Cpb
Presenting this set of slides with name organizational chart sales marketing ppt powerpoint presentation infographic template microsoft cpb. This is an editable Powerpoint three stages graphic that deals with topics like organizational chart sales marketing to help convey your message better graphically. This product is a premium product available for immediate download and is 100 percent editable in Powerpoint. Download this now and use it in your presentations to impress your audience.


 Continue with Email
 Sign up for an account
 Home
Home


