Plan

Brand Building Circle Chart Ppt Example
This is a brand building circle chart ppt example. This is a seven stage process. The stages in this process are long term perspective, positioning, quality, well blended communication, credibility, internal marketing, repositioning, brand building.

Market Research Data Collection Chart Presentation
This is a market research data collection chart presentation. This is a five stage process. The stages in this process are concept testing, customer satisfaction, pricing research, market segmentation, awareness usage.

Financial Investments Pie Chart Design Powerpoint Show
This is a financial investments pie chart design powerpoint show. This is a eight stage process. The stages in this process are stocks, real estate, mutual funds, precious metal, bonds, art, collectibles, antiques.

Organizational Management System Chart Powerpoint Guide
This is a organizational management system chart powerpoint guide. This is a four stage process. The stages in this process are governance, visibility, collaboration, flexibility, control, people, process, technology.

Gap Analysis Process Chart Powerpoint Slide Introduction
This is a gap analysis process chart powerpoint slide introduction. This is a four stage process. The stages in this process are bridging the gap, gap identification, future state needs and vision, current state assessment.
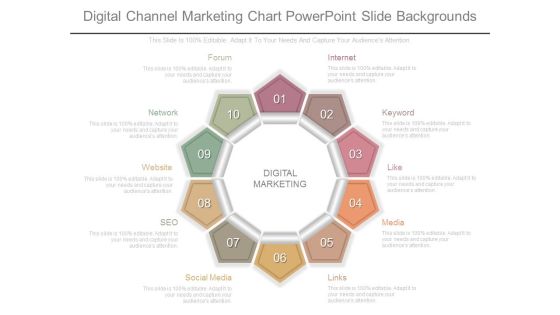
Digital Channel Marketing Chart Powerpoint Slide Backgrounds
This is a digital channel marketing chart powerpoint slide backgrounds. This is a ten stage process. The stages in this process are digital marketing, internet, keyword, like, media, links, social media, seo, website, network, forum.
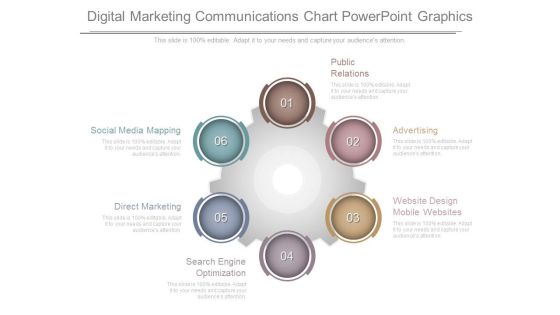
Digital Marketing Communications Chart Powerpoint Graphics
This is a digital marketing communications chart powerpoint graphics. This is a six stage process. The stages in this process are public relations, advertising, website design mobile websites, search engine optimization, direct marketing, social media mapping.

Consumer Purchase Process Flow Chart Powerpoint Ideas
This is a consumer purchase process flow chart powerpoint ideas. This is a five stage process. The stages in this process are information search, evaluation of options, purchase of decision, post purchase, problem or need recognition.

Customer Engagement Touch Points Chart Ppt Sample
This is a customer engagement touch points chart ppt sample. This is a seven stage process. The stages in this process are research, consider and evaluate, awareness, formal rfp, use and service, buy, loyalty repurchase.

Goal Chart Layout Example Of Ppt Presentation
This is a goal chart layout example of ppt presentation. This is a seven stage process. The stages in this process are clear description, how to measure, can i do it, level of effort, start end date, smart goal, research.

Ecommerce Order Fulfillment Process Chart Ppt Slides
This is a ecommerce order fulfillment process chart ppt slides. This is a three stage process. The stages in this process are completely meet demand, fulfill at minimal cost, deliver at promised time.

Customer Awareness Process Flow Chart Ppt Slides
This is a customer awareness process flow chart ppt slides. This is a eight stage process. The stages in this process are preference, loyalty, advertising, personal selling, awareness, purchase, public relations, direct marketing.

Business Telecommunication Process Flow Chart Powerpoint Slides
This is a business telecommunication process flow chart powerpoint slides. This is a eight stage process. The stages in this process are business opportunity, market analysis, new product development, costing and projection, product support, marketing, sales and distribution, product evaluation.
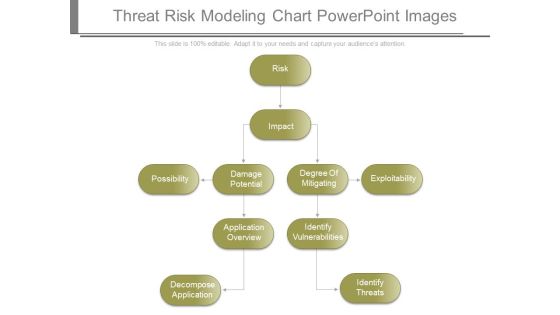
Threat Risk Modeling Chart Powerpoint Images
This is a threat risk modeling chart powerpoint images. This is a five stage process. The stages in this process are risk, impact, possibility, damage potential, degree of mitigating, exploitability, application overview, identify vulnerabilities, decompose application, identify threats.

Cycle Process Flow Chart Powerpoint Show
This is a cycle process flow chart powerpoint show. This is a six stage process. The stages in this process are sales and marketing, bidding process, requirements analysis, sale of good, production of goods, purchase of raw materials.
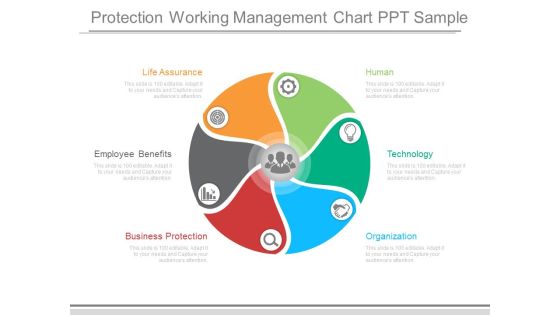
Protection Working Management Chart Ppt Sample
This is a protection working management chart ppt sample. This is a six stage process. The stages in this process are life assurance, employee benefits, business protection, human, technology, organization.

Management Information System Chart Powerpoint Slide Download
This is a management information system chart powerpoint slide download. This is a six stage process. The stages in this process are technology, generate order, check credit, people, ship product, sales.

Procurement Flow Chart Presentation Powerpoint Example
This is a procurement flow chart presentation powerpoint example. This is a four stage process. The stages in this process are procurement, epayments, order products and services, receive products.
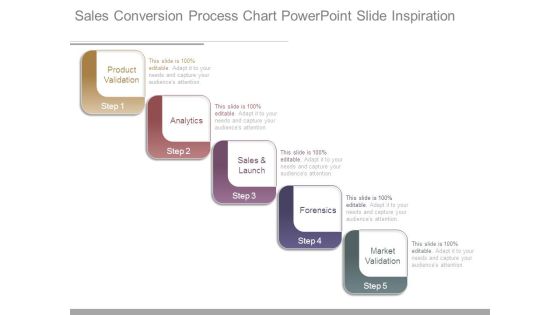
Sales Conversion Process Chart Powerpoint Slide Inspiration
This is a sales conversion process chart powerpoint slide inspiration. This is a five stage process. The stages in this process are product validation, analytics, sales and launch, forensics, market validation.

Consumer Buying Decision Process Chart Powerpoint Show
This is a consumer buying decision process chart powerpoint show. This is a six stage process. The stages in this process are purchase decision, information search, post purchase behavior, need recognition, brand beliefs, degree of importance.

Conversion Funnel Optimization Chart Powerpoint Idea
This is a conversion funnel optimization chart powerpoint idea. This is a seven stage process. The stages in this process are viewers, question, website visitors, sales, interest, purchase, qualified inquiries.
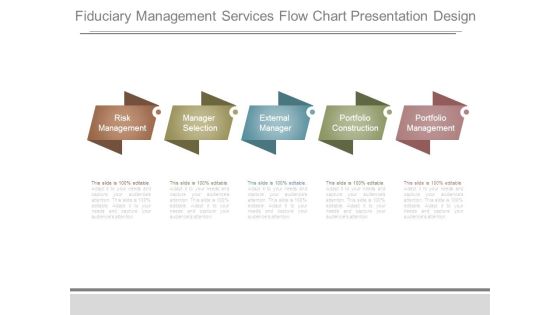
Fiduciary Management Services Flow Chart Presentation Design
This is a fiduciary management services flow chart presentation design. This is a five stage process. The stages in this process are risk management, manager selection, external manager, portfolio construction, portfolio management.

International Portfolio Functions Chart Ppt Examples Professional
This is a international portfolio functions chart ppt examples professional. This is a five stage process. The stages in this process are value, tools for cash, human capital, alignment, balance.

Marchandise Management System Chart Ppt Sample
This is a marchandise management system chart ppt sample. This is a seven stage process. The stages in this process are payment management, inspection, marketing, sourcing, channel management, financial management, orders.
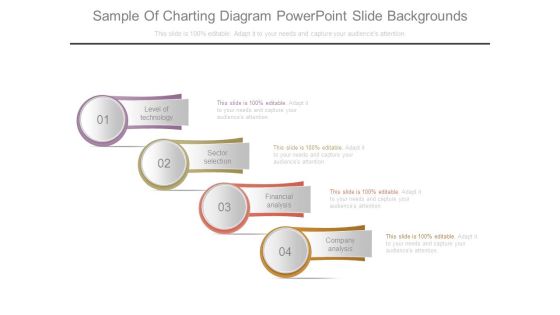
Sample Of Charting Diagram Powerpoint Slide Backgrounds
This is a sample of charting diagram powerpoint slide backgrounds. This is a four stage process. The stages in this process are level of technology, sector selection, financial analysis, company analysis.
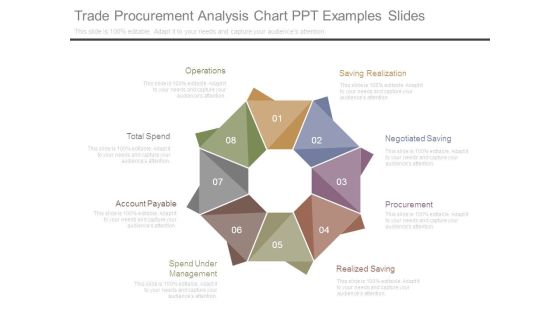
Trade Procurement Analysis Chart Ppt Examples Slides
This is a trade procurement analysis chart ppt examples slides. This is a eight stage process. The stages in this process are operations, total spend, account payable, spend under management, realized saving, procurement, negotiated saving, saving realization.

Marketing Potency Management Chart Ppt Slide Show
This is a marketing potency management chart ppt slide show. This is a five stage process. The stages in this process are viable to business, product, people, process, feasible to implement.

Customer Satisfaction Information Chart Ppt Templates
This is a customer satisfaction information chart ppt templates. This is a six stage process. The stages in this process are customer loyalty, quality assurance, timely delivery, reasonable price, customer expectations, customer satisfaction.

Continuous Market Research Chart Presentation Visuals
This is a continuous market research chart presentation visuals. This is a nine stage process. The stages in this process are opportunity, purchase behavior, past experience, needs wants, word of mouth, external comms, advertising, media consumption, communication.
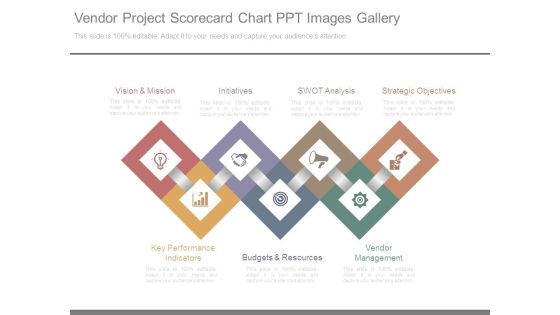
Vendor Project Scorecard Chart Ppt Images Gallery
This is a vendor project scorecard chart ppt images gallery. This is a seven stage process. The stages in this process are vision and mission, initiatives, swot analysis, strategic objectives, vendor management, budgets and resources, key performance indicators.

Web Based Charting Template Powerpoint Shapes
This is a web based charting template powerpoint shapes. This is a five stage process. The stages in this process are rss to email, inspiration, other blogs, freebies, graphic design.

Bcg Portfolio Analysis Chart Powerpoint Slides Background
This is a bcg portfolio analysis chart powerpoint slides background. This is a four stage process. The stages in this process are question marks, stars, cash cows, poor dogs.

Partner Development Cycle Chart Ppt Model
This is a partner development cycle chart ppt model. This is a eight stage process. The stages in this process are opportunity identification, refinement, partner qualification, negotiation and agreement, stewardship, implementation and management, performance review, preparation.
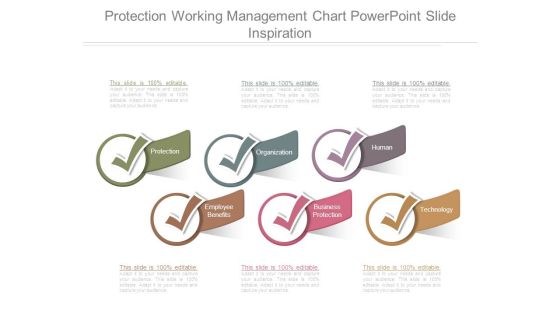
Protection Working Management Chart Powerpoint Slide Inspiration
This is a protection working management chart powerpoint slide inspiration. This is a six stage process. The stages in this process are protection, organization, human, employee benefits, business protection, technology.

Employee Life Cycle Chart Powerpoint Templates Microsoft
This is a employee life cycle chart powerpoint templates microsoft. This is a six stage process. The stages in this process are training, appraisal, payroll run, attendance, separation, manage performance.

Business To Business Sales Chart Presentation Images
This is a business to business sales chart presentation images. This is a six stage process. The stages in this process are your business, marketing, reactive existing customers, culture, reach new customers, sales.
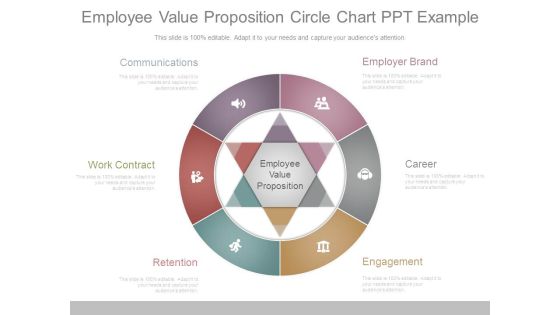
Employee Value Proposition Circle Chart Ppt Example
This is a employee value proposition circle chart ppt example. This is a six stage process. The stages in this process are employer brand, career, engagement, retention, work contract, communications.

Business Economic Cycle Chart Ppt Templates
This is a business economic cycle chart ppt templates. This is a four stage process. The stages in this process are economic prosperity, falling prices, economic depression, rising prices.
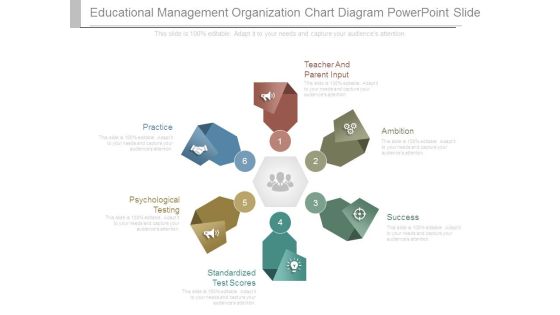
Educational Management Organization Chart Diagram Powerpoint Slide
This is a educational management organization chart diagram powerpoint slide. This is a six stage process. The stages in this process are teacher and parent input, ambition, success, standardized test scores, psychological testing, practice.
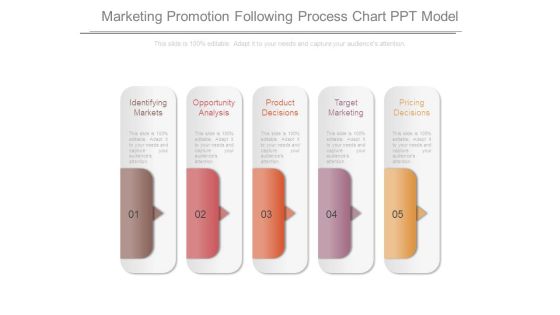
Marketing Promotion Following Process Chart Ppt Model
This is a marketing promotion following process chart ppt model. This is a five stage process. The stages in this process are identifying markets, opportunity analysis, product decisions, target marketing, pricing decisions.

Key Communications Activities Chart Layout Powerpoint Slides
This is a key communications activities chart layout powerpoint slides. This is a five stage process. The stages in this process are start of project, cost effective, equal and inclusive, clearly branded, end of project.

Business Assessment Ppt Chart Powerpoint Slides Show
This is a business assessment ppt chart powerpoint slides show. This is a six stage process. The stages in this process are mission, goals, objectives, outcomes, result analysis, action.
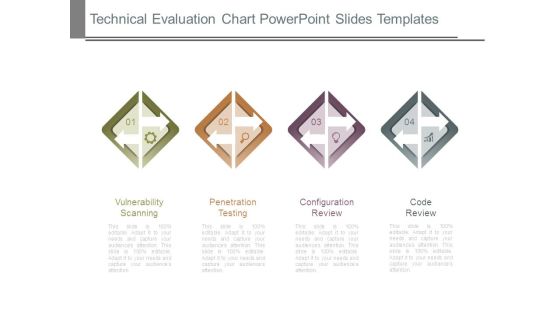
Technical Evaluation Chart Powerpoint Slides Templates
This is a technical evaluation chart powerpoint slides templates. This is a four stage process. The stages in this process are vulnerability scanning, penetration testing, configuration review, code review.
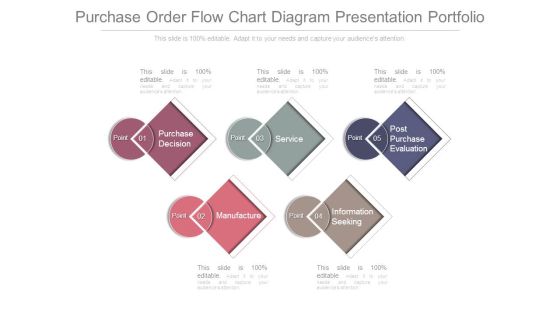
Purchase Order Flow Chart Diagram Presentation Portfolio
This is a purchase order flow chart diagram presentation portfolio. This is a five stage process. The stages in this process are purchase decision, service, post purchase evaluation, point, manufacture, information seeking.

Project Issues Description Chart Powerpoint Slide Graphics
This is a project issues description chart powerpoint slide graphics. This is a seven stage process. The stages in this process are issue description, reported on, reported by, owner, severity, priority, status.

Customer Use Cases Infogarphic Chart Ppt Slide
This is a customer use cases infogarphic chart ppt slide. This is a five stage process. The stages in this process are medical and healthcare, transportation and mobility, industrial and commercial, logistics and networking, defence and aerospace.

Project Issues Infogarphic Chart Ppt Examples Slides
This is a project issues infogarphic chart ppt examples slides. This is a seven stage process. The stages in this process are issue description, reported on, reported by, owner, severity, priority, status.

Competitive Analysis Table Chart Powerpoint Guide
This is a competitive analysis table chart powerpoint guide. This is a twelve stage process. The stages in this process are jan,feb, mar, apr, may, jun, jul, aug, sep, oct, nov, dec.

Partner Sales Cloud Infographic Chart Powerpoint Graphics
This is a partner sales cloud infographic chart powerpoint graphics. This is a six stage process. The stages in this process are news and events, marketing literature, sales tools, channel incentives, product promotions, deal registration.
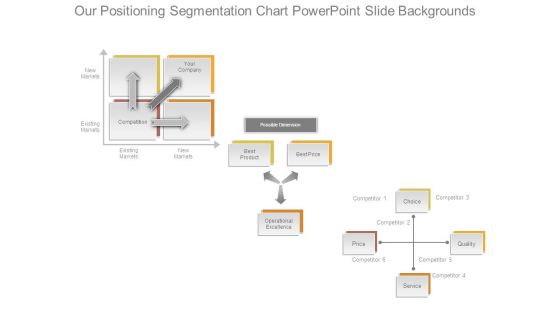
Our Positioning Segmentation Chart Powerpoint Slide Backgrounds
This is a our positioning segmentation chart powerpoint slide backgrounds. This is a three stage process. The stages in this process are new markets, existing markets, your company, competition, possible dimension, best product, operational excellence, service, price, choice.
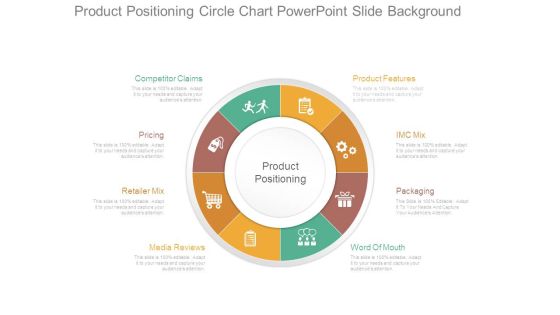
Product Positioning Circle Chart Powerpoint Slide Background
This is a product positioning circle chart powerpoint slide background. This is a eight stage process. The stages in this process are competitor claims, pricing, retailer mix, media reviews, product positioning, product features, imc mix, packaging, word of mouth.
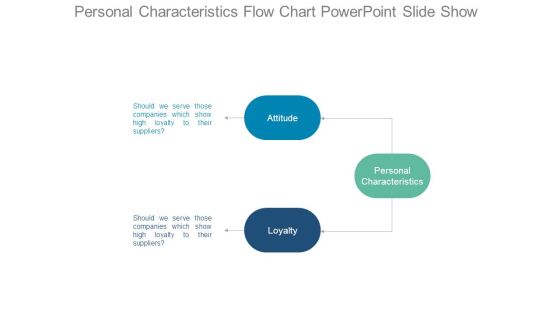
Personal Characteristics Flow Chart Powerpoint Slide Show
This is a personal characteristics flow chart powerpoint slide show. This is a three stage process. The stages in this process are should we serve those companies which show high loyalty to their suppliers, attitude, loyalty, personal characteristics.
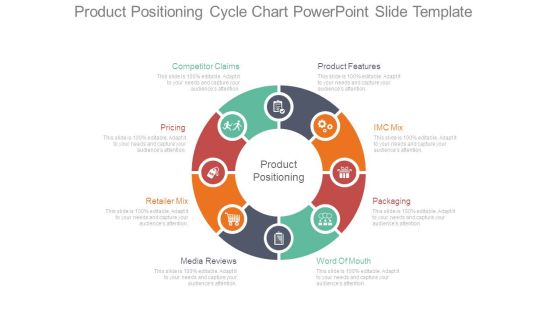
Product Positioning Cycle Chart Powerpoint Slide Template
This is a product positioning cycle chart powerpoint slide template. This is a eight stage process. The stages in this process are product features, imc mix, packaging, word of mouth, media reviews, retailer mix, pricing, competitor claims, product positioning.
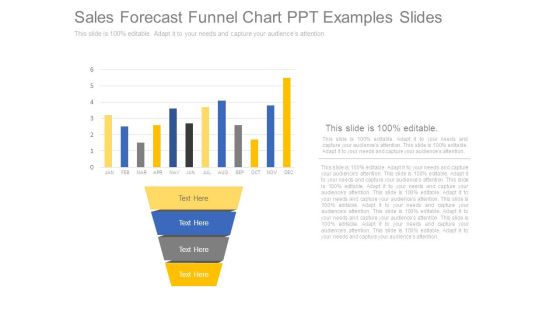
Sales Forecast Funnel Chart Ppt Examples Slides
This is a sales forecast funnel chart ppt examples slides. This is a four stage process. The stages in this process are jan, feb, mar, apr, may, jun, jul, aug, sep, oct, nov, dec.

Competitive Analysis Matrix Chart Ppt Samples Download
This is a competitive analysis matrix chart ppt samples download. This is a six stage process. The stages in this process are competitor, jan, feb, mar, apr, may, jun, jul, aug, sep, oct, nov, dec.

Sales Deal Steps Funnel Chart Ppt Templates
This is a sales deal steps funnel chart ppt templates. This is a eight stage process. The stages in this process are discovery, pre qualification, qualification, solution design, evaluation, decision, negotiation, closed.

Six Sigma Strands Chart Ppt Examples Slides
This is a six sigma strands chart ppt examples slides. This is a six stage process. The stages in this process are bottom line, trained individuals, data driven approach, customer focused, project by project, engagement, benefits of six sigma.
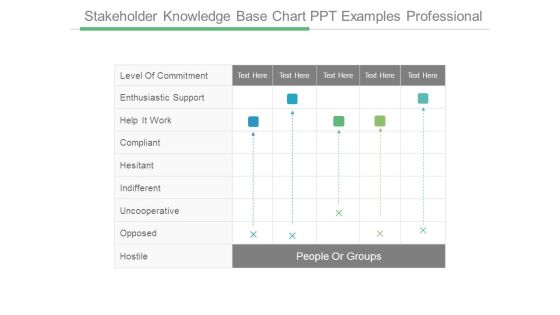
Stakeholder Knowledge Base Chart Ppt Examples Professional
This is a stakeholder knowledge base chart ppt examples professional. This is a five stage process. The stages in this process are people or groups, level of commitment, enthusiastic support, help it work, compliant, hesitant, indifferent, uncooperative, opposed, hostile.
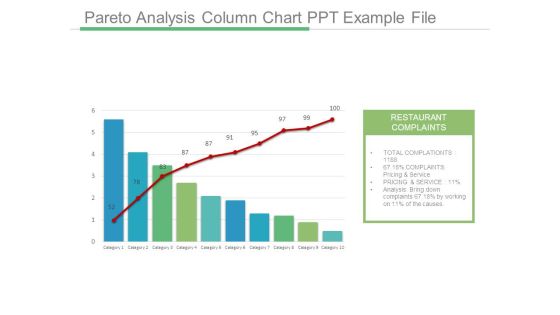
Pareto Analysis Column Chart Ppt Example File
This is a pareto analysis column chart ppt example file. This is a ten stage process. The stages in this process are restaurant complaints, total complaints, complaints pricing and service, pricing and service, analysis bring down complaints, category.

Sipoc Process Infogarphic Chart Powerpoint Slide Influencers
This is a sipoc process infogarphic chart powerpoint slide influencers. This is a five stage process. The stages in this process are suppliers, input, process, output, customer, start, finish, sipoc.
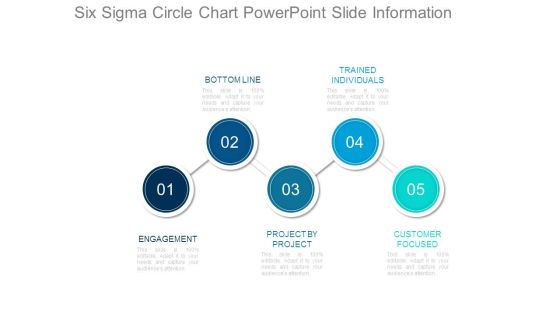
Six Sigma Circle Chart Powerpoint Slide Information
This is a six sigma circle chart powerpoint slide information. This is a five stage process. The stages in this process are bottom line, trained individuals, engagement, project by project, customer focused.
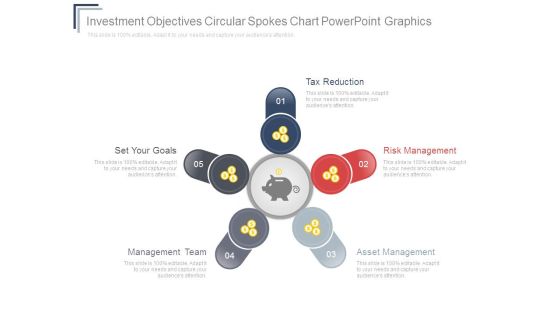
Investment Objectives Circular Spokes Chart Powerpoint Graphics
This is a investment objectives circular spokes chart powerpoint graphics. This is a five stage process. The stages in this process are tax reduction, set your goals, management team, asset management, risk management.
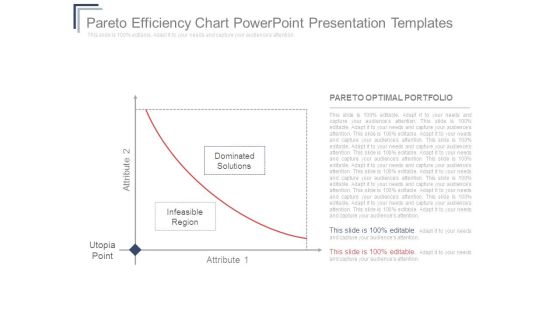
Pareto Efficiency Chart Powerpoint Presentation Templates
This is a pareto efficiency chart powerpoint presentation templates. This is a two stage process. The stages in this process are attribute 2, utopia, point, infeasible region, dominated, solutions, attribute 1, pareto optimal portfolio.

Risk Return Chart Ppt Slide Template
This is a risk return chart ppt slide template. This is a four stage process. The stages in this process are probability of technical success, bread and butter, pearls, oysters.
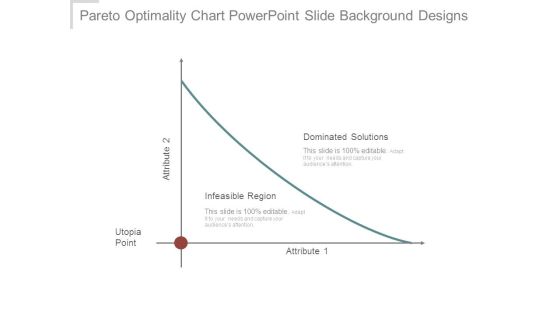
Pareto Optimality Chart Powerpoint Slide Background Designs
This is a pareto optimality chart powerpoint slide background designs. This is a one stage process. The stages in this process are dominated solutions, infeasible region, utopia point, attribute.
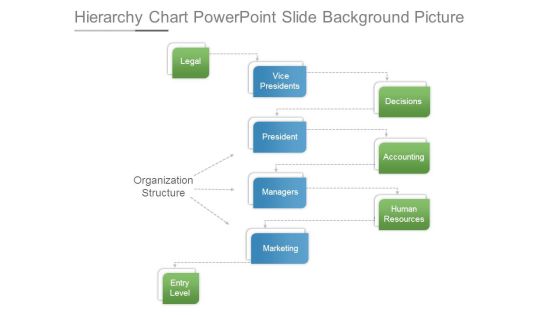
Hierarchy Chart Powerpoint Slide Background Picture
This is a hierarchy chart powerpoint slide background picture. This is a eight stage process. The stages in this process are organization structure, legal, vice presidents, decisions, president, managers, marketing, accounting, human resources, entry level.

Business Model Canvas Chart Ppt Images
This is a business model canvas chart ppt images. This is a five stage process. The stages in this process are key partners, key activities, value propositions, customer relationships, customer segments, key resources, channels, cost structure, revenue streams.

Competition Competitor Positioning Chart Powerpoint Slide Themes
This is a competition competitor positioning chart powerpoint slide themes. This is a four stage process. The stages in this process are gaining market share, losing market share, average market growth, company growth.

Customer Experience Survey Chart Powerpoint Templates Download
This is a customer experience survey chart powerpoint templates download. This is a four stage process. The stages in this process are satisfy unstated, customer needs, achieve customer delight, meet basic, customer requirements.

Company Positioning Charts Dashboard Ppt Background Template
This is a company positioning charts dashboard ppt background template. This is a four stage process. The stages in this process are possible dimension, best product, best price, operational excellence, choice, service, quality, competition, your company.
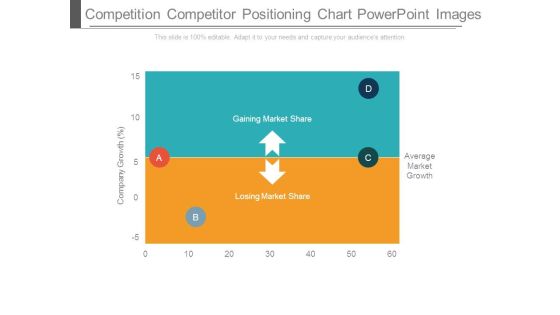
Competition Competitor Positioning Chart Powerpoint Images
This is a competition competitor positioning chart powerpoint images. This is a four stage process. The stages in this process are gaining market share, losing market share, average market growth, company growth.

Digital Marketing Roadmap Gantt Chart Ppt Slide
This is a digital marketing roadmap gantt chart ppt slide. This is a five stage process. The stages in this process are content, paid organic search, email marketing, social media.

Business Model Canvas Chart Example Ppt Presentation
This is a business model canvas chart example ppt presentation. This is a five stage process. The stages in this process are key partners, key activities, value propositions, customer relationships, customer segments, key resources, channels, cost structure, revenue streams.

New Business Model Chart Presentation Powerpoint Example
This is a new business model chart presentation powerpoint example. This is a five stage process. The stages in this process are key partners, key activities, value propositions, customer, relationships, customer segments, key resources, channels, cost structure, revenue streams.

Customer Revenue Statistical Chart Powerpoint Templates Microsoft
This is a customer revenue statistical chart powerpoint templates microsoft. This is a ten stage process. The stages in this process are email, display retargeting, comparison shopping, display, affiliates, inbound free links, brand organic search, brand paid search.

Workforce Performance Comparison Chart Powerpoint Slides Templates
This is a workforce performance comparison chart powerpoint slides templates. This is a two stage process. The stages in this process are customer focus, accountability, service excellence, problem solving, continuous improvement, collaborative conflict resolution.
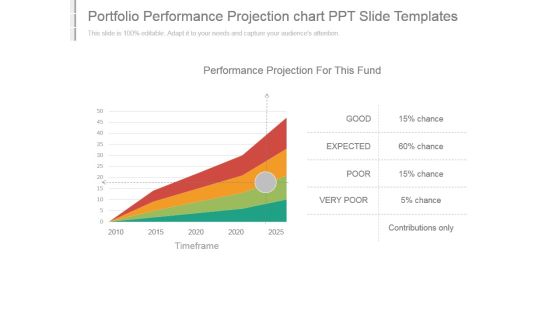
Portfolio Performance Projection Chart Ppt Slide Templates
This is a portfolio performance projection chart ppt slide templates. This is a four stage process. The stages in this process are performance projection for this fund, good, expected, poor, very poor, contributions only, timeframe.
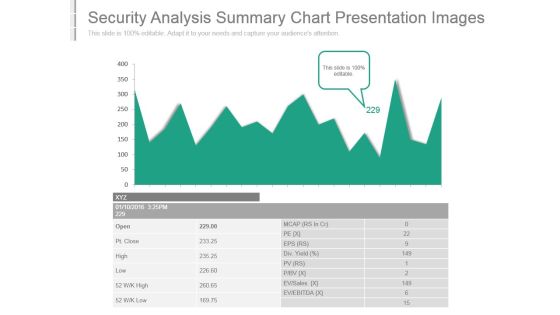
Security Analysis Summary Chart Presentation Images
This is a security analysis summary chart presentation images. This is a one stage process. The stages in this process are ev ebitda, ev sales, div yield, open, pt close, high, low, mcap, eps.
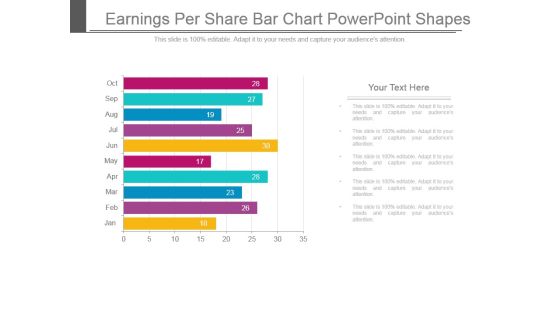
Earnings Per Share Bar Chart Powerpoint Shapes
This is a earnings per share bar chart powerpoint shapes. This is a ten stage process. The stages in this process are jan, feb, mar, apr, may, jun, jul, aug, sep, oct.
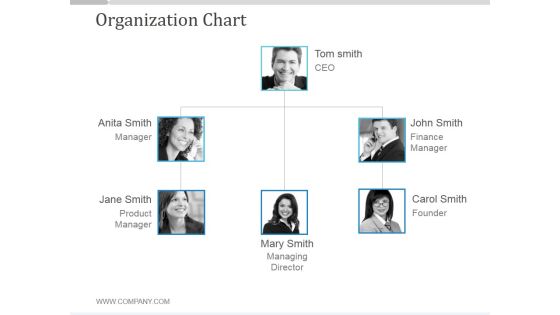
Organization Chart Ppt PowerPoint Presentation Backgrounds
This is a organization chart ppt powerpoint presentation backgrounds. This is a three stage process. The stages in this process are tom smith ceo, john smith finance manager, john smith finance manager, john smit finance manager.

Hierarchy Chart Ppt PowerPoint Presentation Ideas
This is a hierarchy chart ppt powerpoint presentation ideas. This is a three stage process. The stages in this process are peter smith, anita dross, carol taren, marry dsouza, even worsen.
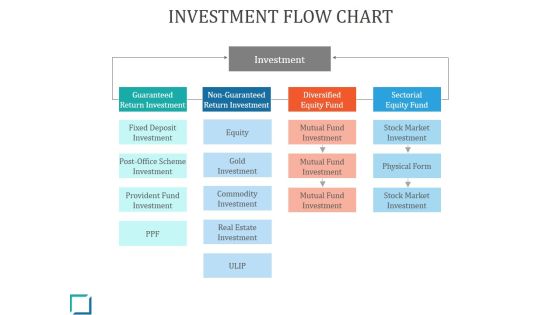
Investment Flow Chart Ppt PowerPoint Presentation Themes
This is a investment flow chart ppt powerpoint presentation themes. This is a five stage process. The stages in this process are investment, equity, gold investment, physical form, provident fund investment.
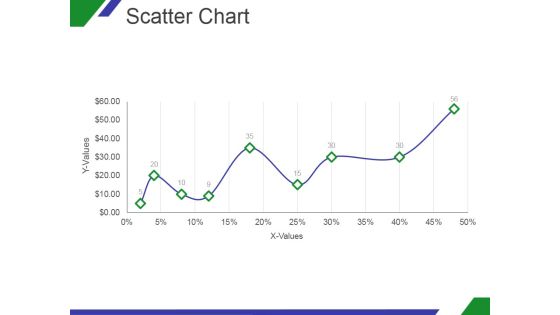
Scatter Chart Ppt PowerPoint Presentation Designs Download
This is a scatter chart ppt powerpoint presentation designs download. This is a nine stage process. The stages in this process are x values, y values, graph, growth, success.
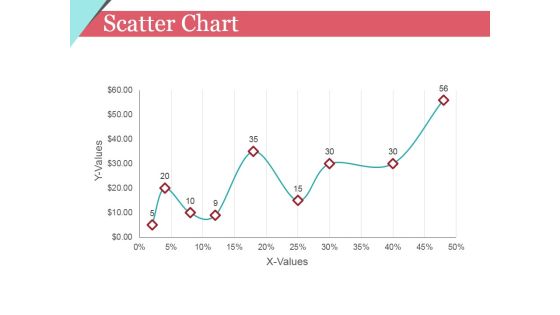
Scatter Chart Ppt PowerPoint Presentation Model Template
This is a scatter chart ppt powerpoint presentation model template. This is a nine stage process. The stages in this process are x values, y values, graph, growth, success.
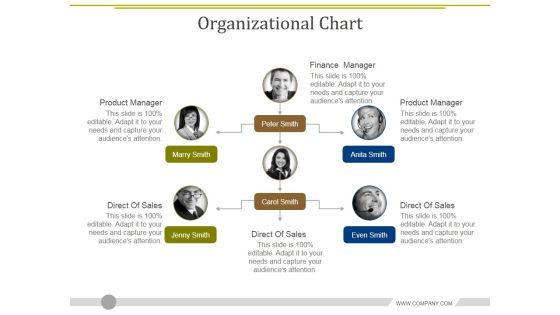
Organizational Chart Ppt PowerPoint Presentation Layouts Demonstration
This is a organizational chart ppt powerpoint presentation layouts demonstration. This is a six stage process. The stages in this process are finance manager, product manager, direct of sales, direct of sales, direct of sales.

Combo Chart Ppt PowerPoint Presentation Summary Ideas
This is a combo chart ppt powerpoint presentation summary ideas. This is a eight stage process. The stages in this process are market size, growth rate, product, in years.
Scatter Chart Ppt PowerPoint Presentation Icon Elements
This is a scatter chart ppt powerpoint presentation icon elements. This is a nine stage process. The stages in this process are dollar in billions, sales in percentage, business, success.

Bar Chart Ppt PowerPoint Presentation Portfolio Icons
This is a bar chart ppt powerpoint presentation portfolio icons. This is a seven stage process. The stages in this process are in years, in percentage, finance, business marketing.
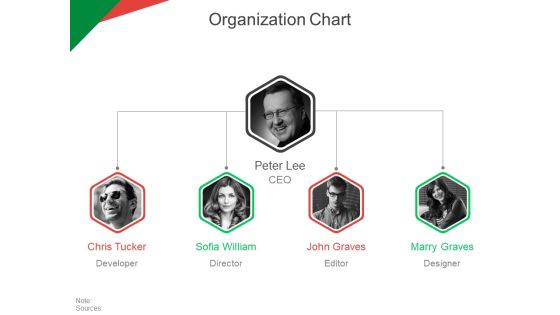
Organization Chart Ppt PowerPoint Presentation Ideas Tips
This is a organization chart ppt powerpoint presentation ideas tips. This is a four stage process. The stages in this process are peter lee, john graves, marry graves, sofia william, chris tucker.

Area Chart Ppt PowerPoint Presentation Gallery Icons
This is a area chart ppt powerpoint presentation gallery icons. This is a two stage process. The stages in this process are financial year, sales in percentage, product, finance, graph.

Area Chart Ppt PowerPoint Presentation Pictures Files
This is a area chart ppt powerpoint presentation pictures files. This is a two stage process. The stages in this process are product, sales, in percentage, financial year, business.

Scatter Chart Ppt PowerPoint Presentation Summary Visuals
This is a scatter chart ppt powerpoint presentation summary visuals. This is a eight stage process. The stages in this process are product, profit in sales, in percentage, finance, business.
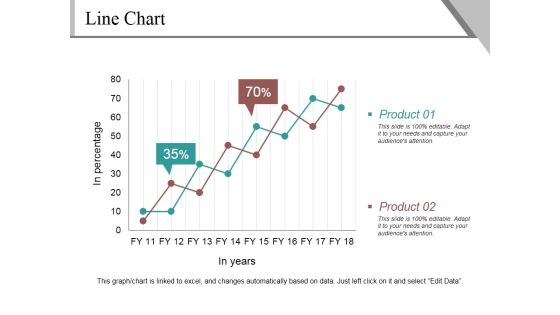
Line Chart Ppt PowerPoint Presentation Infographics Example
This is a line chart ppt powerpoint presentation infographics example. This is a two stage process. The stages in this process are product, in percentage, in years, finance, growth.

Bar Chart Ppt PowerPoint Presentation Icon Demonstration
This is a bar chart ppt powerpoint presentation icon demonstration. This is a seven stage process. The stages in this process are product, sales in percentage, financial year, graph.

Line Chart Ppt PowerPoint Presentation Layouts Example
This is a line chart ppt powerpoint presentation layouts example. This is a two stage process. The stages in this process are sales in percentage, product, financial years, growth, success.
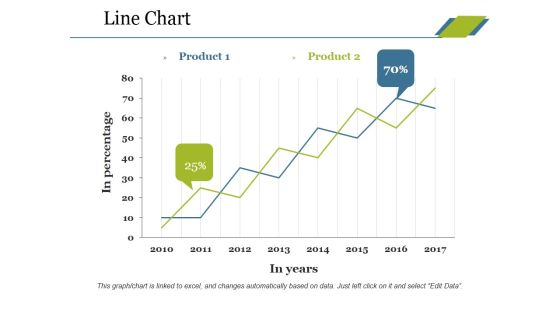
Line Chart Ppt PowerPoint Presentation Professional Tips
This is a line chart ppt powerpoint presentation professional tips. This is a two stage process. The stages in this process are product, in percentage, in years, growth, success.

Line Chart Ppt PowerPoint Presentation Slides Ideas
This is a line chart ppt powerpoint presentation slides ideas. This is a two stage process. The stages in this process are product, in percentage, in years, growth, success.

Line Chart Ppt PowerPoint Presentation Show Guide
This is a line chart ppt powerpoint presentation show guide. This is a two stage process. The stages in this process are product, sales in percentage, financial years, growth, success.

Organization Chart Ppt PowerPoint Presentation Gallery Ideas
This is a organization chart ppt powerpoint presentation gallery ideas. This is a four stage process. The stages in this process are managing director, ceo, head projects, head bending.

Combo Chart Ppt PowerPoint Presentation Show Deck
This is a combo chart ppt powerpoint presentation show deck. This is a three stage process. The stages in this process are growth rate, market size, product, bar graph, growth.

Line Chart Ppt PowerPoint Presentation Slides Mockup
This is a line chart ppt powerpoint presentation slides mockup. This is a two stage process. The stages in this process are in percentage, in years, product, growth, success.

Bar Chart Ppt PowerPoint Presentation Ideas Deck
This is a bar chart ppt powerpoint presentation ideas deck. This is a two stage process. The stages in this process are product, in percentage, in years, financial, business.

Comparison Of Social Network Training Services Ppt Model Clipart PDF
Mentioned slide illustrates comparison of various social media training services which are offered by marketing agencies to its clients. Facebook ads, YouTube marketing, social media audit, content writing are some of the services which will help the clients to develop social media skills. Pitch your topic with ease and precision using this comparison of social network training services ppt model clipart pdf. This layout presents information on monthly cost of training, facebook ads training, content writing training. It is also available for immediate download and adjustment. So, changes can be made in the color, design, graphics or any other component to create a unique layout.

Customer Voice Service Data Flow Charts Ppt PowerPoint Presentation Icon Styles PDF
This slide presents a data flow charts, which includes visual data about the inputs and outputs of entities and processes illustrating the flow of information between client voice services and data verse. it covers procedures including create project, distribute survey, respond to survey and analyse results. Presenting Customer Voice Service Data Flow Charts Ppt PowerPoint Presentation Icon Styles PDF to dispense important information. This template comprises one stages. It also presents valuable insights into the topics including Create Project, Distribute Survey, Analyze Results, Project Information. This is a completely customizable PowerPoint theme that can be put to use immediately. So, download it and address the topic impactfully.

Business Chart Success PowerPoint Presentation Slides C
Microsoft Powerpoint Slides and Backgrounds with budget cuts layoffs and dropped sales business model

Business Chart Success PowerPoint Presentation Slides Cc
Microsoft Powerpoint Slides and Backgrounds with budget cuts layoffs and dropped sales business model
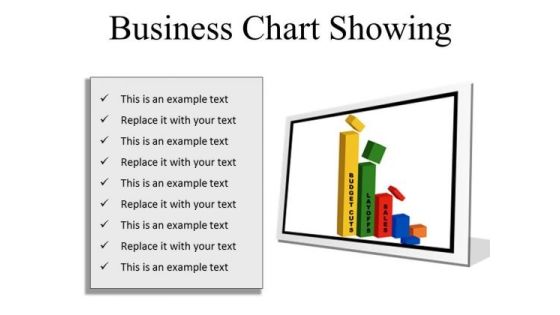
Business Chart Success PowerPoint Presentation Slides F
Microsoft Powerpoint Slides and Backgrounds with budget cuts layoffs and dropped sales business model

Business Chart Success PowerPoint Presentation Slides R
Microsoft Powerpoint Slides and Backgrounds with budget cuts layoffs and dropped sales business model

Business Chart Success PowerPoint Presentation Slides S
Microsoft Powerpoint Slides and Backgrounds with budget cuts layoffs and dropped sales business model
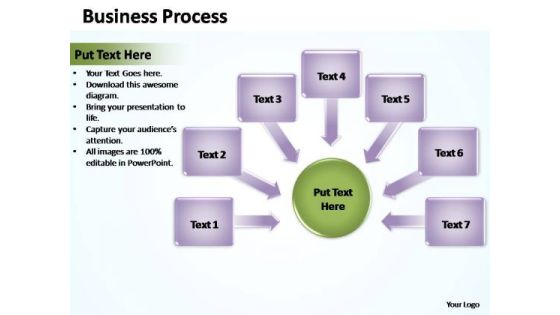
PowerPoint Layouts Chart Business Process Ppt Designs
PowerPoint Layouts Chart Business Process PPT Designs-The template offers an excellent background to build up the various stages of your business process. Bullet-point your thoughts and ideas to profitably accomplish every step of every stage along the way. Give them an overview of your capability and insight into the minute details of the overall picture highlighting the the interdependence at every operational level.-PowerPoint Layouts Chart Business Process PPT Designs

Company Product Sales Forecast Chart Icons PDF
This slide shows the Product sales forecast table with Product names along with price per unit and total units sold for the current as well as the projected period till the year 2023. Deliver an awe inspiring pitch with this creative company product sales forecast chart icons pdf bundle. Topics like company product sales forecast chart can be discussed with this completely editable template. It is available for immediate download depending on the needs and requirements of the user.

Company Product Sales Forecast Chart Download PDF
This slide shows the Product sales forecast table with Product names along with price per unit and total units sold for the current as well as the projected period till the year 2023. Deliver an awe inspiring pitch with this creative company product sales forecast chart download pdf bundle. Topics like company product sales forecast chart can be discussed with this completely editable template. It is available for immediate download depending on the needs and requirements of the user.

Employee Career Growth Progression Chart Download Pdf
This slide covers the employee career growth chart which focuses on job grades, salary bands, job titles of a marketing team. Deliver an awe inspiring pitch with this creative employee career growth progression chart download pdf bundle. Topics like marketing, strategist, social media can be discussed with this completely editable template. It is available for immediate download depending on the needs and requirements of the user.

Monthly Result Evaluation Of Digital Marketing Campaign Infographics PDF
This slide signifies the monthly result comparison of online marketing campaign. It covers information about marketing campaigns like social media, email, content and video with key performance indicators . Showcasing this set of slides titled Monthly Result Evaluation Of Digital Marketing Campaign Infographics PDF. The topics addressed in these templates are Marketing Campaign, Customer Engagement, Amount Spend. All the content presented in this PPT design is completely editable. Download it and make adjustments in color, background, font etc. as per your unique business setting.

Implementing Internal Marketing Comparative Analysis Of Employee Experience Ideas PDF
This slide shows comparative analysis of software used to provide great employee experience. It includes features, compatibility, price and ratings. Slidegeeks has constructed Implementing Internal Marketing Comparative Analysis Of Employee Experience Ideas PDF after conducting extensive research and examination. These presentation templates are constantly being generated and modified based on user preferences and critiques from editors. Here, you will find the most attractive templates for a range of purposes while taking into account ratings and remarks from users regarding the content. This is an excellent jumping-off point to explore our content and will give new users an insight into our top-notch PowerPoint Templates.

Selection Of Optimum IT Automation Solution Slides PDF
This slide provides information regarding selection of optimum IT automation solution. The tools are analyzed based in the category they served, ideal for, features, implementation and price. Slidegeeks has constructed Selection Of Optimum IT Automation Solution Slides PDF after conducting extensive research and examination. These presentation templates are constantly being generated and modified based on user preferences and critiques from editors. Here, you will find the most attractive templates for a range of purposes while taking into account ratings and remarks from users regarding the content. This is an excellent jumping-off point to explore our content and will give new users an insight into our top-notch PowerPoint Templates.

Major Challenges Of RPA Adoption With Solutions Microsoft PDF
This slide showcases the significant challenges of enforcing robotic process automation in organizations and solutions. It incorporates challenges such as automating the entire process, unoptimized processes, poorly defined responsibility, etc. Slidegeeks has constructed Major Challenges Of RPA Adoption With Solutions Microsoft PDF after conducting extensive research and examination. These presentation templates are constantly being generated and modified based on user preferences and critiques from editors. Here, you will find the most attractive templates for a range of purposes while taking into account ratings and remarks from users regarding the content. This is an excellent jumping-off point to explore our content and will give new users an insight into our top-notch PowerPoint Templates.

Photo Framework Family PowerPoint Templates And PowerPoint Backgrounds 0811
Microsoft PowerPoint Template and Background with two frameworks for photo of family

Photo Framework Family PowerPoint Themes And PowerPoint Slides 0811
Microsoft PowerPoint Theme and Slide with two frameworks for photo of family

Sales Diagram Linear Flow 7 Stages Business Framework Model
Delight Them With Our Sales Diagram Linear Flow 7 Stages Business Framework Model Powerpoint Templates.


 Continue with Email

 Home
Home


