AI PPT Maker
Templates
PPT Bundles
Design Services
Business PPTs
Business Plan
Management
Strategy
Introduction PPT
Roadmap
Self Introduction
Timelines
Process
Marketing
Agenda
Technology
Medical
Startup Business Plan
Cyber Security
Dashboards
SWOT
Proposals
Education
Pitch Deck
Digital Marketing
KPIs
Project Management
Product Management
Artificial Intelligence
Target Market
Communication
Supply Chain
Google Slides
Research Services
 One Pagers
All Categories
-
Home
- Customer Favorites
- Phases
Phases
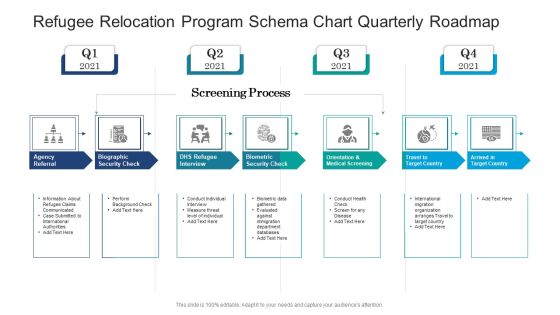
Refugee Relocation Program Schema Chart Quarterly Roadmap Background
Presenting the refugee relocation program schema chart quarterly roadmap background. The template includes a roadmap that can be used to initiate a strategic plan. Not only this, the PowerPoint slideshow is completely editable and you can effortlessly modify the font size, font type, and shapes according to your needs. This PPT slide can be easily reached in standard screen and widescreen aspect ratios. The set is also available in various formats like PDF, PNG, and JPG. So download and use it multiple times as per your knowledge.

Three Months Relocation Schema Chart Roadmap For Permanent Residence Guidelines
Presenting our jaw dropping three months relocation schema chart roadmap for permanent residence guidelines. You can alternate the color, font size, font type, and shapes of this PPT layout according to your strategic process. This PPT presentation is compatible with Google Slides and is available in both standard screen and widescreen aspect ratios. You can also download this well researched PowerPoint template design in different formats like PDF, JPG, and PNG. So utilize this visually appealing design by clicking the download button given below.

Company HR Hiring Process Recruitment Flow Chart Brochure PDF
This slide displays hiring process of a company to get new and skilled employees for the business growth and development. It includes processes such as the screening call and in-person interview, as well as the background check and, finally, the job offer. Persuade your audience using this Company HR Hiring Process Recruitment Flow Chart Brochure PDF. This PPT design covers one stages, thus making it a great tool to use. It also caters to a variety of topics including Appropriate Applicant, Recruitment Plan, Determine Categorization. Download this PPT design now to present a convincing pitch that not only emphasizes the topic but also showcases your presentation skills.

Officers HR Recruitment Process Flow Chart Slides PDF
This slide shows the whole process of hiring the officers into a department for the betterment of the company. It includes certain stages such as application submission, physical or medical test, interview , etc. Persuade your audience using this Officers HR Recruitment Process Flow Chart Slides PDF. This PPT design covers one stages, thus making it a great tool to use. It also caters to a variety of topics including Determine, Procurement Board, Application Completion. Download this PPT design now to present a convincing pitch that not only emphasizes the topic but also showcases your presentation skills.
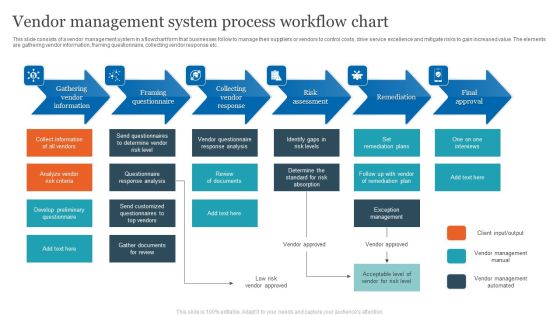
Vendor Management System Process Workflow Chart Slides PDF
This slide consists of a vendor management system in a flowchart form that businesses follow to manage their suppliers or vendors to control costs, drive service excellence and mitigate risks to gain increased value. The elements are gathering vendor information, framing questionnaire, collecting vendor response etc. Persuade your audience using this Vendor Management System Process Workflow Chart Slides PDF. This PPT design covers Six stages, thus making it a great tool to use. It also caters to a variety of topics including Gathering Vendor Information, Framing Questionnaire, Collecting Vendor Response. Download this PPT design now to present a convincing pitch that not only emphasizes the topic but also showcases your presentation skills.

Workflow Chart To Map Customer Order Process Clipart PDF
This template comprises of a customer ordering process in the form of flowchart which gives insights about the departments and activities involved in fulfilment of orders. The key elements involved in the process are customer, sales, stocks and finance. Persuade your audience using this Workflow Chart To Map Customer Order Process Clipart PDF. This PPT design covers Four stages, thus making it a great tool to use. It also caters to a variety of topics including Place Order, Confirm Order Receipt, Assess The Inventory. Download this PPT design now to present a convincing pitch that not only emphasizes the topic but also showcases your presentation skills.

Billing And Payment Process Via Application Workflow Chart Professional PDF
This slide illustrate the sequence of events of performed in payment process via an mobile application between a customer and buyer. It includes process such as bill payment, payment approval, payment verification etc. Persuade your audience using this Billing And Payment Process Via Application Workflow Chart Professional PDF. This PPT design covers one stages, thus making it a great tool to use. It also caters to a variety of topics including Payment Approved, Payment Gateway, Consumer Information . Download this PPT design now to present a convincing pitch that not only emphasizes the topic but also showcases your presentation skills.

Column Chart Strategies For Acquiring Consumers With Customer Acquisition Budget Microsoft PDF
Are you searching for a Column Chart Strategies For Acquiring Consumers With Customer Acquisition Budget Microsoft PDF that is uncluttered, straightforward, and original It is easy to edit, and you can change the colors to suit your personal or business branding. For a presentation that expresses how much effort you have put in, this template is ideal With all of its features, including tables, diagrams, statistics, and lists, it is perfect for a business plan presentation. Make your ideas more appealing with these professional slides. Download Column Chart Strategies For Acquiring Consumers With Customer Acquisition Budget Microsoft PDF from Slidegeeks today.

8 Stages Involved Course Of Action Product Flow Chart PowerPoint Slides
We present our 8 stages involved course of action product flow chart PowerPoint Slides.Use our Signs PowerPoint Templates because they will Amplify your views and plans for getting ahead and then the manner in which you intend staying ahead. Use our Arrows PowerPoint Templates because the mind is always whirring with new ideas. Download and present our Shapes PowerPoint Templates because Our Template designs are State of the Art. Download and present our Leadership PowerPoint Templates because this diagram can be used to illustrate the logical path or system. Present our Process and Flows PowerPoint Templates because you can blaze a brilliant trail from point to point.Use these PowerPoint slides for presentations relating to Arrows, art, , business, chart, circle, concept, connection, cycle, development, diagram, direction, element, environment, exchange, finance, financial, flow, graph, graphic, graphic presentation, group, icon, illustration, investment, isolated, isometric, market, motion, movement, organization, passive income, perspective, process, process chart,. The prominent colors used in the PowerPoint template are Blue light, Black, Gray. The feedback we get is that our 8 stages involved course of action product flow chart PowerPoint Slides are Whimsical. People tell us our concept PowerPoint templates and PPT Slides are No-nonsense. We assure you our 8 stages involved course of action product flow chart PowerPoint Slides are Clever. Presenters tell us our concept PowerPoint templates and PPT Slides are readymade to fit into any presentation structure. We assure you our 8 stages involved course of action product flow chart PowerPoint Slides are readymade to fit into any presentation structure. Use our business PowerPoint templates and PPT Slides are Fun.

COVID 19 Mitigating Impact On High Tech Industry COVID 19 Job Crisis In Various Industries Diagrams PDF
Presenting this set of slides with name covid 19 mitigating impact on high tech industry covid 19 job crisis in various industries diagrams pdf. The topics discussed in these slides are constructions, professional and business services, manufacturing, government workers, education and health services. This is a completely editable PowerPoint presentation and is available for immediate download. Download now and impress your audience.

Global Financial Catastrophe 2008 Banks Have Paid Billions Of Dollars In Fine Ppt Visual Aids Diagrams PDF
Deliver an awe inspiring pitch with this creative global financial catastrophe 2008 banks have paid billions of dollars in fine ppt visual aids diagrams pdf bundle. Topics like banks have paid billions of dollars in fine can be discussed with this completely editable template. It is available for immediate download depending on the needs and requirements of the user.
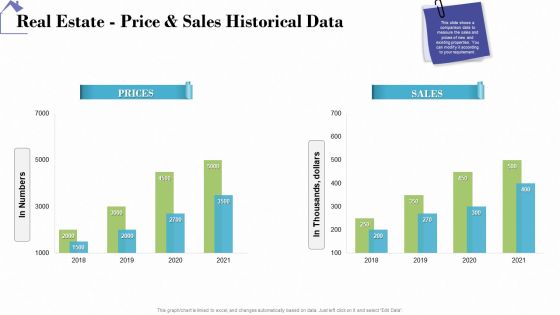
Industry Analysis Of Real Estate And Construction Sector Real Estate Price And Sales Historical Data Diagrams PDF
Deliver and pitch your topic in the best possible manner with this industry analysis of real estate and construction sector real estate price and sales historical data diagrams pdf. Use them to share invaluable insights on prices, sales and impress your audience. This template can be altered and modified as per your expectations. So, grab it now.

Earnings Business PowerPoint Template 1110
money and a bar chart

Business Charts PowerPoint Templates Cards And Dices Happy New Year Sales Marketing Slides
Business Charts PowerPoint templates cards and dices happy new year Sales marketing Slides-New Year is the time at which a new calendar year begins and the calendar's year count is incremented. This PowerPoint Diagram helps you to wish New Year in different way. It consists of many slides with different graphics. It shows different ways of representing 2013 and wishing New Year.
Business Charts PowerPoint Templates Design Of An Emoticon Showing Angry Face Sales
Business Charts PowerPoint templates design of an emoticon showing angry face Sales-Use this Business PowerPoint Diagram to represent different types of angry faces. It portrays the concept of animosity, annoyance, antagonism, ill humor, ill temper, impatience, indignation, infuriation, irascibility, ire, irritability, vexation, violence.

Map Of India With Bar Chart And States Highlighted Powerpoint Slides
This PowerPoint template has been designed with map of India with bar chart. Each and every property of any region - color, size, shading etc can be modified to help you build an effective PowerPoint presentation. Use this map diagram to show sales territories, business and new office locations, travel planning etc in your presentations.

Gantt Chart Showing Critical And Flexible Task Planning Ppt PowerPoint Presentation Model Shapes
This is a gantt chart showing critical and flexible task planning ppt powerpoint presentation model shapes. The topics discussed in this diagram are critical path method, critical path analysis, cpm. This is a completely editable PowerPoint presentation, and is available for immediate download.
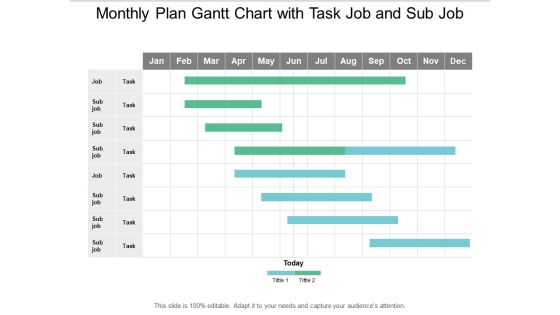
Monthly Plan Gantt Chart With Task Job And Sub Job Ppt PowerPoint Presentation Infographic Template Mockup
This is a monthly plan gantt chart with task job and sub job ppt powerpoint presentation infographic template mockup. The topics discussed in this diagram are critical path method, critical path analysis, cpm. This is a completely editable PowerPoint presentation, and is available for immediate download.

Chart To Compare Month To Month Change Ppt PowerPoint Presentation Infographic Template Slide Portrait
This is a chart to compare month to month change ppt powerpoint presentation infographic template slide portrait. The topics discussed in this diagram are monthly comparison, monthly compare, 30 days comparison. This is a completely editable PowerPoint presentation and is available for immediate download.
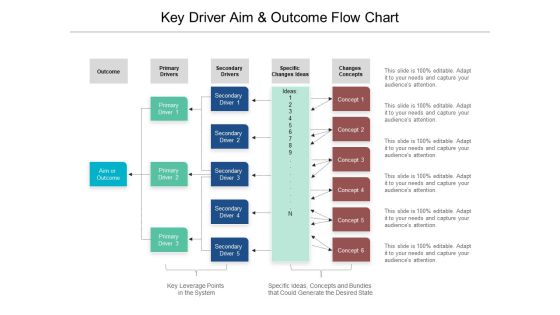
Key Driver Aim And Outcome Flow Chart Ppt PowerPoint Presentation Gallery Format
Presenting this set of slides with name key driver aim and outcome flow chart ppt powerpoint presentation gallery format. This is a five stage process. The stages in this process are driver diagram, change management, improve customer. This is a completely editable PowerPoint presentation and is available for immediate download. Download now and impress your audience.
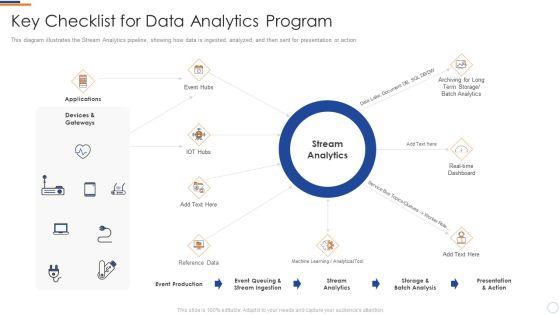
Key Checklist For Data Analytics Program Business Intelligence And Big Graphics PDF
This diagram illustrates the stream Analytics pipeline, showing how data is ingested, analyzed, and then sent for presentation or action. This is a key checklist for data analytics program business intelligence and big graphics pdf template with various stages. Focus and dispense information on eight stages using this creative set, that comes with editable features. It contains large content boxes to add your information on topics like applications, devices and gateways, stream analytics, presentation and action. You can also showcase facts, figures, and other relevant content using this PPT layout. Grab it now.

Client Achievements Playbook One Customer Data Platform To Meet All Needs Rules PDF
Following slide depicts the companys customer data platform, which is designed to meet the data needs of customer success team. Data sources covered in the diagram are website, POS, customer feedback etc. This is a client achievements playbook one customer data platform to meet all needs rules pdf template with various stages. Focus and dispense information on two stages using this creative set, that comes with editable features. It contains large content boxes to add your information on topics like data sources, customer success team, ecommerce website, mobile application, customer service specialist. You can also showcase facts, figures, and other relevant content using this PPT layout. Grab it now.

Blue Ocean Tactics Using Blue Ocean Swot With Existing Strategic Planning Model Information PDF
Are you searching for a Blue Ocean Tactics Using Blue Ocean Swot With Existing Strategic Planning Model Information PDF that is uncluttered, straightforward, and original Its easy to edit, and you can change the colors to suit your personal or business branding. For a presentation that expresses how much effort youve put in, this template is ideal With all of its features, including tables, diagrams, statistics, and lists, its perfect for a business plan presentation. Make your ideas more appealing with these professional slides. Download Blue Ocean Tactics Using Blue Ocean Swot With Existing Strategic Planning Model Information PDF from Slidegeeks today.
Team Process Control And Goal Planning Icons Powerpoint Templates
This business diagram has been designed with five tags with icons. This diagram contains the icons of team, process control and goal planning. Use this business diagram to build an exclusive presentation for your viewers.
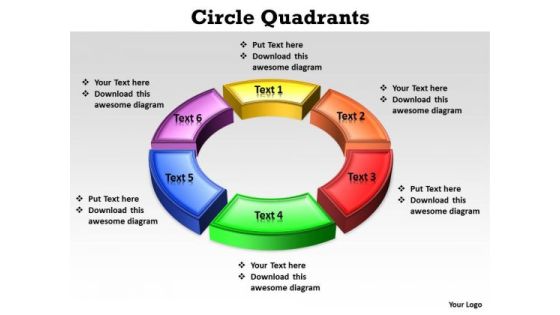
Ppt Circle Quadrants 6 Points Free Editable PowerPoint Maps For Presentations Templates
PPT circle quadrants 6 points free editable powerpoint maps for presentations Templates-This Multi-colored PowerPoint Diagram showing six different Quadrants which are forming the circle, explaining their respective topics in sequence. Use this PowerPoint Diagram for Business Presentations. You can Edit color, size and orientation of any icon to your liking.-PPT circle quadrants 6 points free editable powerpoint maps for presentations Templates-Abstract, Blank, Business, Chart, Circular, Circulation, Cycle, Design, Diagram, Empty, Executive, Icon, Illustration, Management, Model, Organization, Procedure, Process, Resource, Sequence, Sequential, Seven, Strategy, Template

Diagram For Risk Assessment Methodology Powerpoint Slides
This PowerPoint template contains graphics of three circles with business icons. You may download this PPT slide design to display risk assessment methodology. You can easily customize this template to make it more unique as per your need.
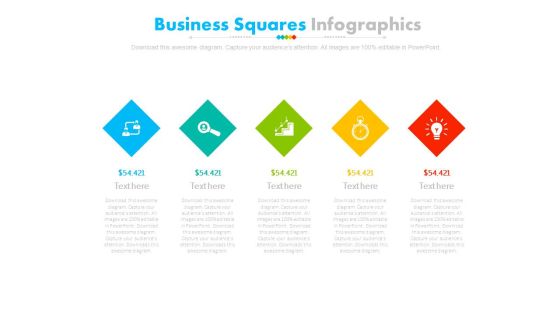
Five Steps Diamond Infographic Diagram Powerpoint Slides
This PowerPoint template has been designed with alphabet steps with icons. This PPT slide may be used to display financial strategy analysis. Make outstanding business presentation with this template.

Diagram Of Marketing Research Questions Powerpoint Slides
This PowerPoint template has been designed with four text tags and icons. This PPT slide can be used to prepare marketing research questions. You can download finance PowerPoint template to prepare awesome presentations.
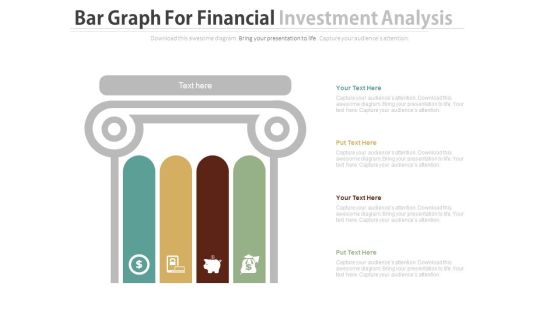
Financial Saving And Investment Diagram Powerpoint Slides
This PowerPoint template has been designed with professional graphics with finance icons. This PPT slide can be used to display financial saving and investment concepts. You can download finance PowerPoint template to prepare awesome presentations.
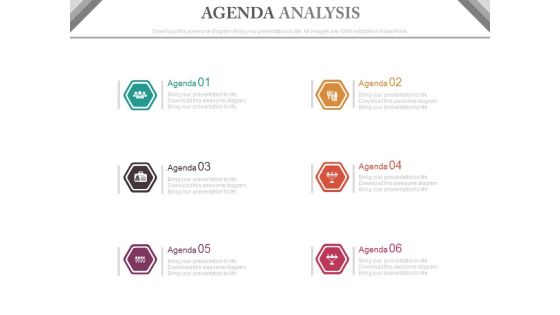
Six Steps Agenda Infographics Diagram Powerpoint Slides
This PowerPoint template contains six agenda steps with icons. You may download this PPT slide to display summary, review or bullet points.?This template is fully editable and the colors and shapes can be modified to suit your requirement.

Circular Diagram For Target Planning Powerpoint Slides
This PowerPoint template is useful for making presentations on business goals and strategy formation. This PPT background has a design of business icons around target board. This PPT slide is suitable for topics like corporate strategic planning.
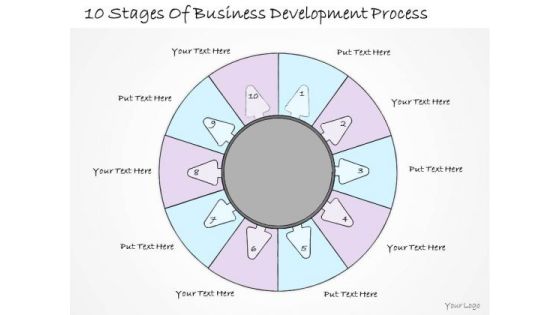
Ppt Slide 10 Stages Of Business Development Process Strategic Planning
Get The Domestics Right With Our PPT Slide 10 Stages Of Business Development Process Strategic Planning Powerpoint Templates. Create The Base For Thoughts To Grow. Do Away With Dogmatic Approaches. Establish The Value Of Reason With Our Business Diagrams Powerpoint Templates.
Icons Around Magnifying Glass With Team Icons Powerpoint Templates
Develop competitive advantage with our above template which contains magnifying glass with team icons. This diagram helps to display team search concept. You can edit text, color, shade and style as per you need.

Ppt Power Point Org Chart Shaped Circular Arrows PowerPoint 2007 6 Sections Templates
PPT power point org chart shaped circular arrows powerpoint 2007 6 sections Templates-This circular shaped Org Chart displays the system of an organization in terms of relationships among personnel or departments and is the most intuitive way to understand your organization.-PPT power point org chart shaped circular arrows powerpoint 2007 6 sections Templates-Abstract, Around, Arrow, Arrow Circles, Chart, Circle, Circular, Circular Arrows, Circular Flow, Circulation, Cycle, Cyclic, Direction, Element, Flow, Icon, Illustration, Isolated, Motion, Movement, Refresh, Ring, Rotation, Round, Section, Set, Shape, Sign, Symbol

Stock Photo Question Mark With Stethoscope Medical Theme PowerPoint Slide
This image slide has been designed with blue color question mark and individual stethoscope. You may change size, color and orientation of any icon to your liking. This image slide may be used in medical theme presentations. Use this PowerPoint template in your presentations to show problem check in any situation. This image slide will provide an ideal backdrop to your presentations.

5 Steps Illustrated In Horizontal Manner Process Flow Charts Examples PowerPoint Templates
We present our 5 steps illustrated in horizontal manner process flow charts examples PowerPoint templates.Download and present our Arrows PowerPoint Templates because it shows you the vision of a desired destination and the best road to take to reach that goal. Download and present our Shapes PowerPoint Templates because it helps your team to align their arrows to consistently be accurate. Download our Signs PowerPoint Templates because generation of sales is the core of any business. Use our Business PowerPoint Templates because you have churned your mind and come upwith solutions. Use our Process and Flows PowerPoint Templates because this diagram has the unique ability to drive home your ideas and show how they mesh to guarantee success.Use these PowerPoint slides for presentations relating to Abstract, Arrows, business, chart, circulation, concept, conceptual, design, diagram, executive, four, icon, idea, illustration, management, map, mapping, model, numbers, organization, procedure, process, progression, resource, sequence, sequential, stages, steps, strategy,. The prominent colors used in the PowerPoint template are Green, Gray, White. The feedback we get is that our 5 steps illustrated in horizontal manner process flow charts examples PowerPoint templates are topically designed to provide an attractive backdrop to any subject. People tell us our circulation PowerPoint templates and PPT Slides are Luxuriant. We assure you our 5 steps illustrated in horizontal manner process flow charts examples PowerPoint templates are Wistful. Presenters tell us our conceptual PowerPoint templates and PPT Slides are Amazing. We assure you our 5 steps illustrated in horizontal manner process flow charts examples PowerPoint templates are Beautiful. Use our concept PowerPoint templates and PPT Slides are Striking.

Horizontal Flow Steps To Manage Complex Projects Business Processing Chart PowerPoint Templates
We present our horizontal flow steps to manage complex projects business processing chart PowerPoint templates.Download and present our Arrows PowerPoint Templates because the key criteria for necessary infrastructure are at your finger tips. Radiate this knowledge to the group and see their eyes light up. Use our Shapes PowerPoint Templates because they will help you to organise the logic of your views. Download our Business PowerPoint Templates because you can Flutter your wings and enchant the world. Impress them with the innate attractiveness of your thoughts and words. Present our Signs PowerPoint Templates because this Diagram pinpoints the critical paths and areas in your process and set the timelines for their completion. Use our Process and Flows PowerPoint Templates because you have developed a vision of where you want to be a few years from now.Use these PowerPoint slides for presentations relating to abstract, arrow, blank, business, chart, circular, circulation, concept, conceptual, design, diagram, executive, flow, horizontal, icon, idea, illustration, management, model, numbers, organization, process, progression, resource, sequence, stages, steps, strategy. The prominent colors used in the PowerPoint template are Green, Gray, Black. The feedback we get is that our horizontal flow steps to manage complex projects business processing chart PowerPoint templates are Bold. PowerPoint presentation experts tell us our circulation PowerPoint templates and PPT Slides are effectively colour coded to prioritise your plans They automatically highlight the sequence of events you desire. People tell us our horizontal flow steps to manage complex projects business processing chart PowerPoint templates are Fantastic. Professionals tell us our circulation PowerPoint templates and PPT Slides are Splendid. You can be sure our horizontal flow steps to manage complex projects business processing chart PowerPoint templates are Nice. We assure you our circulation PowerPoint templates and PPT Slides are Elegant.
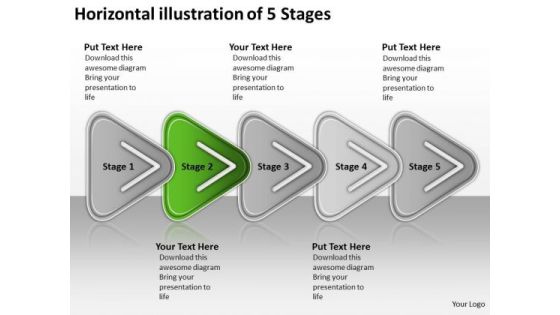
Horizontal Illustration Of 5 Stages Order Process Flow Chart PowerPoint Slides
We present our horizontal illustration of 5 stages order process flow chart PowerPoint Slides.Present our Arrows PowerPoint Templates because this template contains the material to highlight the key issues of your presentation. Download our Shapes PowerPoint Templates because this PPt slide can educate your listeners on the relevance and importance of each one as per your plan and how they all contribute as you strive to hit the Bullseye. Download our Business PowerPoint Templates because your thoughts are pointed and sharp as arrows. Download and present our Signs PowerPoint Templates because this diagram provides range of options to garner your interest. Present our Process and Flows PowerPoint Templates because by using this slide you can Heighten the anticipation of your audience listing .Use these PowerPoint slides for presentations relating to abstract, arrow, blank, business, chart, circular, circulation, concept, conceptual, design, diagram, executive, flow, horizontal, icon, idea, illustration, management, model, numbers, organization, process, progression, resource, sequence, stages, steps, strategy. The prominent colors used in the PowerPoint template are Green, Gray, White. The feedback we get is that our horizontal illustration of 5 stages order process flow chart PowerPoint Slides are Functional. PowerPoint presentation experts tell us our blank PowerPoint templates and PPT Slides are Versatile. People tell us our horizontal illustration of 5 stages order process flow chart PowerPoint Slides look good visually. Professionals tell us our blank PowerPoint templates and PPT Slides are Ritzy. You can be sure our horizontal illustration of 5 stages order process flow chart PowerPoint Slides effectively help you save your valuable time. We assure you our concept PowerPoint templates and PPT Slides are Tasteful.
Autumn Icon
Fallen Leaves
Earth Icon
Earth

Medical Icon
global health

Networking Icon
Connected People

Kpi Metrics Dashboard To Analyze The Effectiveness Of New Product Launch Launching New Beverage Product Diagrams PDF
The following slide outlines key performance indicator KPI dashboard which can be used to measure the success of product launch. The kpis are total units, revenue, average selling price ASP, number of penetrated planned customers etc. Create an editable Kpi Metrics Dashboard To Analyze The Effectiveness Of New Product Launch Launching New Beverage Product Diagrams PDF that communicates your idea and engages your audience. Whether you are presenting a business or an educational presentation, pre-designed presentation templates help save time. Kpi Metrics Dashboard To Analyze The Effectiveness Of New Product Launch Launching New Beverage Product Diagrams PDF is highly customizable and very easy to edit, covering many different styles from creative to business presentations. Slidegeeks has creative team members who have crafted amazing templates. So, go and get them without any delay.
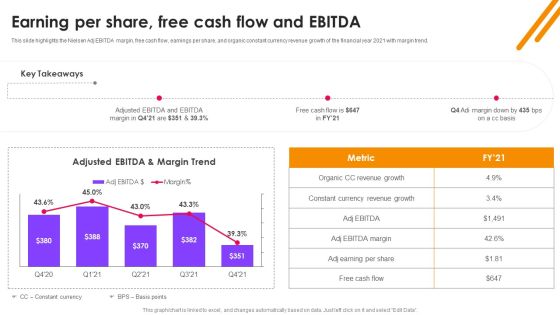
Nielsen Business Profile Earning Per Share Free Cash Flow And EBITDA Ppt PowerPoint Presentation Diagram Lists PDF
This slide highlights the Nielsen Adj EBITDA margin, free cash flow, earnings per share, and organic constant currency revenue growth of the financial year 2021 with margin trend. Here you can discover an assortment of the finest PowerPoint and Google Slides templates. With these templates, you can create presentations for a variety of purposes while simultaneously providing your audience with an eye catching visual experience. Download Nielsen Business Profile Earning Per Share Free Cash Flow And EBITDA Ppt PowerPoint Presentation Diagram Lists PDF to deliver an impeccable presentation. These templates will make your job of preparing presentations much quicker, yet still, maintain a high level of quality. Slidegeeks has experienced researchers who prepare these templates and write high quality content for you. Later on, you can personalize the content by editing the Nielsen Business Profile Earning Per Share Free Cash Flow And EBITDA Ppt PowerPoint Presentation Diagram Lists PDF.

Online Ads Strategic Plan For Effective Marketing Open Rate For Various Types Of Promotional Emails Diagrams PDF
This slide represents open rate for major types of email that are sent to customers by brand. It includes newsletters, RSS Rich Site Summary emails, autoresponders, triggered emails and welcome mails. Get a simple yet stunning designed Online Ads Strategic Plan For Effective Marketing Open Rate For Various Types Of Promotional Emails Diagrams PDF. It is the best one to establish the tone in your meetings. It is an excellent way to make your presentations highly effective. So, download this PPT today from Slidegeeks and see the positive impacts. Our easy to edit Online Ads Strategic Plan For Effective Marketing Open Rate For Various Types Of Promotional Emails Diagrams PDF can be your go to option for all upcoming conferences and meetings. So, what are you waiting for Grab this template today.
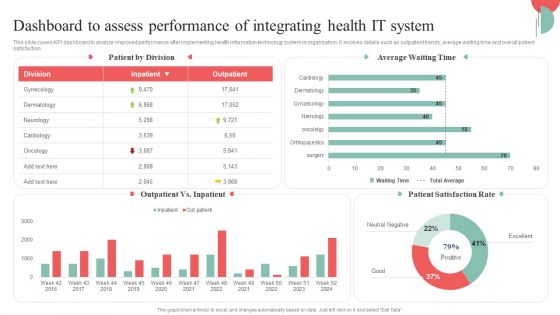
Incorporating HIS To Enhance Healthcare Services Dashboard To Assess Performance Of Integrating Health IT System Diagrams PDF
This slide covers KPI dashboard to analyze improved performance after implementing health information technology system in organization. It involves details such as outpatient trends, average waiting time and overall patient satisfaction. Create an editable Incorporating HIS To Enhance Healthcare Services Dashboard To Assess Performance Of Integrating Health IT System Diagrams PDF that communicates your idea and engages your audience. Whether youre presenting a business or an educational presentation, pre designed presentation templates help save time. Incorporating HIS To Enhance Healthcare Services Dashboard To Assess Performance Of Integrating Health IT System Diagrams PDF is highly customizable and very easy to edit, covering many different styles from creative to business presentations. Slidegeeks has creative team members who have crafted amazing templates. So, go and get them without any delay.
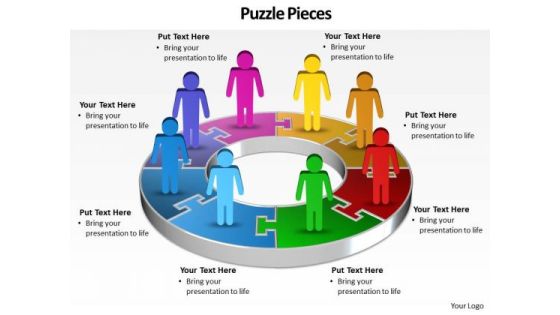
Ppt A Team Of Business People Standing On Pie PowerPoint Bar Chart Ks2 Pieces Templates
PPT a team of business people standing on pie powerpoint bar chart ks2 pieces Templates-This Business PowerPoint Diagram shows 3d linear abstraction to represent Business related issues. It uses three steps. It indicates employment, field, function, game, line, and livelihood. It is helpful to organize information. -PPT a team of business people standing on pie powerpoint bar chart ks2 pieces Templates-Abstract, Arrow, Art, Artistic, Background, Business, Colorful, Communication, Computer-Graphics, Concept, Creation, Data, Decoration, Decorative, Design, Design-Element, Digital, Direction, Effect, Elegance, Element, Energy, Flow, Go, Idea, Illustration, Modern, Movement, Network, Symbol

Artificial Intelligence Machine Learning Deep Learning Why Is AI Booming Now Ppt PowerPoint Presentation Slides Diagrams PDF
Presenting this set of slides with name artificial intelligence machine learning deep learning why is ai booming now ppt powerpoint presentation slides diagrams pdf. The topics discussed in these slides are organizations deploying ai, functional areas, global ai revenue forecast 2025, ranked case millions us dollar, penetration artificial intelligence skills. This is a completely editable PowerPoint presentation and is available for immediate download. Download now and impress your audience.

COVID 19 Mitigating Impact On High Tech Industry Spending On Risk Management By Different Industry Diagrams PDF
Presenting this set of slides with name covid 19 mitigating impact on high tech industry spending on risk management by different industry diagrams pdf. The topics discussed in these slides are total property premiums, property retained losses, total liability premiums, liability retained losses, total management liability costs, workers compensation retained losses, sales. This is a completely editable PowerPoint presentation and is available for immediate download. Download now and impress your audience.

COVID 19 Mitigating Impact On High Tech Industry COVID 19 Impact On Cloud Computing Market By Services Diagrams PDF
Presenting this set of slides with name covid 19 mitigating impact on high tech industry covid 19 impact on cloud computing market by services diagrams pdf. The topics discussed in these slides are market size, key factors driving growth, enterprises need, support remote workforce, business continuity tools and services. This is a completely editable PowerPoint presentation and is available for immediate download. Download now and impress your audience.
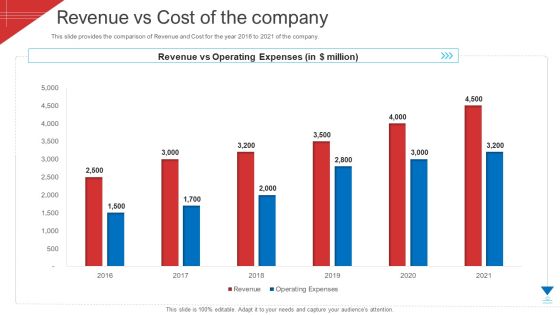
Investor Deck To Arrange Funds From Short Term Loan Revenue Vs Cost Of The Company Diagrams PDF
This slide provides the comparison of Revenue and Cost for the year 2016 to 2021 of the company. Deliver an awe inspiring pitch with this creative investor deck to arrange funds from short term loan revenue vs cost of the company diagrams pdf bundle. Topics like revenue vs operating expenses, revenue, operating expenses can be discussed with this completely editable template. It is available for immediate download depending on the needs and requirements of the user.

Pitch Deck Ppt Raise Funding Corporate Investors Use Of Funds In Different Areas By Percentage Diagrams PDF
This slide shows the uses of funds Reserve, Acquisition costs, Business Development, Innovation etc. of the company. Deliver and pitch your topic in the best possible manner with this pitch deck ppt raise funding corporate investors use of funds in different areas by percentage diagrams pdf. Use them to share invaluable insights on acquisitions, business development, product development and innovation and impress your audience. This template can be altered and modified as per your expectations. So, grab it now.

Net Earnings Of Our Company After Implementing Platform Model Resolving Chicken And Egg Problem In Organization Diagrams PDF
This slide covers the net earnings of our company which will be improved after implementing platform model within the organization. Deliver and pitch your topic in the best possible manner with this Net Earnings Of Our Company After Implementing Platform Model Resolving Chicken And Egg Problem In Organization Diagrams PDF Use them to share invaluable insights on Implementing Platform, Business Model, Linear Business and impress your audience. This template can be altered and modified as per your expectations. So, grab it now.

Flow Chart Demonstration Of Five Steps Business Plan Format PowerPoint Templates
We present our flow chart demonstration of five steps business plan format PowerPoint templates.Download our Business PowerPoint Templates because this slide can help to bullet point your views. Download and present our Boxes PowerPoint Templates because it is the time to bond with family, friends, colleagues and any other group of your choice. Download and present our Arrows PowerPoint Templates because this one depicts the popular chart. Download and present our Process and Flows PowerPoint Templates because they have fired the dreams of many fertile minds. Use our Shapes PowerPoint Templates because you have some excellent plans to spread some more of it across your community.Use these PowerPoint slides for presentations relating to Arrow, Background, Business, Chart, Diagram, Financial, Graphic, Gray, Icon, Illustration, Management, Orange, Perspective, Planning, Process, Stages, Steps, Text. The prominent colors used in the PowerPoint template are Blue navy, Gray, Black. We assure you our flow chart demonstration of five steps business plan format PowerPoint templates will make the presenter successul in his career/life. We assure you our Chart PowerPoint templates and PPT Slides are Sparkling. Customers tell us our flow chart demonstration of five steps business plan format PowerPoint templates are Luxuriant. Presenters tell us our Graphic PowerPoint templates and PPT Slides are specially created by a professional team with vast experience. They diligently strive to come up with the right vehicle for your brilliant Ideas. You can be sure our flow chart demonstration of five steps business plan format PowerPoint templates will make the presenter successul in his career/life. The feedback we get is that our Icon PowerPoint templates and PPT Slides will help you be quick off the draw. Just enter your specific text and see your points hit home.
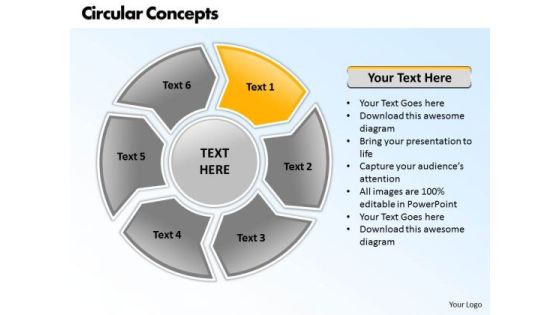
Ppt Circular Process 6 Scientific Method Steps PowerPoint Presentation Templates
PPT circular process 6 scientific method steps powerpoint presentation Templates-Use this PowerPoint Diagram to represent the layers of Circular Process model Graphically. It shows the first stage in an animated manner through orange color. You can change color, size and orientation of any icon to your liking.-PPT circular process 6 scientific method steps powerpoint presentation Templates-Arrow, Art, Blue, Business, Button, Circular, Clip, Design, Diagram, Drop, Element, Glowing, Graph, Graphic, Icon, Illustration, Isolated, Process, Round, Set, Shadow, Sphere, Symbol

Ppt Round Frame 7 Stages PowerPoint Templates
PPT round frame 7 stages PowerPoint Templates-This PowerPoint Diagram shows the Round Description of steps which are involved in development Process. It includes seven Stages. You can change color, size and orientation of any icon to your liking.-PPT round frame 7 stages PowerPoint Templates-Arrow, Art, Blue, Business, Button, Circular, Clip, Design, Diagram, Drop, Element, Glowing, Graph, Graphic, Icon, Illustration, Isolated, Process, Round, Set, Shadow, Sphere, Symbol
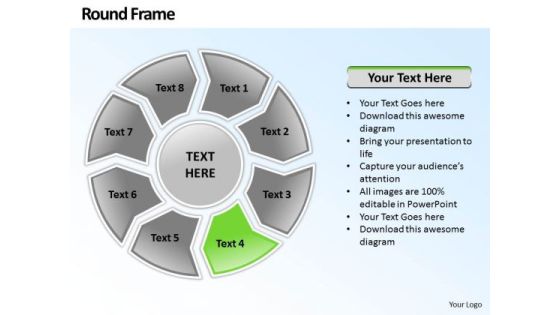
Ppt Round Frame 8 Stages PowerPoint Templates
PPT round frame 8 stages PowerPoint Templates-This PowerPoint Diagram shows the Round Implementation of steps which are involved in manufacturing Process. It includes eight Steps. You can change color, size and orientation of any icon to your liking.-PPT round frame 8 stages PowerPoint Templates-Arrow, Art, Blue, Business, Button, Circular, Clip, Design, Diagram, Drop, Element, Glowing, Graph, Graphic, Icon, Illustration, Isolated, Process, Round, Set, Shadow, Sphere, Symbol

Stock Photo Illustration Of Business Reports And Diagrams PowerPoint Slide
The above slide displays image of business charts and reports. Use this professionally designed image to make your message to be spread in a more effective manner. This can add up spice to corporate displays.
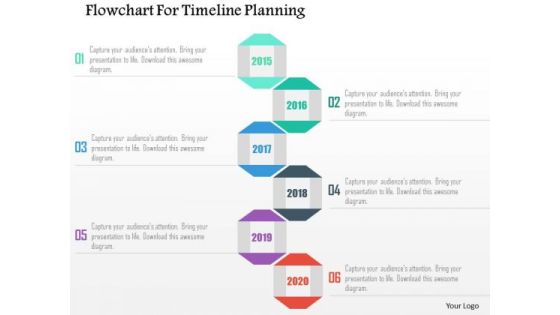
Business Diagram Flowchart For Timeline Planning PowerPoint Templates
Our above business slide contains graphics of flow chart. This flowchart may be used to display timeline planning. This slide is an excellent backdrop for you to enlighten your audience on the process.

Circle Diagram For Business Marketing Mix Powerpoint Slides
This PowerPoint template has been designed with nine steps circle chart. This PPT slide can be used to prepare presentations for profit growth report and also for financial data analysis. You can download finance PowerPoint template to prepare awesome presentations.
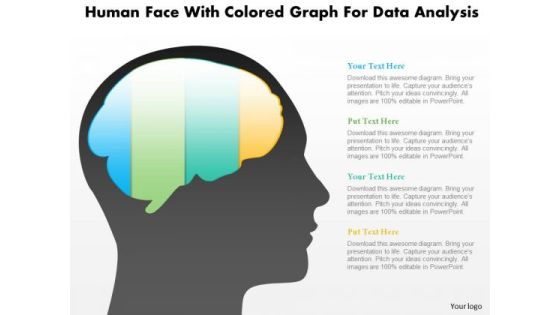
Business Diagram Human Face With Colored Graph For Data Analysis PowerPoint Slide
This diagram displays human face graphic with colored graph. This diagram can be used to represent strategy, planning, thinking of business plan. Display business options in your presentations by using this creative diagram.
Four Steps Circle With Social Media Icons Powerpoint Slides
This business slide illustrates four steps circle with social media icons. You may download this PowerPoint template to display social network and technology concepts. Chart the course you intend to take with this PPT slide.

7 Converging And Diverging Factors Process Flow Gear Chart PowerPoint Templates
We present our 7 converging and diverging factors process flow Gear Chart PowerPoint templates.Download our Leadership PowerPoint Templates because this diagram can be used to illustrate the logical path or system. Download and present our Circle Charts PowerPoint Templates because they have always been a source of inspiration for us all. Download and present our Arrows PowerPoint Templates because you can see In any endeavour people matter most. Use our Business PowerPoint Templates because this template helps you to grab the attention of your listeners. Download our Process and Flows PowerPoint Templates because like your thoughts arrows are inherently precise and true.Use these PowerPoint slides for presentations relating to Agreeable, Agreeableness, Art, Blue, Business, Chart, Circle, Clip, Clipart, Conscientiousness, Diagram, Extraversion, Factor, Five, Flow, Graph, Graphic, Green, Illustration, Model, Neuroticism, Openness, Personality, Pointed, Process, Psychological, Psychology, Red, Segment, Segmented, Shape. The prominent colors used in the PowerPoint template are Blue, Gray, Black. PowerPoint presentation experts tell us our 7 converging and diverging factors process flow Gear Chart PowerPoint templates are Exuberant. People tell us our Circle PowerPoint templates and PPT Slides are Adorable. People tell us our 7 converging and diverging factors process flow Gear Chart PowerPoint templates are Striking. Presenters tell us our Art PowerPoint templates and PPT Slides are Upbeat. Customers tell us our 7 converging and diverging factors process flow Gear Chart PowerPoint templates are Glamorous. The feedback we get is that our Chart PowerPoint templates and PPT Slides are Breathtaking.
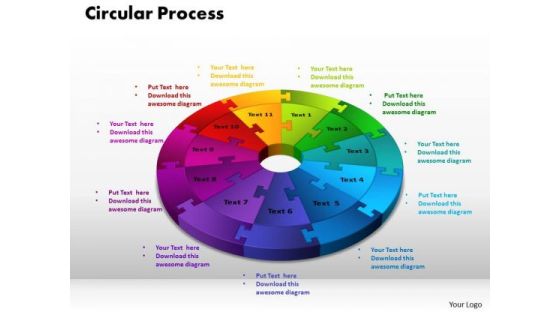
PowerPoint Design Circular Process Graphic Ppt Presentation
PowerPoint Design Circular Process Graphic PPT Presentation-This diagram includes 11 segments. This Diagram can be used in consulting presentations, strategic and management presentations.-PowerPoint Design Circular Process Graphic PPT Presentation
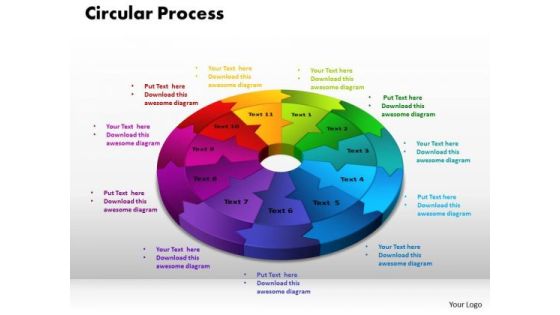
PowerPoint Design Circular Process Teamwork Ppt Backgrounds
PowerPoint Design Circular Process Teamwork PPT Backgrounds-This diagram is a flow diagram representing steps or actions in a process .They are used to emphasize direction of movement and interconnections of stages in a flow.-PowerPoint Design Circular Process Teamwork PPT Backgrounds

Flow Chart Demonstration Of Five Steps Online Business Plan Software PowerPoint Templates
We present our flow chart demonstration of five steps online business plan software PowerPoint templates.Download our Business PowerPoint Templates because you have a great plan to put the pieces together, getting all the various contributors to gel for a successful completion. Download our Boxes PowerPoint Templates because they will Amplify your views and plans for getting ahead and then the manner in which you intend staying ahead. Present our Arrows PowerPoint Templates because the atmosphere in the worplace is electric. Download and present our Process and Flows PowerPoint Templates because they help to lay the base of your trend of thought. Download our Shapes PowerPoint Templates because it explains the goals of each team and how you intend for each slice to contribute to the entire cake.Use these PowerPoint slides for presentations relating to Arrow, Background, Business, Chart, Diagram, Financial, Graphic, Gray, Icon, Illustration, Management, Orange, Perspective, Planning, Process, Stages, Steps, Text. The prominent colors used in the PowerPoint template are Blue navy, Gray, Black. We assure you our flow chart demonstration of five steps online business plan software PowerPoint templates are Fashionable. We assure you our Financial PowerPoint templates and PPT Slides are Ultra. Customers tell us our flow chart demonstration of five steps online business plan software PowerPoint templates are Fashionable. Presenters tell us our Icon PowerPoint templates and PPT Slides are Romantic. You can be sure our flow chart demonstration of five steps online business plan software PowerPoint templates are Bold. The feedback we get is that our Chart PowerPoint templates and PPT Slides are Elevated.
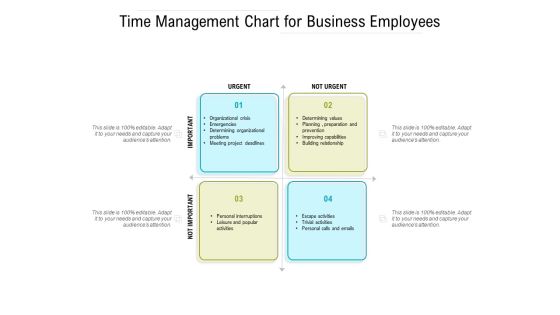
Time Management Chart For Business Employees Ppt Powerpoint Presentation Layouts Brochure Pdf
Presenting time management chart for business employees ppt powerpoint presentation layouts brochure pdf to dispense important information. This template comprises four stages. It also presents valuable insights into the topics including organizational crisis, determining organizational, meeting project deadlines, planning, preparation and prevention, building relationship. This is a completely customizable PowerPoint theme that can be put to use immediately. So, download it and address the topic impactfully.
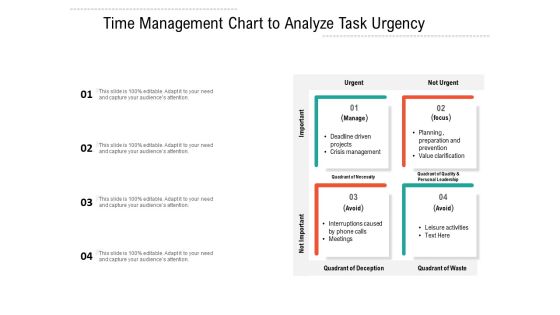
Time Management Chart To Analyze Task Urgency Ppt Powerpoint Presentation File Display Pdf
Presenting time management chart to analyze task urgency ppt powerpoint presentation file display pdf to dispense important information. This template comprises four stages. It also presents valuable insights into the topics including deadline driven projects, crisis management, planning, preparation and preventio, value clarification. This is a completely customizable PowerPoint theme that can be put to use immediately. So, download it and address the topic impactfully.

CRM Grid Chart With Attitude And Satisfaction Level Ppt PowerPoint Presentation Gallery Slide Download PDF
This slide represents the actions based on customer attitude and satisfaction levels such as shifting resources, fixing on priority etc. Presenting crm grid chart with attitude and satisfaction level ppt powerpoint presentation gallery slide download pdf to dispense important information. This template comprises four stages. It also presents valuable insights into the topics including fix on priority, keep improving, shift resources. This is a completely customizable PowerPoint theme that can be put to use immediately. So, download it and address the topic impactfully.

CRM Grid Chart With Customer Levels Ppt PowerPoint Presentation File Aids PDF
This slide represents the customer relationship matrix with different customer levels such as platinum, gold etc. Presenting crm grid chart with customer levels ppt powerpoint presentation file aids pdf to dispense important information. This template comprises four stages. It also presents valuable insights into the topics including platinum customer, silver customer, bronze customer. This is a completely customizable PowerPoint theme that can be put to use immediately. So, download it and address the topic impactfully.

CRM Grid Chart With Loyal Customers Ppt PowerPoint Presentation File Topics PDF
This slide represents the customer segments such as loyal customers, diversified customers etc. based on existing and new customers and products. Presenting crm grid chart with loyal customers ppt powerpoint presentation file topics pdf to dispense important information. This template comprises four stages. It also presents valuable insights into the topics including loyal customers, extend customers, new customers. This is a completely customizable PowerPoint theme that can be put to use immediately. So, download it and address the topic impactfully.
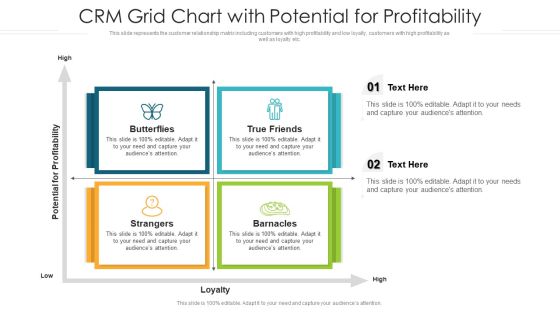
CRM Grid Chart With Potential For Profitability Ppt PowerPoint Presentation File Inspiration PDF
This slide represents the customer relationship matrix including customers with high profitability and low loyalty, customers with high profitability as well as loyalty etc. Presenting crm grid chart with potential for profitability ppt powerpoint presentation file inspiration pdf to dispense important information. This template comprises four stages. It also presents valuable insights into the topics including butterflies, strangers, barnacles. This is a completely customizable PowerPoint theme that can be put to use immediately. So, download it and address the topic impactfully.
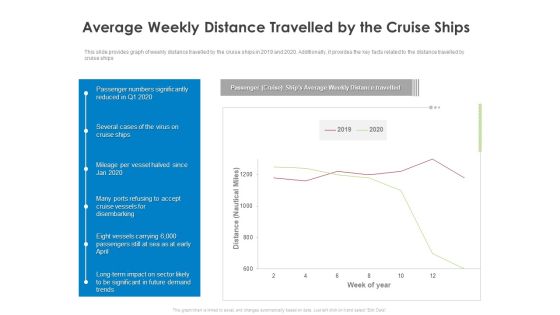
COVID 19 Risk Analysis Mitigation Policies Ocean Liner Sector Average Weekly Distance Travelled By The Cruise Ships Diagrams PDF
This slide provides graph of weekly distance travelled by the cruise ships in 2019 and 2020. Additionally, it provides the key facts related to the distance travelled by cruise ships. Deliver an awe inspiring pitch with this creative covid 19 risk analysis mitigation policies ocean liner sector average weekly distance travelled by the cruise ships diagrams pdf bundle. Topics like average weekly distance travelled by the cruise ships can be discussed with this completely editable template. It is available for immediate download depending on the needs and requirements of the user.
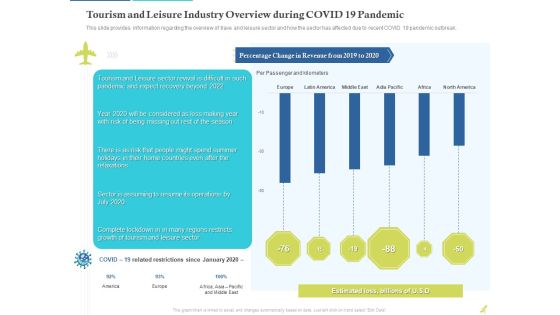
Rebuilding Travel Industry After COVID 19 Tourism And Leisure Industry Overview During COVID 19 Pandemic Diagrams PDF
This slide provides information regarding the overview of trave and leisure sector and how the sector has affected due to recent COVID 19 pandemic outbreak.Deliver an awe inspiring pitch with this creative rebuilding travel industry after COVID 19 tourism and leisure industry overview during covid 19 pandemic diagrams pdf. bundle. Topics like percentage change in revenue from 2019 to 2020, estimated loss, billions can be discussed with this completely editable template. It is available for immediate download depending on the needs and requirements of the user.

Team Performance Improvement Functional Optimization Through Agile Methodologies Agile Project Status Dashboard With Story Details Diagrams PDF
The following slide shows Agile Project Status Dashboard with project summary, story details, possible risks and mitigation strategies, team velocity, project status, percentage of budget spent etc. Deliver and pitch your topic in the best possible manner with this team performance improvement functional optimization through agile methodologies agile project status dashboard with story details diagrams pdf. Use them to share invaluable insights on agile project status dashboard with story details and impress your audience. This template can be altered and modified as per your expectations. So, grab it now.

Utilization Of Current Techniques To Improve Efficiency Case Competition ADC Cosmetics Company Dashboard With Variables Diagrams PDF
This slide shows a cosmetics and skin care sales dashboard with KPIs such as Profit Margin in 2021, Cross Selling Rate , Market Size , Stock Turnover Rate , Social Media Usage, Revenue etc.Deliver and pitch your topic in the best possible manner with this utilization of current techniques to improve efficiency case competition adc cosmetics company dashboard with variables diagrams pdf. Use them to share invaluable insights on profit margin 2021, cross selling rate 2021, social media usage 2021 and impress your audience. This template can be altered and modified as per your expectations. So, grab it now.
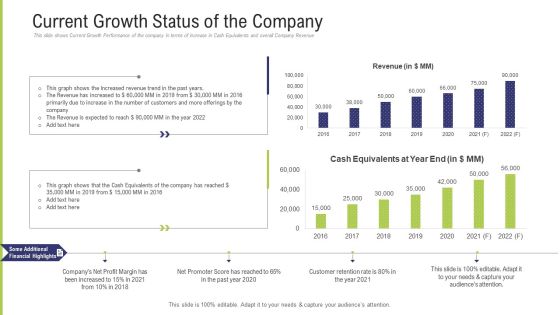
Funding Pitch Deck To Obtain Long Term Debt From Banks Current Growth Status Of The Company Diagrams PDF
This slide shows Current Growth Performance of the company in terms of increase in Cash Equivalents and overall Company Revenue. Deliver and pitch your topic in the best possible manner with this funding pitch deck to obtain long term debt from banks current growth status of the company diagrams pdf. Use them to share invaluable insights on revenue, cash equivalents, financial highlights, profit margin, customer retention rate and impress your audience. This template can be altered and modified as per your expectations. So, grab it now.
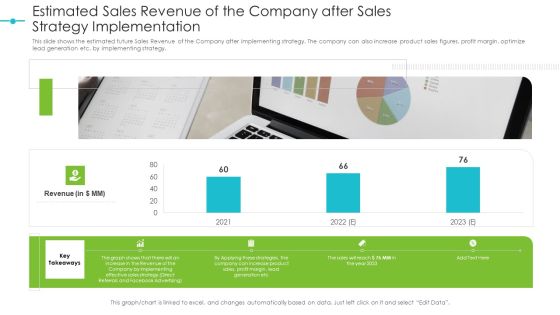
Tools For Improving Sales Plan Effectiveness Estimated Sales Revenue Of The Company After Sales Strategy Implementation Diagrams PDF
This slide shows the estimated future Sales Revenue of the Company after implementing strategy. The company can also increase product sales figures, profit margin, optimize lead generation etc. by implementing strategy. Deliver an awe inspiring pitch with this creative tools for improving sales plan effectiveness estimated sales revenue of the company after sales strategy implementation diagrams pdf bundle. Topics like strategy, implementing, effective, sales, revenue can be discussed with this completely editable template. It is available for immediate download depending on the needs and requirements of the user.

Skill Shortage In A Production Firm Case Study Solution Revenue Of NSS Electronic Manufacturing Company For 5 Years Diagrams PDF
This slide shows a graph of declining Revenue of NSS Electronic Manufacturing Company for past 5 years 2017-2021. Additionally, this slide provides key reasons for the decline Skilled Labor Shortage, Decline in Production Volumes, Decline on Companys Overall productivity etc. Deliver an awe inspiring pitch with this creative skill shortage in a production firm case study solution revenue of NSS electronic manufacturing company for 5 years diagrams pdf bundle. Topics like revenue, manufacturing, companys overall productivity, 2017 to 2021 can be discussed with this completely editable template. It is available for immediate download depending on the needs and requirements of the user.

Construction Sector Project Risk Management Stages In Bim Process At Which Safety Personnel Get Involved Diagrams PDF
This slide covers Stages in the BIM Process at Which Construction Safety Professionals Get Involves along with Variation by Use of Prefabrication or Modularization. Deliver and pitch your topic in the best possible manner with this construction sector project risk management stages in bim process at which safety personnel get involved diagrams pdf. Use them to share invaluable insights on process, mechanical, organizations, businesses, modularization and impress your audience. This template can be altered and modified as per your expectations. So, grab it now.

Digital Edibles Distribution Capital Funding Pitch Deck Top Market Players In On Demand Online Food Delivery Platforms Diagrams PDF
This slide shows the major top players of the On Demand Online Food Delivery Service Industry across globe along with their relative market share in percentage. Deliver and pitch your topic in the best possible manner with this digital edibles distribution capital funding pitch deck top market players in on demand online food delivery platforms diagrams pdf. Use them to share invaluable insights on top market players in on demand online food delivery platforms and impress your audience. This template can be altered and modified as per your expectations. So, grab it now.
Improving Brand Awareness Through WOM Marketing Dashboard For Tracking Marketing Activities At Social Media Platform Diagrams PDF
This slide covers information regarding the dashboard for tracking essential marketing activities at social media platform in terms of social traffic and conversion, referral traffic by site, key social media metrics. Deliver an awe inspiring pitch with this creative improving brand awareness through wom marketing dashboard for tracking marketing activities at social media platform diagrams pdf bundle. Topics like dashboard for tracking marketing activities at social media platform can be discussed with this completely editable template. It is available for immediate download depending on the needs and requirements of the user.

New Service Launch And Development Strategy To Gain Market Share Global Market Sizing For New Service Diagrams PDF
This slide showcases market sizing that can help organization to estimate the profit and revenue potential before launching new service. Its key components are market size, estimated growth and target market.Deliver and pitch your topic in the best possible manner with this New Service Launch And Development Strategy To Gain Market Share Global Market Sizing For New Service Diagrams PDF Use them to share invaluable insights on Global Market, Sizing, New Service and impress your audience. This template can be altered and modified as per your expectations. So, grab it now.
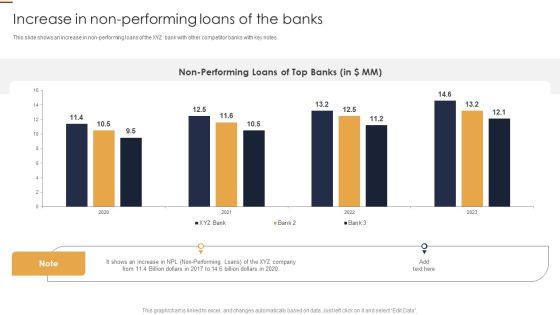
Increase In Non Performing Loans Of The Banks Credit Risk Analysis Model For Banking Institutions Diagrams PDF
This slide shows an increase in non-performing loans of the XYZ bank with other competitor banks with key notes.Want to ace your presentation in front of a live audience Our Increase In Non Performing Loans Of The Banks Credit Risk Analysis Model For Banking Institutions Diagrams PDF can help you do that by engaging all the users towards you.. Slidegeeks experts have put their efforts and expertise into creating these impeccable powerpoint presentations so that you can communicate your ideas clearly. Moreover, all the templates are customizable, and easy-to-edit and downloadable. Use these for both personal and commercial use.

Business PowerPoint Examples Slides Presentation Diagrams Templates
We present our business powerpoint examples slides presentation diagrams templates.Use our Arrows PowerPoint Templates because You can Connect the dots. Fan expectations as the whole picture emerges. Use our Business PowerPoint Templates because Our PowerPoint Templates and Slides are created with admirable insight. Use them and give your group a sense of your logical mind. Use our Process and Flows PowerPoint Templates because Our PowerPoint Templates and Slides offer you the needful to organise your thoughts. Use them to list out your views in a logical sequence. Download and present our Marketing PowerPoint Templates because Our PowerPoint Templates and Slides help you meet the demand of the Market. Just browse and pick the slides that appeal to your intuitive senses. Use our Shapes PowerPoint Templates because Our PowerPoint Templates and Slides will fulfill your every need. Use them and effectively satisfy the desires of your audience.Use these PowerPoint slides for presentations relating to Arrow, business, button, chart, circles, collaboration, combination, combine, combined, communication, cooperation, diagram, direction, financial, flow, flowchart, funnel, graph, graphic, icon, illustration, individual, information, ingredients, mix, people, pictogram, presentation, process, product, progress, spout, strategy. The prominent colors used in the PowerPoint template are Green, White, Gray. People tell us our business powerpoint examples slides presentation diagrams templates have awesome images to get your point across. PowerPoint presentation experts tell us our combine PowerPoint templates and PPT Slides will get their audience's attention. Presenters tell us our business powerpoint examples slides presentation diagrams templates will make the presenter look like a pro even if they are not computer savvy. Use our circles PowerPoint templates and PPT Slides are readymade to fit into any presentation structure. Customers tell us our business powerpoint examples slides presentation diagrams templates will get their audience's attention. People tell us our combined PowerPoint templates and PPT Slides will generate and maintain the level of interest you desire. They will create the impression you want to imprint on your audience.

Homogeneous Arrow Process 9 Stages Change Order Flow Chart PowerPoint Templates
We present our homogeneous arrow process 9 stages change order flow chart PowerPoint templates.Use our Arrows PowerPoint Templates because,You have the basic goal in mind. Use our Shapes PowerPoint Templates because,This business powerpoint template helps expound on the logic of your detailed thought process to take your company forward. Use our Signs PowerPoint Templates because, This diagram has the unique ability to drive home your ideas and show how they mesh to guarantee success. Use our Business PowerPoint Templates because, It will demonstrate the strength of character under severe stress. Shine the torch ahead and bring the light to shine on all Use our Process and Flows PowerPoint Templates because,This helps in epitomised the values of teamwork.Use these PowerPoint slides for presentations relating to advertising, arrow, background, banner, business, chart, colorful, diagram, direction, element, financial, flow, gradient, illustration, isolated, marketing, mirrored, placeholderm, presentation, process, steps, success. The prominent colors used in the PowerPoint template are Green, Blue, Black. People tell us our homogeneous arrow process 9 stages change order flow chart PowerPoint templates are Fun. The feedback we get is that our diagram PowerPoint templates and PPT Slides are Luxuriant. People tell us our homogeneous arrow process 9 stages change order flow chart PowerPoint templates are Dynamic. Presenters tell us our diagram PowerPoint templates and PPT Slides will make the presenter look like a pro even if they are not computer savvy. The feedback we get is that our homogeneous arrow process 9 stages change order flow chart PowerPoint templates are One-of-a-kind. Professionals tell us our diagram PowerPoint templates and PPT Slides are Excellent.
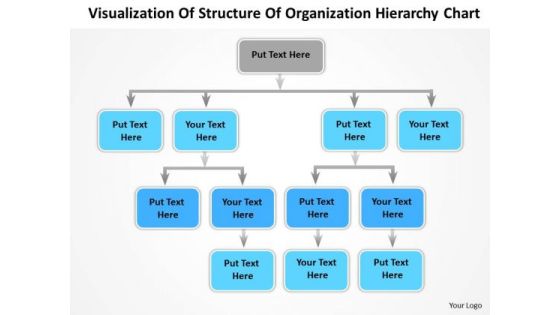
Timeline Visualization Of Structure Of Organization Hierarchy Chart
Timeline crunches are a fact of life. Meet all deadlines using our Timeline Visualization Of Structure Of Organization Hierarchy Chart. Connect the dots using our Timeline Visualization Of Structure Of Organization Hierarchy Chart. Fan expectations as the whole picture emerges.
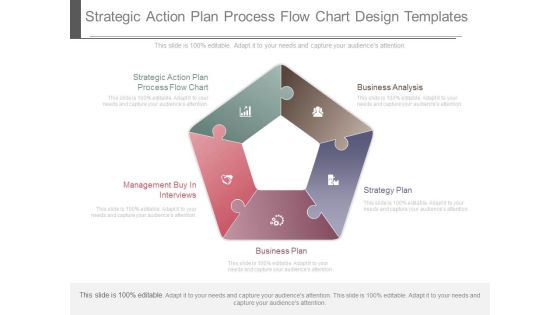
Strategic Action Plan Process Flow Chart Design Templates
This is a strategic action plan process flow chart design templates. This is a five stage process. The stages in this process are strategic action plan process flow chart, management buy in interviews, business analysis, strategy plan, business plan.
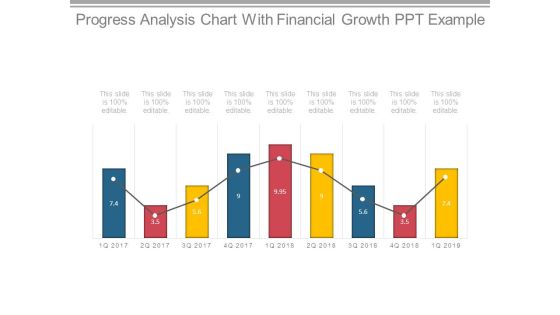
Progress Analysis Chart With Financial Growth Ppt Example
This is a progress analysis chart with financial growth ppt example. This is a nine stage process. The stages in this process are chart, years, business, growth, marketing, management.
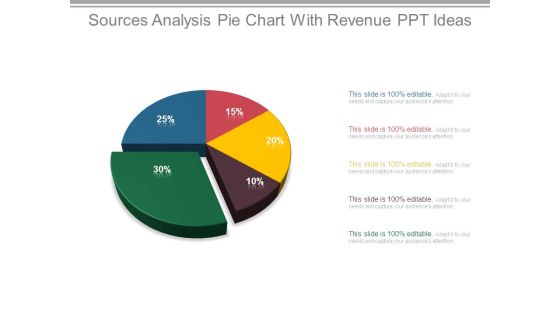
Sources Analysis Pie Chart With Revenue Ppt Ideas
This is a sources analysis pie chart with revenue ppt ideas. This is a five stage process. The stages in this process are finance, success, business, marketing, percentage, pie chart.

Money Raised With Growth Bar Chart Powerpoint Shapes
This is a money raised with growth bar chart powerpoint shapes. This is a nine stage process. The stages in this process are bar chart, growth, business, success, management.
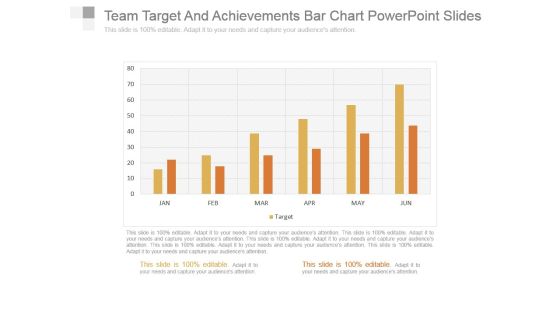
Team Target And Achievements Bar Chart Powerpoint Slides
This is a team target and achievements bar chart powerpoint slides. This is a six stage process. The stages in this process are business, success, graph chart, strategy, marketing.
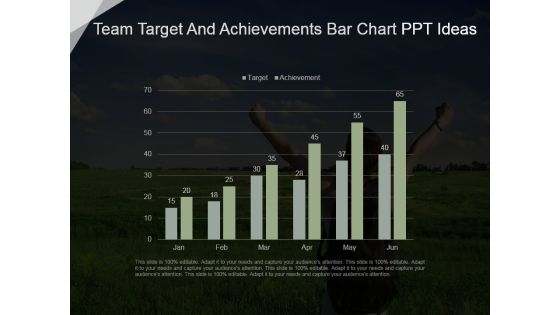
Team Target And Achievements Bar Chart Ppt Ideas
This is a team target and achievements bar chart ppt ideas. This is a six stage process. The stages in this process are business, marketing, graph chart, success, strategy.

Pie Chart For Evaluating Business Success Ppt PowerPoint Presentation Inspiration
This is a pie chart for evaluating business success ppt powerpoint presentation inspiration. This is a three stage process. The stages in this process are business, strategy, marketing, analysis, pie chart.

X Bar And R Chart Ppt PowerPoint Presentation Background Designs
This is a x bar and r chart ppt powerpoint presentation background designs. This is a two stage process. The stages in this process are chart, business, marketing, strategy, success.
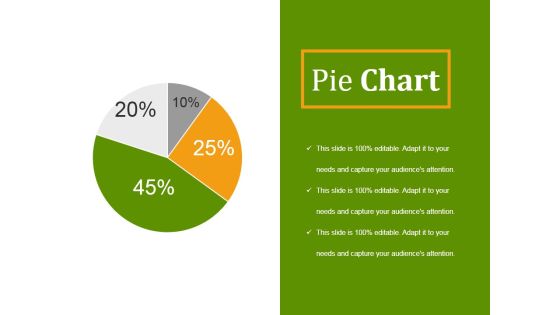
Pie Chart Template 2 Ppt PowerPoint Presentation Portfolio
This is a pie chart template 2 ppt powerpoint presentation portfolio. This is a four stage process. The stages in this process are pie chart, process, management, marketing, strategy.
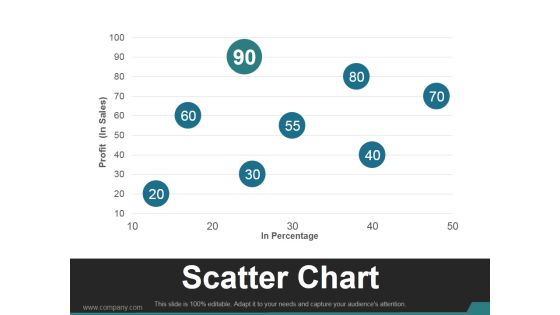
Scatter Chart Template 2 Ppt PowerPoint Presentation Slides
This is a scatter chart template 2 ppt powerpoint presentation slides. This is a eight stage process. The stages in this process are business, marketing, scatter chart, profit, management.
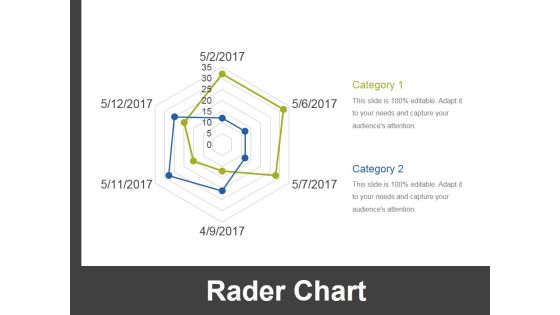
Rader Chart Ppt PowerPoint Presentation Pictures Slide Portrait
This is a rader chart ppt powerpoint presentation pictures slide portrait. This is a two stage process. The stages in this process are rader chart, management, analysis, strategy, business.

Scatter Chart Ppt PowerPoint Presentation Pictures Slide Download
This is a scatter chart ppt powerpoint presentation pictures slide download. This is a two stage process. The stages in this process are scatter chart, finance, analysis, marketing, business.

Stacked Line Chart Ppt PowerPoint Presentation Ideas Example File
This is a stacked line chart ppt powerpoint presentation ideas example file. This is a two stage process. The stages in this process are stacked line chart, growth, analysis, business, success.

Combo Chart Ppt PowerPoint Presentation Infographics Example Topics
This is a combo chart ppt powerpoint presentation infographics example topics. This is a eight stage process. The stages in this process are business, marketing, growth, combo chart, management.

Competitive Analysis Scatter Chart Ppt PowerPoint Presentation Layouts Layout
This is a competitive analysis scatter chart ppt powerpoint presentation layouts layout. This is a six stage process. The stages in this process are business, marketing, success, chart, management.
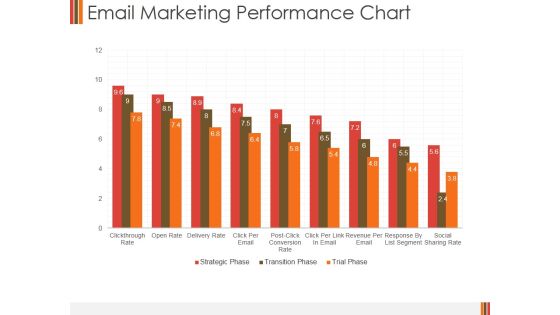
Email Marketing Performance Chart Ppt PowerPoint Presentation Portfolio Inspiration
This is a email marketing performance chart ppt powerpoint presentation portfolio inspiration. This is a nine stage process. The stages in this process are business, finance, marketing, performance chart, strategy, analysis.

Radar Chart Ppt PowerPoint Presentation Layouts Infographic Template
This is a radar chart ppt powerpoint presentation layouts infographic template. This is a two stage process. The stages in this process are business, marketing, product, radar chart, strategy.

Bar Chart Ppt PowerPoint Presentation Infographics Designs Download
This is a bar chart ppt powerpoint presentation infographics designs download. This is a twelve stage process. The stages in this process are bar chart, business, marketing, strategy, success.

Scatter Bubble Chart Ppt PowerPoint Presentation Show Tips
This is a scatter bubble chart ppt powerpoint presentation show tips. This is a two stage process. The stages in this process are scatter bubble chart, finance, marketing, strategy, business.
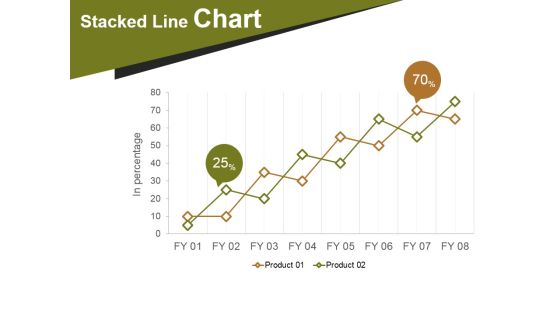
Stacked Line Chart Template 2 Ppt PowerPoint Presentation Rules
This is a stacked line chart template 2 ppt powerpoint presentation rules. This is a two stage process. The stages in this process are stacked line chart, in percentage, product.

Bubble Chart Ppt PowerPoint Presentation Layouts Design Ideas
This is a bubble chart ppt powerpoint presentation layouts design ideas. This is a eight stage process. The stages in this process are in percentage, profit, bubble chart, business, marketing.

Combo Chart Ppt PowerPoint Presentation Summary Design Templates
This is a combo chart ppt powerpoint presentation summary design templates. This is a four stage process. The stages in this process are units sold, product, combo chart, years, planning.

Donut Pie Chart Ppt PowerPoint Presentation Summary Guide
This is a donut pie chart ppt powerpoint presentation summary guide. This is a four stage process. The stages in this process are pie chart, marketing, strategy, finance, analysis, business.

Our Graphs And Charts Ppt PowerPoint Presentation Infographics Infographics
This is a our graphs and charts ppt powerpoint presentation infographics infographics. This is a one stage process. The stages in this process are business, strategy, analysis, pretention, chart and graph.

Bubble Chart Ppt PowerPoint Presentation Portfolio Visual Aids
This is a bubble chart ppt powerpoint presentation portfolio visual aids. This is a three stage process. The stages in this process are bubble chart, product, business, marketing, success.

Donut Pie Chart Ppt PowerPoint Presentation Summary Guidelines
This is a donut pie chart ppt powerpoint presentation summary guidelines. This is a four stage process. The stages in this process are product, donut pie chart, process, business, marketing.

Pie Chart Ppt PowerPoint Presentation Visual Aids Layouts
This is a pie chart ppt powerpoint presentation visual aids layouts. This is a five stage process. The stages in this process are pie chart, business, marketing, success, strategy.

Column Chart Template 1 Ppt PowerPoint Presentation Professional Backgrounds
This is a column chart template 1 ppt powerpoint presentation professional backgrounds. This is a nine stage process. The stages in this process are column chart, product, growth, strategy, analysis, business.

Column Chart Template 2 Ppt PowerPoint Presentation Professional Slide
This is a column chart template 2 ppt powerpoint presentation professional slide. This is a nine stage process. The stages in this process are column chart, product, growth, strategy, analysis, business.

Scatter Chart Ppt PowerPoint Presentation Portfolio File Formats
This is a scatter chart ppt powerpoint presentation portfolio file formats. This is a one stage process. The stages in this process are scatter chart, finance, success, management, business.

Pie Chart Ppt PowerPoint Presentation Summary Master Slide
This is a pie chart ppt powerpoint presentation summary master slide. This is a five stage process. The stages in this process are product, pie chart, process, business, marketing.

Stacked Line Chart Ppt PowerPoint Presentation Outline Examples
This is a stacked line chart ppt powerpoint presentation outline examples. This is a two stage process. The stages in this process are product, stacked line chart, business, marketing, profit.
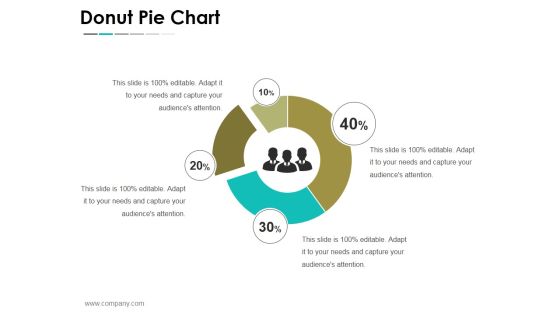
Donut Pie Chart Ppt PowerPoint Presentation File Slideshow
This is a donut pie chart ppt powerpoint presentation file slideshow. This is a four stage process. The stages in this process are business, strategy, analysis, planning, donut pie chart.
