Phases

Bar Chart Ppt PowerPoint Presentation Outline Guidelines
This is a bar chart ppt powerpoint presentation outline guidelines. This is a four stage process. The stages in this process are product, unit count, in years, graph, finance, business.

Column Chart Ppt PowerPoint Presentation Summary Graphics
This is a column chart ppt powerpoint presentation summary graphics. This is a nine stage process. The stages in this process are product, years, expenditure in billions, graph, business.

Combo Chart Ppt PowerPoint Presentation Summary Layouts
This is a combo chart ppt powerpoint presentation summary layouts. This is a eight stage process. The stages in this process are product, sales in percentage, in years, in price, graph.

Scatter Chart Ppt PowerPoint Presentation Ideas Templates
This is a scatter chart ppt powerpoint presentation ideas templates. This is a nine stage process. The stages in this process are y values, x values, product, graph, business.

Bar Chart Ppt PowerPoint Presentation Styles Outfit
This is a bar chart ppt powerpoint presentation styles outfit. This is a Seven stage process. The stages in this process are sales in percentage, financial years, graph, business.

Scatter Chart Ppt PowerPoint Presentation Summary Smartart
This is a scatter chart ppt powerpoint presentation summary smartart. This is a nine stage process. The stages in this process are y values, x values, product, business, graph.

Area Chart Ppt PowerPoint Presentation Model Examples
This is a area chart ppt powerpoint presentation model examples. This is a two stage process. The stages in this process are year profit in dollars, business, strategy, growth.

Scatter Chart Ppt PowerPoint Presentation Slides Summary
This is a scatter chart ppt powerpoint presentation slides summary. This is a nine stage process. The stages in this process are sales in percentage, growth, graph, business, marketing.

Combo Chart Ppt PowerPoint Presentation Summary Slides
This is a combo chart ppt powerpoint presentation summary slides. This is a three stage process. The stages in this process are market size, product, growth rate, bar graph, success.

Area Chart Ppt PowerPoint Presentation Layouts Maker
This is a area chart ppt powerpoint presentation layouts maker. This is a two stage process. The stages in this process are financial year, sales in percentage, graph, business, marketing.

Combo Chart Ppt PowerPoint Presentation Styles Objects
This is a combo chart ppt powerpoint presentation styles objects. This is a three stage process. The stages in this process are market size growth rate, growth, business, marketing, graph.
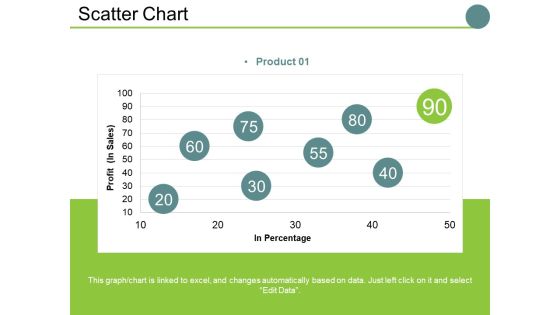
Scatter Chart Ppt PowerPoint Presentation Slides Examples
This is a scatter chart ppt powerpoint presentation slides examples. This is a one stage process. The stages in this process are profit , in percentage, business, marketing, finance, graph.

Area Chart Ppt PowerPoint Presentation Professional Brochure
This is a area chart ppt powerpoint presentation professional brochure. This is a two stage process. The stages in this process are sales in percentage, business, marketing, finance, graph.

Column Chart Ppt PowerPoint Presentation Slides Smartart
This is a column chart ppt powerpoint presentation slides smartart. This is a two stage process. The stages in this process are sales in percentage, financial year in, business, growth, strategy.

Combo Chart Ppt PowerPoint Presentation Guide
This is a combo chart ppt powerpoint presentation guide. This is a three stage process. The stages in this process are market size, growth rate, business, growth, graph, strategy.
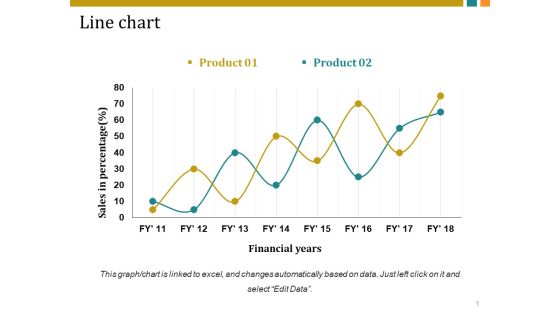
Line Chart Ppt PowerPoint Presentation Inspiration Vector
This is a line chart ppt powerpoint presentation inspiration vector. This is a two stage process. The stages in this process are sales in percentage, financial years, business, marketing, growth.

Combo Chart Ppt PowerPoint Presentation Pictures Shapes
This is a combo chart ppt powerpoint presentation pictures shapes. This is a three stage process. The stages in this process are market size, growth rate, business, marketing, graph.

Area Chart Ppt PowerPoint Presentation Summary Show
This is a area chart ppt powerpoint presentation summary show. This is a two stage process. The stages in this process are sales in percentage, financial year, business, marketing, finance.

Column Chart Ppt PowerPoint Presentation Gallery Background
This is a column chart ppt powerpoint presentation gallery background. This is a two stage process. The stages in this process are product, sales in percentage, financial year, graph, success.

Combo Chart Ppt PowerPoint Presentation Show Elements
This is a combo chart ppt powerpoint presentation show elements. This is a three stage process. The stages in this process are in price, in years, business, marketing, growth.

Line Chart Ppt PowerPoint Presentation Pictures Templates
This is a line chart ppt powerpoint presentation pictures templates. This is a two stage process. The stages in this process are sales in percentage, financial years, business, marketing, growth.

Combo Chart Ppt PowerPoint Presentation Inspiration Background
This is a combo chart ppt powerpoint presentation inspiration background. This is a three stage process. The stages in this process are product, bar graph, market size, growth, growth rate.

Column Chart Ppt PowerPoint Presentation Infographics Deck
This is a column chart ppt powerpoint presentation infographics deck. This is a two stage process. The stages in this process are product, expenditure in, years, bar graph, growth.

area chart ppt powerpoint presentation professional elements
This is a area chart ppt powerpoint presentation professional elements. This is a two stage process. The stages in this process are financial year sales in percentage, business, marketing, graph.

Bar Chart Ppt PowerPoint Presentation File Slide
This is a bar chart ppt powerpoint presentation file slide. This is a one stage process. The stages in this process are sales in percentage financial years, business, marketing, strategy, graph.

Column Chart Ppt PowerPoint Presentation Layouts Tips
This is a column chart ppt powerpoint presentation layouts tips. This is a six stage process. The stages in this process are sales in percentage, financial year, bar graph, growth, success.

Column Chart Ppt PowerPoint Presentation Outline Styles
This is a column chart ppt powerpoint presentation outline styles. This is a two stage process. The stages in this process are sales in percentage, financial year in, business, marketing, graph.

Combo Chart Ppt PowerPoint Presentation Show Influencers
This is a combo chart ppt powerpoint presentation show influencers. This is a three stage process. The stages in this process are product, bar graph, growth, growth rate, market size.
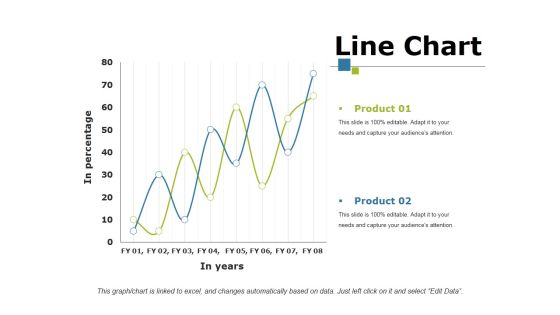
Line Chart Ppt PowerPoint Presentation Portfolio Mockup
This is a line chart ppt powerpoint presentation portfolio mockup. This is a two stage process. The stages in this process are product, in percentage, in year, growth, success.

Combo Chart Ppt PowerPoint Presentation Gallery Layout
This is a combo chart ppt powerpoint presentation gallery layout. This is a three stage process. The stages in this process are business, marketing, graph, market size, growth rate.

Column Chart Ppt PowerPoint Presentation File Summary
This is a column chart ppt powerpoint presentation file summary. This is a two stage process. The stages in this process are product, dollars, in years, bar graph, growth.

Area Chart Ppt PowerPoint Presentation Summary Information
This is a area chart ppt powerpoint presentation summary information. This is a two stage process. The stages in this process are business, sales in percentage, percentage, marketing, graph.

Combo Chart Ppt PowerPoint Presentation Ideas Professional
This is a combo chart ppt powerpoint presentation ideas professional. This is a three stage process. The stages in this process are business, marketing, market size, growth rate, graph.

Area Chart Ppt PowerPoint Presentation File Visuals
This is a area chart ppt powerpoint presentation file visuals. This is a two stage process. The stages in this process are business, sales in percentage, marketing, graph, strategy, finance.

Line Chart Ppt PowerPoint Presentation Professional Portfolio
This is a line chart ppt powerpoint presentation professional portfolio. This is a two stage process. The stages in this process are business, marketing, profit, percentage, graph, strategy, finance.

Area Chart Ppt PowerPoint Presentation Pictures Vector
This is a area chart ppt powerpoint presentation pictures vector. This is a two stage process. The stages in this process are sales in percentage, business, marketing, graph, percentage.

Line Chart Ppt PowerPoint Presentation Outline Ideas
This is a line chart ppt powerpoint presentation outline ideas. This is a two stage process. The stages in this process are business, marketing, financial years, sales in percentage, strategy.

Bar Chart Ppt PowerPoint Presentation Model Sample
This is a bar chart ppt powerpoint presentation model sample. This is a two stage process. The stages in this process are sales in percentage, business, marketing, graph, percentage, year.

Column Chart Ppt PowerPoint Presentation Infographics Guidelines
This is a column chart ppt powerpoint presentation infographics guidelines. This is a two stage process. The stages in this process are product, expenditure in, years, business, bar graph.

Column Chart Ppt PowerPoint Presentation Show Structure
This is a column chart ppt powerpoint presentation show structure. This is a two stage process. The stages in this process are business, financial year in, sales in percentage, marketing, graph.

Combo Chart Ppt PowerPoint Presentation Pictures Summary
This is a combo chart ppt powerpoint presentation pictures summary. This is a three stage process. The stages in this process are product, market size, growth rate, bar graph, success.

Bar Chart Ppt PowerPoint Presentation Layouts Template
This is a bar chart ppt powerpoint presentation layouts template. This is a two stage process. The stages in this process are financial year, sales in percentage, business, marketing, finance.

Area Chart Ppt PowerPoint Presentation Model Demonstration
This is a area chart ppt powerpoint presentation model demonstration. This is a two stage process. The stages in this process are business, marketing, financial year, in percentage, graph.

Control Chart Ppt PowerPoint Presentation Infographics Slide
This is a control chart ppt powerpoint presentation infographics slide. This is a two stage process. The stages in this process are normal variation due to chance, abnormal variation due to assignable sources, average range or quality.

3d Graphical Illustration Of 5 Stages Flow Chart Cycle Motion Process PowerPoint Templates
We present our 3d graphical illustration of 5 stages flow chart Cycle Motion Process PowerPoint templates.Download our Circle charts PowerPoint Templates because you can Present your views on the methods using our self-explanatory templates. Present our Arrows PowerPoint Templates because you are the star of your enlightened team. Download and present our Flow charts PowerPoint Templates because they are Gauranteed to focus the minds of your team. Download and present our Business PowerPoint Templates because your product has established a foothold in the market. Customers are happy with the value it brings to their lives. Download our Shapes PowerPoint Templates because with the help of our Slides you can Illustrate your plans to your listeners with the same accuracy.Use these PowerPoint slides for presentations relating to circle, commute, commuting, converge, diverge, fast, illustration infinity, iron, isolated, journey, locomotive, move, passage, passenger, path, rail railroad, railway, ring, road, route, speed, splint, station, steel, streak, strip, track, traintraintrack, tram, transit, transport, transportation, travel, travelling, turn, vacation vintage, voyage. The prominent colors used in the PowerPoint template are Gray, Black, White. You can be sure our 3d graphical illustration of 5 stages flow chart Cycle Motion Process PowerPoint templates are Dynamic. The feedback we get is that our infinity PowerPoint templates and PPT Slides are Luxurious. Customers tell us our 3d graphical illustration of 5 stages flow chart Cycle Motion Process PowerPoint templates are Playful. You can be sure our diverge PowerPoint templates and PPT Slides will make the presenter successul in his career/life. The feedback we get is that our 3d graphical illustration of 5 stages flow chart Cycle Motion Process PowerPoint templates are Nifty. You can be sure our infinity PowerPoint templates and PPT Slides are Flirty.
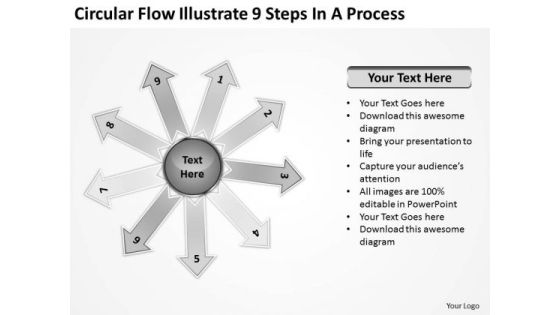
Circular Flow Illustrate 9 Steps In Process Arrow Chart PowerPoint Slides
We present our circular flow illustrate 9 steps in process Arrow Chart PowerPoint Slides.Use our Arrows PowerPoint Templates because you are the star of your enlightened team. Present our Circle Charts PowerPoint Templates because it gives you really bright ideas. Present our Shapes PowerPoint Templates because this template helps you to motivate each and every one of your group to give it his very best. Present our Ring Charts PowerPoint Templates because you have the product you are very confident of and are very sure it will prove immensely popular with clients all over your target areas. Present our Business PowerPoint Templates because you can Lead your flock steadily to greater heights. Look around at the vast potential of achievement around you.Use these PowerPoint slides for presentations relating to ahead, aim, aqua, arrow, back, backward, blue, circle, colorful, converge, converging, course, direction, diverge, diverging, green, header, illustration, left, move, movement, orange, orientation, point, red, right, ring, round, trend, vector, way, yellow. The prominent colors used in the PowerPoint template are Gray, Black, White. PowerPoint presentation experts tell us our circular flow illustrate 9 steps in process Arrow Chart PowerPoint Slides are Colorful. PowerPoint presentation experts tell us our aqua PowerPoint templates and PPT Slides look good visually. Presenters tell us our circular flow illustrate 9 steps in process Arrow Chart PowerPoint Slides are Detailed. Presenters tell us our colorful PowerPoint templates and PPT Slides are effectively colour coded to prioritise your plans They automatically highlight the sequence of events you desire. You can be sure our circular flow illustrate 9 steps in process Arrow Chart PowerPoint Slides are Gorgeous. We assure you our circle PowerPoint templates and PPT Slides are Cheerful.
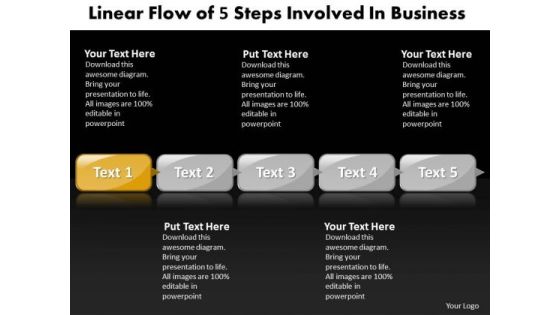
Ppt Continuous Demo Create Flow Chart PowerPoint Of Steps Templates
PPT continuous demo create flow chart powerpoint of steps Templates-The above diagram helps to highlight the key components of your entire business process. Communicate your concerns and educate your team along the path to success. This diagram has the unique ability to drive home your ideas and show how they mesh to guarantee success.-PPT continuous demo create flow chart powerpoint of steps Templates-Accent, Advertisement, Arrow, Badge, Banner, Blank, Business, Collection, Decoration, Design, Direction, Element, Empty, Financial, Flow, Graph, Horizontal, Instruction, Isolated, Label, Manual, Menu, Message, Placard, Process, Promo, Promotion, Sale, Set, Shape
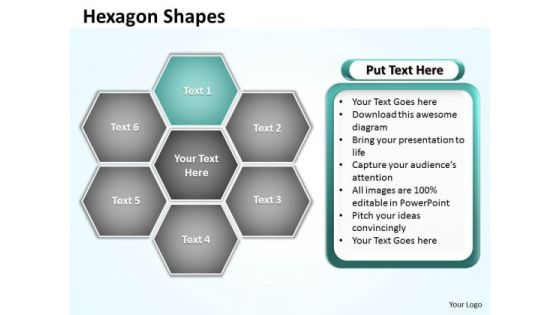
Ppt Hexagon Angles Chart Editable PowerPoint Templates 2010 Business
PPT hexagon angles chart editable powerpoint templates 2010 Business-Use this diagram as a method of graphically representing the flow of data as an information processing system. Use this PPT to represent data that is easy to comprehend and analyze. This PowerPoint diagram can be used in strategy, consulting and marketing presentations. You can apply other 3D Styles and shapes to the slide to enhance your presentations.-PPT hexagon angles chart editable powerpoint templates 2010 Business-Abstract, Background, Design, Digital, Elements, Graphic, Grey, Hexagon, Illustration, Light, Modern, Perspective, Triangles, Shapes, Shiny, Style, Technology, Template, Vector, Vertical, Virtual, Wallpaper, Web
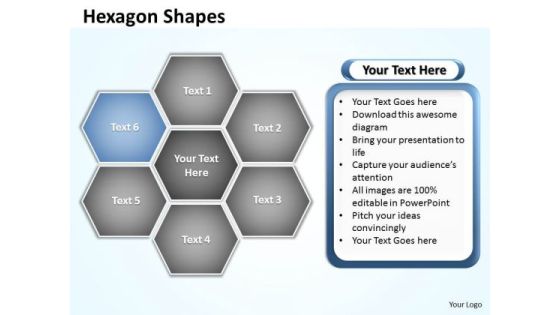
Ppt Hexagon Shapes Chart Editable PowerPoint Templates 2003 Business
PPT hexagon shapes chart editable powerpoint templates 2003 Business-Using this Business PowerPoint Diagram you can explain the relevance of the different layers and stages in getting down to your core competence, ability and desired result. There is a bucketful of brilliant ideas swirling around within your group. Hence this diagram has the unique ability to drive home your ideas and show how they mesh to guarantee success.-PPT hexagon shapes chart editable powerpoint templates 2003 Business-Abstract, Background, Design, Digital, Elements, Graphic, Grey, Hexagon, Illustration, Light, Modern, Perspective, Triangles, Shapes, Shiny, Style, Technology, Template, Vector, Vertical, Virtual, Wallpaper, Web

Ppt Complex Flow Process Network Diagram PowerPoint Template Templates
PPT complex flow process network diagram powerpoint template Templates-This diagram helps business and technical users in quickly document complex structures, systems and processes. The structure of this template allows you to effectively highlight the key issues concerning the growth of your business.-PPT complex flow process network diagram powerpoint template Templates-Advice, Analyze, Arrow, Background, Business, Chart, Concept, Creativity, Decision, Design, Determination, Diagram, Draw, Education, Flowchart, Graphic, Idea, Means, Method, Office, Plan, Pointing, Presentation, Process, Sign, Strategy, Technology

Timeline Ppt Template 4 Staged Circular Business Diagram
Our Timeline Ppt Template 4 Staged Circular Business Diagram Powerpoint Templates Abhor Doodling. They Never Let The Interest Flag. Our Circle Charts Powerpoint Templates Make Good Beasts Of Burden. Place All Your Demands On Them.

Timeline Ppt Template 7 Staged Flower Petal Diagram
Make Some Dough With Our Timeline Ppt Template 7 Staged Flower Petal Diagram Powerpoint Templates. Your Assets Will Rise Significantly. Your Approach Is Truly Down To Earth. Our Practical Circle Charts Powerpoint Templates Are Apt For You.
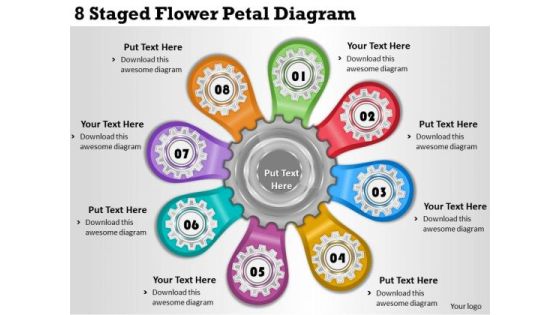
Timeline Ppt Template 8 Staged Flower Petal Diagram
Be The Dramatist With Our Timeline Ppt Template 8 Staged Flower Petal Diagram Powerpoint Templates. Script Out The Play Of Words. Put Our Circle Charts Powerpoint Templates Into The Draw. Your Thoughts Will Win The Lottery.

Business Diagram Circle For Six Steps Of Agenda PowerPoint Templates
This power point template has been designed with graphic of circular chart. This diagram may help to depict marketing agenda. Illustrate your chain of ideas with this high quality business slide.
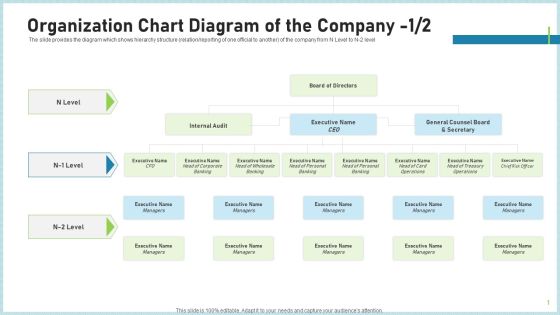
Pitch Deck To Attract Funding After IPO Market Organization Chart Diagram Of The Company Level Elements PDF
The slide provides the diagram which shows hierarchy structure relation or reporting of one official to another of the company from N Level to N 2 level Presenting pitch deck to attract funding after ipo market organization chart diagram of the company level elements pdf to provide visual cues and insights. Share and navigate important information on three stages that need your due attention. This template can be used to pitch topics like internal audit, executive name, general counsel board. In addtion, this PPT design contains high resolution images, graphics, etc, that are easily editable and available for immediate download.

New Business PowerPoint Presentation Plan Circular Flow Spoke Chart Templates
We present our new business powerpoint presentation plan Circular Flow Spoke Chart templates.Download and present our Business PowerPoint Templates because you have analysed many global markets and come up with possibilities. Highlight the pros and cons of other likely business oppurtunities. Download and present our Circle Charts PowerPoint Templates because these slides are the triggers of our growth. Download and present our Shapes PowerPoint Templates because support groups are an essential element of the on going struggle against cancer. Present our Arrows PowerPoint Templates because you can Churn the wheels of the brains of your colleagues. Present our Process and Flows PowerPoint Templates because you can Educate your team with the attention to be paid.Use these PowerPoint slides for presentations relating to Arrows, Blank, Business, Central, Centralized, Chart, Circle, Circular, Circulation, Concept, Conceptual, Converging, Design, Diagram, Empty, Executive, Icon, Idea, Illustration, Management, Map, Mapping, Model, Numbers, Organization, Outwards, Pointing, Procedure, Process, Radial, Radiating, Relationship, Resource, Sequence, Sequential, Seven, Square, Strategy, Template. The prominent colors used in the PowerPoint template are Green, Gray, Black. We assure you our new business powerpoint presentation plan Circular Flow Spoke Chart templates will generate and maintain the level of interest you desire. They will create the impression you want to imprint on your audience. We assure you our Circle PowerPoint templates and PPT Slides will save the presenter time. Customers tell us our new business powerpoint presentation plan Circular Flow Spoke Chart templates are Radiant. Presenters tell us our Circle PowerPoint templates and PPT Slides are Spiffy. You can be sure our new business powerpoint presentation plan Circular Flow Spoke Chart templates are Flirty. The feedback we get is that our Chart PowerPoint templates and PPT Slides are Awesome.
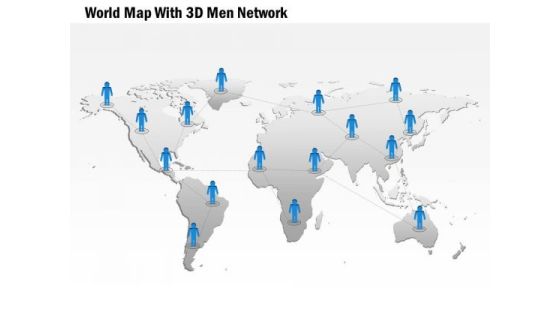
Business Diagram World Map With 3d Men Network Presentation Template
This image displays world map with 3d men network. This conceptual image depicts 3d people standing on world map in a network. Use this image in presentations, related to Social Networks. Enhance the quality of your presentation with this awesome diagram.

Cloud Network Diagram With Percentage Data Powerpoint Slides
This PowerPoint template contains graphics of cloud network diagram with percentage values. You may download this PPT slide design to display cloud network and financial strategy. You can easily customize this template to make it more unique as per your need.

Introduction To Ecommerce Business Pros And Cons Diagram Slides
This is a introduction to ecommerce business pros and cons diagram slides. This is a three stage process. The stages in this process are ecommerce pros and cons, pros, cons, highly scalable, unlimited income potential, large amount of orders, order to process, customer services and fulfillment, stocking and shipping.

Improve Employee Satisfaction Motivation Ppt PowerPoint Presentation Portfolio Diagrams Cpb
Presenting this set of slides with name improve employee satisfaction motivation ppt powerpoint presentation portfolio diagrams cpb. This is a four stage process. The stages in this process are improve employee satisfaction motivation. This is a completely editable PowerPoint presentation and is available for immediate download. Download now and impress your audience.


 Continue with Email
 Sign up for an account
 Home
Home