Phases

Core Organizational Values Diagram Presentation Visuals
This is a core organizational values diagram presentation visuals. This is a four stage process. The stages in this process are peoples, integrity, innovation, shared prosperity.

Retail Conversion Strategy Diagram Ppt Infographics
This is a retail conversion strategy diagram ppt infographics. This is a five stage process. The stages in this process are sharing, browsing, buying, researching, evaluating.

Sales Channel Improvement Strategy Diagram Ppt Slides
This is a sales channel improvement strategy diagram ppt slides. This is a five stage process. The stages in this process are knowledge, measurement, passion, role, tools.

Content Marketing Tools Diagram Powerpoint Slide Backgrounds
This is a content marketing tools diagram powerpoint slide backgrounds. This is a four stage process. The stages in this process are social content, measure, refine, improve.

Fund Management Responsibilities Diagram Ppt Presentation
This is a fund management responsibilities diagram ppt presentation. This is a two stage process. The stages in this process are implementation, liability management, return generation.

Relevance Of Managerial Accounting Diagram Ppt Slides
This is a relevance of managerial accounting diagram ppt slides. This is a four stage process. The stages in this process are planning, strategy, positioning, budgets.
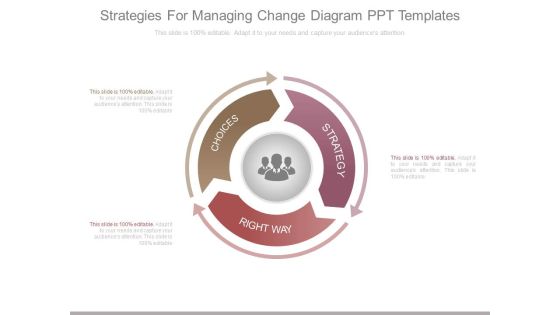
Strategies For Managing Change Diagram Ppt Templates
This is a strategies for managing change diagram ppt templates. This is a three stage process. The stages in this process are choices, strategy, right way.
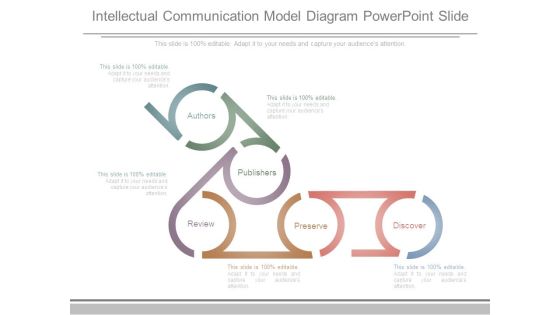
Intellectual Communication Model Diagram Powerpoint Slide
This is a intellectual communication model diagram powerpoint slide. This is a five stage process. The stages in this process are authors, publishers, review, preserve, discover.
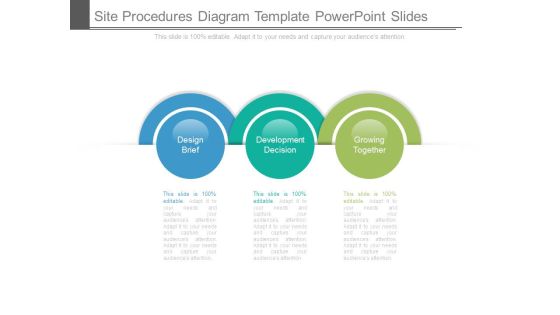
Site Procedures Diagram Template Powerpoint Slides
This is a site procedures diagram template powerpoint slides. This is a three stage process. The stages in this process are design brief, development decision, growing together.
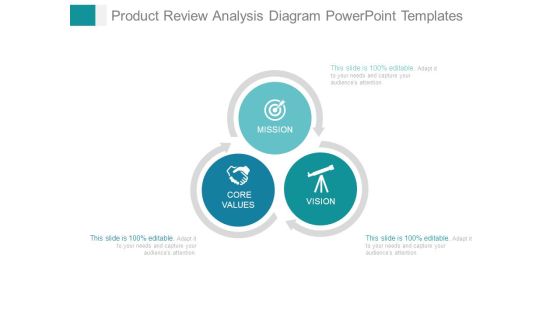
Product Review Analysis Diagram Powerpoint Templates
This is a product review analysis diagram powerpoint templates. This is a three stage process. The stages in this process are mission, core values, vision.
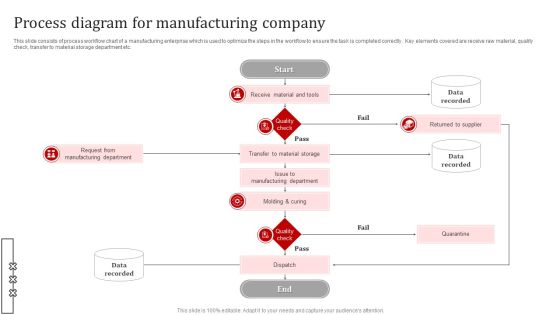
Process Diagram For Manufacturing Company Information PDF
This slide consists of process workflow chart of a manufacturing enterprise which is used to optimize the steps in the workflow to ensure the task is completed correctly . Key elements covered are receive raw material, quality check, transfer to material storage department etc. Presenting Process Diagram For Manufacturing Company Information PDF to dispense important information. This template comprises one stages. It also presents valuable insights into the topics including Request From Manufacturing Department, Quarantine, Transfer To Material Storage, Molding And Curing. This is a completely customizable PowerPoint theme that can be put to use immediately. So, download it and address the topic impactfully.
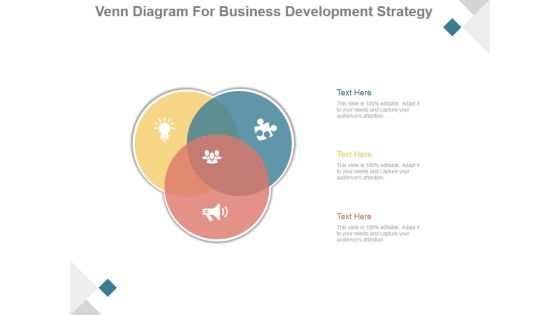
Venn Diagram For Business Development Strategy Ppt PowerPoint Presentation Guidelines
This is a venn diagram for business development strategy ppt powerpoint presentation guidelines. This is a three stage process. The stages in this process are business, venn, icons, management, strategy.

Stock Photo 3d Chart With Six Stages PowerPoint Slide
Use this image slide to provide information about a process or task to the relevant audience. This image presents 3d chart with six stages. This diagram is designed to attract the attention of your audience.
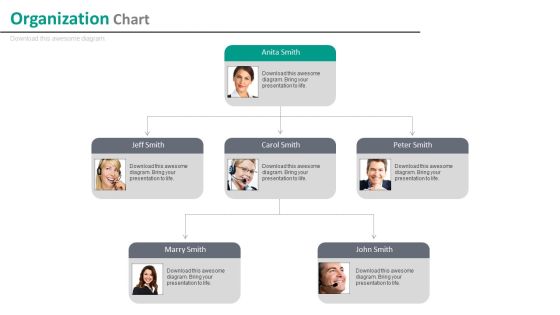
Company Employees Organizational Chart With Profiles Powerpoint Slides
Our compelling template consists with diagram of employee?s organizational chart with profiles. This slide has been professionally designed to display organizational structure and team hierarchy. This template offers an excellent background to build impressive presentation.

PowerPoint Templates Diagram 3d Puzzle Process Ppt Slide
PowerPoint templates Diagram 3D Puzzle Process PPT Slide-Puzzle diagram is a visual tool that allows you to create and visualize a sales process. -PowerPoint templates Diagram 3D Puzzle Process PPT Slide
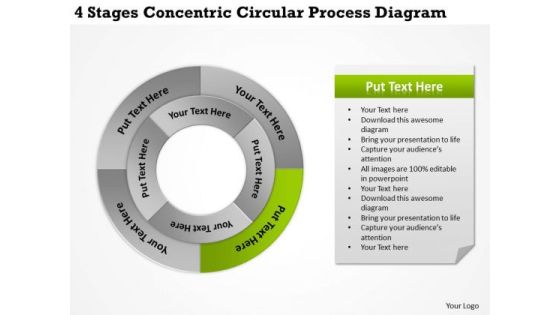
Business Strategy Implementation Circular Process Diagram Company
We present our business strategy implementation circular process diagram company.Download and present our Marketing PowerPoint Templates because Our PowerPoint Templates and Slides are designed to help you succeed. They have all the ingredients you need. Download and present our Business PowerPoint Templates because You can Be the puppeteer with our PowerPoint Templates and Slides as your strings. Lead your team through the steps of your script. Use our Process and Flows PowerPoint Templates because Our PowerPoint Templates and Slides are the chords of your song. String them along and provide the lilt to your views. Download our Shapes PowerPoint Templates because Our PowerPoint Templates and Slides come in all colours, shades and hues. They help highlight every nuance of your views. Use our Circle Charts PowerPoint Templates because Our PowerPoint Templates and Slides provide you with a vast range of viable options. Select the appropriate ones and just fill in your text. Use these PowerPoint slides for presentations relating to Abstract, Access, Background, Banner, Blue, Bright, Business, Chart, Circle, Color, Colorful, Concept, Conceptual, Connection, Corporate, Creative, Cycle, Design, Different, Element, Empty, Form, Frame, Graphic, Green, Group, Idea, Illustration, Match, Message, Order, Part, Piece, Place, Process, Red, Shape, Solution, Special, Speech, Strategy, Symbol, Template, Text. The prominent colors used in the PowerPoint template are Green, Gray, Black.
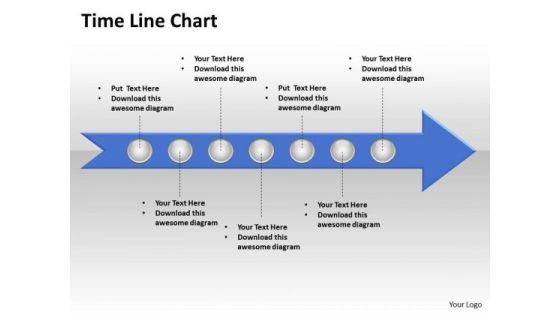
Ppt Circular Motion PowerPoint Process Time Line Chart Editable Templates
PPT circular motion powerpoint process time line chart editable Templates-Use this Time Line Chart Diagram to represent steps included in process. This PowerPoint Diagram shows the circles in the Arrow which is pointing towards East Direction. You can use these circles to symbolize step by step Execution.-PPT circular motion powerpoint process time line chart editable Templates
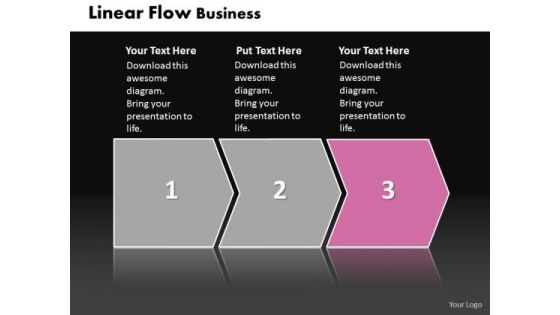
Ppt Linear Flow Business PowerPoint Presentation Communication Chart Templates
PPT linear flow business powerpoint presentation communication chart Templates-This Linear Flow diagram can be used to provide a clear representation of any business function. Highlight the depth of your thoughts with our attractive PPT design-PPT linear flow business powerpoint presentation communication chart Templates-3d, Arrow, Background, Banner, Business, Chart, Colorful, Diagram, Direction, Element, Financial, Flow, Gradient, Illustration, Isolated, Mirrored, Placeholder, Presentation, Process, Steps

Ppt Linear Flow Process Charts Illustration Stages Of PowerPoint Templates
PPT linear flow process charts illustration stages of PowerPoint Templates-Above diagram will help you visualize and structure information. Present your views using this innovative slide and be assured of leaving a lasting impression.-PPT linear flow process charts illustration stages of PowerPoint Templates-3d, Arrow, Background, Banner, Business, Chart, Colorful, Diagram, Direction, Element, Financial, Flow, Gradient, Illustration, Isolated, Mirrored, Placeholder, Presentation, Process, Steps

SEO Audit Summary To Increase Top Level Areas In An SEO Audit Report On Page Analysis Diagrams PDF
The slide shows the top-level areas that an SEO Auditor must focus on and needs to perform effectively and efficiently in order to analyze keywords, gain competitors insight, improve technical aspects, improve rankings etc. This slide provides information about On-Page Analysis in SEO Audit. This is a SEO Audit Summary To Increase Top Level Areas In An SEO Audit Report On Page Analysis Diagrams PDF template with various stages. Focus and dispense information on seven stages using this creative set, that comes with editable features. It contains large content boxes to add your information on topics like Individual Page, General Content, Duplicate Content. You can also showcase facts, figures, and other relevant content using this PPT layout. Grab it now.

10 Diverging Stages Planning Process Diagram Cycle Network PowerPoint Templates
We present our 10 diverging stages planning process diagram Cycle Network PowerPoint templates.Use our Ring Charts PowerPoint Templates because this Layout can explain the relevance of the different layers and stages in getting down to your core competence, ability and desired result. Use our Flow charts PowerPoint Templates because to achieve sureshot success you need to come together at the right time, place and manner. Use our Process and flows PowerPoint Templates because you can Show them the way, be Captain of the ship and lead them to new shores. Download our Business PowerPoint Templates because you can Flutter your wings and enchant the world. Impress them with the innate attractiveness of your thoughts and words. Download our Arrows PowerPoint Templates because you have some hits, you had some misses.Use these PowerPoint slides for presentations relating to Business, catalog, chart, circle, concept, conceptual, conference, connection, corporate, description, design, development, diagram, goal, graphic, idea, illustration, item, management, marketing, mind, mind map, model, navigation, organization, parts, plans, presentation, process, reports, solutions, strategy, success, target. The prominent colors used in the PowerPoint template are Pink, Black, Gray. You can be sure our 10 diverging stages planning process diagram Cycle Network PowerPoint templates are Attractive. Presenters tell us our conceptual PowerPoint templates and PPT Slides are Elevated. We assure you our 10 diverging stages planning process diagram Cycle Network PowerPoint templates are Precious. Customers tell us our chart PowerPoint templates and PPT Slides are Wistful. Presenters tell us our 10 diverging stages planning process diagram Cycle Network PowerPoint templates will make you look like a winner. You can be sure our connection PowerPoint templates and PPT Slides are Fashionable.
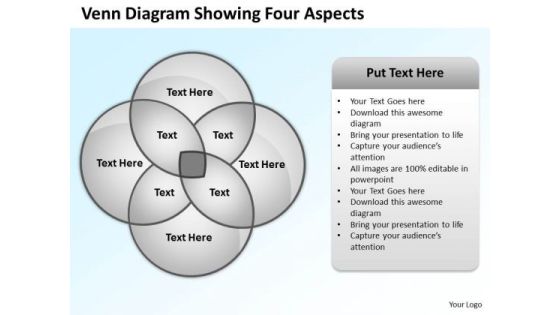
Business Intelligence Architecture Diagram Showing Four Aspects Ppt PowerPoint Slides
We present our business intelligence architecture diagram showing four aspects ppt PowerPoint Slides.Present our Process and Flows PowerPoint Templates because It will Raise the bar of your Thoughts. They are programmed to take you to the next level. Use our Flow Charts PowerPoint Templates because Your audience will believe you are the cats whiskers. Download our Future PowerPoint Templates because Our PowerPoint Templates and Slides will help you be quick off the draw. Just enter your specific text and see your points hit home. Download and present our Business PowerPoint Templates because It will get your audience in sync. Download our Circle Charts PowerPoint Templates because You can Create a matrix with our PowerPoint Templates and Slides. Feel the strength of your ideas click into place.Use these PowerPoint slides for presentations relating to Algorithm, architecture, black, blue, business, chart, computer, cylinder, dark, data, data warehouse, database, design, development, diagram, dimensional, engineering, flowchart, glow, glowing, graphic, information, intelligence, logic, model, plan, relation, render, server, software, structure, table, technology. The prominent colors used in the PowerPoint template are Gray, Black, White. People tell us our business intelligence architecture diagram showing four aspects ppt PowerPoint Slides will impress their bosses and teams. PowerPoint presentation experts tell us our black PowerPoint templates and PPT Slides are designed to make your presentations professional. Presenters tell us our business intelligence architecture diagram showing four aspects ppt PowerPoint Slides are designed to make your presentations professional. Use our black PowerPoint templates and PPT Slides have awesome images to get your point across. Customers tell us our business intelligence architecture diagram showing four aspects ppt PowerPoint Slides are designed to make your presentations professional. People tell us our chart PowerPoint templates and PPT Slides will impress their bosses and teams.

PowerPoint Design Diagram Circular Arrow Ppt Design
PowerPoint Design Diagram Circular Arrow PPT Design-The Circle of Life - a concept emmbedded in our minds and hence easy to comprehend. Life and Business is made up of processes comprising stages that flow from one to another. An excellent graphic to attract the attention of and understanding by your audience to improve earnings.-PowerPoint Design Diagram Circular Arrow PPT Design
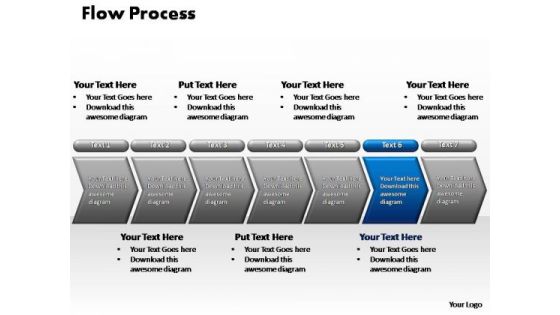
PowerPoint Template Diagram Flow Process Ppt Slide
PowerPoint Template Diagram Flow Process PPT Slide-PowerPoint Presentation Growth Flow Process PPT Designs-Explore the various directions and layers existing in your in your plans and processes. Unravel the desired and essential elements of your overall strategy. Explain the relevance of the different layers and stages and directions in getting down to your core competence, ability and desired result.-PowerPoint Template Diagram Flow Process PPT Slide

PowerPoint Template Diagram Flow Process Ppt Slides
PowerPoint Template Diagram Flow Process PPT Slides-PowerPoint Presentation Growth Flow Process PPT Designs-Explore the various directions and layers existing in your in your plans and processes. Unravel the desired and essential elements of your overall strategy. Explain the relevance of the different layers and stages and directions in getting down to your core competence, ability and desired result.-PowerPoint Template Diagram Flow Process PPT Slides
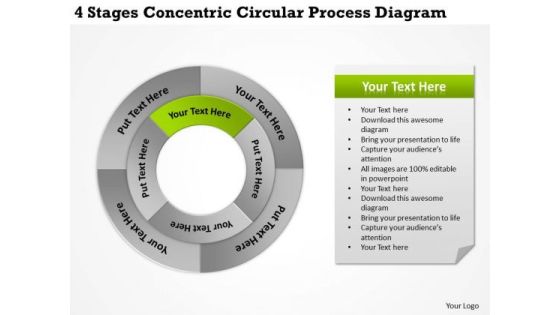
Business Plan And Strategy Concentric Circular Process Diagram Policy
We present our business plan and strategy concentric circular process diagram policy.Present our Circle Charts PowerPoint Templates because Our PowerPoint Templates and Slides offer you the needful to organise your thoughts. Use them to list out your views in a logical sequence. Download our Ring Charts PowerPoint Templates because Our PowerPoint Templates and Slides will let Your superior ideas hit the target always and everytime. Present our Process and Flows PowerPoint Templates because Our PowerPoint Templates and Slides will provide weight to your words. They will bring out the depth of your thought process. Download our Flow Charts PowerPoint Templates because Our PowerPoint Templates and Slides will give good value for money. They also have respect for the value of your time. Present our Marketing PowerPoint Templates because You will get more than you ever bargained for. Use these PowerPoint slides for presentations relating to Art, basic, business, capital, chart, circle, clip, clipart, colorful, conglomerates,consumer, cyclical, energy, financial, goods, graph, graphic, healthcare,illustration, infographic, information, investment, isolated, market, materials, non,pie, round, sectors, services, stock, technology, text, transparency, transportation,utilities, wheel, white. The prominent colors used in the PowerPoint template are Green lime, Black, Gray.
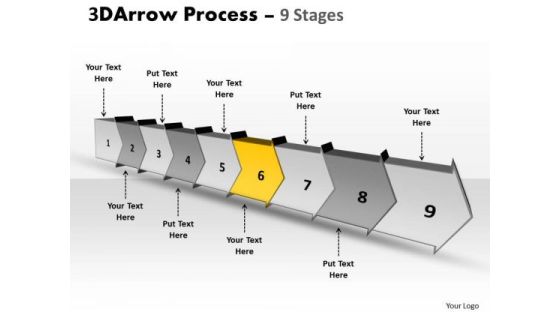
Ppt Template Continous Free Concept Flow Process Charts Diagram 7 Image
We present our PPT template continuous free concept flow process charts diagram 7 Image. Use our Success PowerPoint Templates because, Cycle Template: - Rolling along while gathering profits along the way is the aim. Use our Arrows PowerPoint Templates because, Our Template designs are State of the Art. Use our Business PowerPoint Templates because; transmit your passion via our creative templates. Use our Shapes PowerPoint Templates because; Take your team along by explaining your plans. Use our Symbol PowerPoint Templates because; Lead the way to spread good cheer to one and all. Use these PowerPoint slides for presentations relating to Advertisement, Arrow, Badge, Bread, Crumbs, Business, Button, Collection, Decoration, Design, Direction, Financial, Flow, Gradient, Graph, Green, Grey, Label, Menu, Message, Nobody, Placard, Process, Push, Retail, Round, Sale, Set, Shape, Shiny, Silver, Steps, Symbol. The prominent colors used in the PowerPoint template are Yellow, Gray, and White
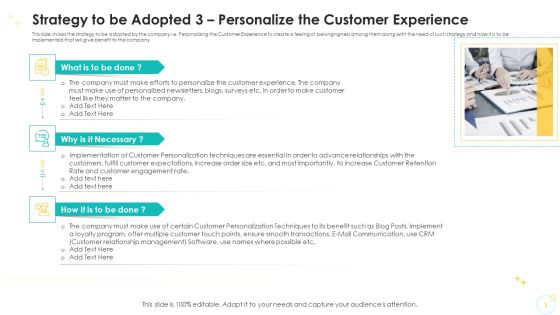
Strategy To Be Adopted 3 Personalize The Customer Experience Ppt Diagram Graph Charts PDF
This slide shows the strategy to be adopted by the company i.e. Personalizing the Customer Experience to create a feeling of belongingness among them along with the need of such strategy and how it is to be implemented that will give benefit to the company.Presenting strategy to be adopted 3 personalize the customer experience ppt diagram graph charts pdf. to provide visual cues and insights. Share and navigate important information on three stages that need your due attention. This template can be used to pitch topics like strategy to be adopted 3 personalize the customer experience. In addtion, this PPT design contains high resolution images, graphics, etc, that are easily editable and available for immediate download.

AMR Robot Technological Advances Impacting Amrs Hardware Ppt PowerPoint Presentation Diagram Graph Charts PDF
This slide represents the hardware technological advances impacting autonomous mobile robots, and the development of AGVs into AMRs is conceivable because of these technologies. It includes sensors, robot locomotion mechanism, batteries, manipulating equipment, and processing devices. Present like a pro with AMR Robot Technological Advances Impacting Amrs Hardware Ppt PowerPoint Presentation Diagram Graph Charts PDF Create beautiful presentations together with your team, using our easy to use presentation slides. Share your ideas in real time and make changes on the fly by downloading our templates. So whether you are in the office, on the go, or in a remote location, you can stay in sync with your team and present your ideas with confidence. With Slidegeeks presentation got a whole lot easier. Grab these presentations today.

Highlighting Role Of Chief Strategy Officer In Corporate Growth Ppt PowerPoint Presentation Diagram Graph Charts PDF
This slide provides information regarding the importance of chief strategy officer in handling firms growth. The responsibilities of CSO include communication with CFO for capital development, identification and management of strategic risks, etc. Slidegeeks is here to make your presentations a breeze with Highlighting Role Of Chief Strategy Officer In Corporate Growth Ppt PowerPoint Presentation Diagram Graph Charts PDF With our easy to use and customizable templates, you can focus on delivering your ideas rather than worrying about formatting. With a variety of designs to choose from, you are sure to find one that suits your needs. And with animations and unique photos, illustrations, and fonts, you can make your presentation pop. So whether you are giving a sales pitch or presenting to the board, make sure to check out Slidegeeks first.

Introduction To Switched Memory Access Ppt PowerPoint Presentation Diagram Graph Charts PDF
This slide represents the introduction to switched memory access, and a crossbar switch is installed to connect processors. Processors use shared memory in blocks, and connections between processors are made through a crossbar switch. Coming up with a presentation necessitates that the majority of the effort goes into the content and the message you intend to convey. The visuals of a PowerPoint presentation can only be effective if it supplements and supports the story that is being told. Keeping this in mind our experts created Introduction To Switched Memory Access Ppt PowerPoint Presentation Diagram Graph Charts PDF to reduce the time that goes into designing the presentation. This way, you can concentrate on the message while our designers take care of providing you with the right template for the situation.

Project Backlog Management Through Kanban Board Ppt PowerPoint Presentation Diagram Graph Charts PDF
This slide showcases managing project backlogs through Kanban board. It provides information about software features, project requirements, project analysis, proposal, scope, approval, timeline, resources, etc. Slidegeeks is here to make your presentations a breeze with Project Backlog Management Through Kanban Board Ppt PowerPoint Presentation Diagram Graph Charts PDF With our easy to use and customizable templates, you can focus on delivering your ideas rather than worrying about formatting. With a variety of designs to choose from, you are sure to find one that suits your needs. And with animations and unique photos, illustrations, and fonts, you can make your presentation pop. So whether you are giving a sales pitch or presenting to the board, make sure to check out Slidegeeks first.

Introduction And Benefits Of Marketing Collateral Ppt PowerPoint Presentation Diagram Graph Charts PDF
The following slide provides an overview of marketing collateral along with its positive impact on business. It showcases advantages such as standard information communication, reference material for sales, support material for conversations and campaign promotions. Present like a pro with Introduction And Benefits Of Marketing Collateral Ppt PowerPoint Presentation Diagram Graph Charts PDF Create beautiful presentations together with your team, using our easy to use presentation slides. Share your ideas in real time and make changes on the fly by downloading our templates. So whether you are in the office, on the go, or in a remote location, you can stay in sync with your team and present your ideas with confidence. With Slidegeeks presentation got a whole lot easier. Grab these presentations today.

Sample Of Brochure To Promote Event Ppt PowerPoint Presentation Diagram Graph Charts PDF
This slide highlights examples of brochure used by business to provide description and guide audience about event. It purposes are provide a lot of information in a compact format, educate audience, and promote an event. This Sample Of Brochure To Promote Event Ppt PowerPoint Presentation Diagram Graph Charts PDF from Slidegeeks makes it easy to present information on your topic with precision. It provides customization options, so you can make changes to the colors, design, graphics, or any other component to create a unique layout. It is also available for immediate download, so you can begin using it right away. Slidegeeks has done good research to ensure that you have everything you need to make your presentation stand out. Make a name out there for a brilliant performance.

Different Types Of Brand Architecture Ppt PowerPoint Presentation Diagram Graph Charts PDF
This slide showcases different types of brand architecture under which organizations operates. It includes - branded house, house of brands, hybrid brand and endorsed brand architecture. Welcome to our selection of the Different Types Of Brand Architecture Ppt PowerPoint Presentation Diagram Graph Charts PDF. These are designed to help you showcase your creativity and bring your sphere to life. Planning and Innovation are essential for any business that is just starting out. This collection contains the designs that you need for your everyday presentations. All of our PowerPoints are 100 percent editable, so you can customize them to suit your needs. This multi purpose template can be used in various situations. Grab these presentation templates today.

Data Center Relocation Benefits To The Company Ppt PowerPoint Presentation Diagram Graph Charts PDF
The following slide shows the benefits of data center relocation to the company such as increase in overall data center efficiency, reduction in data center expenses and increase in overall data security. Slidegeeks is here to make your presentations a breeze with Data Center Relocation Benefits To The Company Ppt PowerPoint Presentation Diagram Graph Charts PDF With our easy to use and customizable templates, you can focus on delivering your ideas rather than worrying about formatting. With a variety of designs to choose from, you are sure to find one that suits your needs. And with animations and unique photos, illustrations, and fonts, you can make your presentation pop. So whether you are giving a sales pitch or presenting to the board, make sure to check out Slidegeeks first.
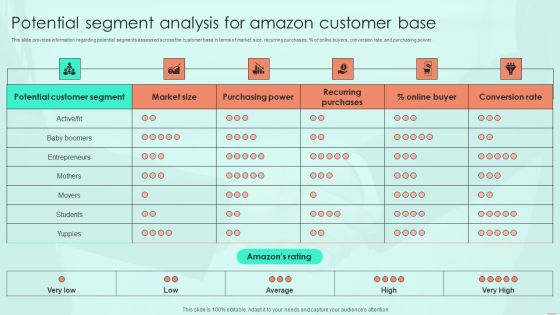
Potential Segment Analysis For Amazon Customer Base Ppt PowerPoint Presentation Diagram Graph Charts PDF
This slide provides information regarding potential segments assessed across the customer base in terms of market size, recurring purchases, percent of online buyers, conversion rate, and purchasing power. Present like a pro with Potential Segment Analysis For Amazon Customer Base Ppt PowerPoint Presentation Diagram Graph Charts PDF Create beautiful presentations together with your team, using our easy to use presentation slides. Share your ideas in real time and make changes on the fly by downloading our templates. So whether you are in the office, on the go, or in a remote location, you can stay in sync with your team and present your ideas with confidence. With Slidegeeks presentation got a whole lot easier. Grab these presentations today.

Platforms To Run Paid Search Engine Campaign Ppt PowerPoint Presentation Diagram Graph Charts PDF
This slide showcases various platforms that can be leveraged by marketers for running paid search engine campaigns. Three major platforms for paid search engine ads are - Google, Bing and Yahoo Welcome to our selection of the Platforms To Run Paid Search Engine Campaign Ppt PowerPoint Presentation Diagram Graph Charts PDF. These are designed to help you showcase your creativity and bring your sphere to life. Planning and Innovation are essential for any business that is just starting out. This collection contains the designs that you need for your everyday presentations. All of our PowerPoints are 100 percent editable, so you can customize them to suit your needs. This multi purpose template can be used in various situations. Grab these presentation templates today.

Timeline To Run Performance Marketing Campaign Ppt PowerPoint Presentation Diagram Graph Charts PDF
This slide displays timeline that can help marketers to plan and ensure timely execution of performance marketing campaign. Key elements of this timeline are marketing activity, responsible employee and status The Timeline To Run Performance Marketing Campaign Ppt PowerPoint Presentation Diagram Graph Charts PDF is a compilation of the most recent design trends as a series of slides. It is suitable for any subject or industry presentation, containing attractive visuals and photo spots for businesses to clearly express their messages. This template contains a variety of slides for the user to input data, such as structures to contrast two elements, bullet points, and slides for written information. Slidegeeks is prepared to create an impression.

Deployment Of Digital Twin In Retail Sector Ppt PowerPoint Presentation Diagram Graph Charts PDF
This slide describes the application of digital twin technology in the retail industry and how it can enhance the customer experience and efficient in store planning. This Deployment Of Digital Twin In Retail Sector Ppt PowerPoint Presentation Diagram Graph Charts PDF from Slidegeeks makes it easy to present information on your topic with precision. It provides customization options, so you can make changes to the colors, design, graphics, or any other component to create a unique layout. It is also available for immediate download, so you can begin using it right away. Slidegeeks has done good research to ensure that you have everything you need to make your presentation stand out. Make a name out there for a brilliant performance.

Best Tools To Conduct Market Research Social Media Research Ppt PowerPoint Presentation Diagram Graph Charts PDF
The following slide outlines different software tools through which marketing executives can increase brand visibility on social media platforms. The tools covered in slide are Social Mention, Surveybot, Sprout Social, and Hootsuite. This Best Tools To Conduct Market Research Social Media Research Ppt PowerPoint Presentation Diagram Graph Charts PDF from Slidegeeks makes it easy to present information on your topic with precision. It provides customization options, so you can make changes to the colors, design, graphics, or any other component to create a unique layout. It is also available for immediate download, so you can begin using it right away. Slidegeeks has done good research to ensure that you have everything you need to make your presentation stand out. Make a name out there for a brilliant performance.

Analyzing Different Fulfillment Options Utilized By Sellers Ppt PowerPoint Presentation Diagram Graph Charts PDF
This slide provides information regarding the assessment of fulfillment options utilized by sellers. Two fulfillment options used by sellers include fulfillment by Amazon and Merchant along with their feasibility. Slidegeeks is one of the best resources for PowerPoint templates. You can download easily and regulate Analyzing Different Fulfillment Options Utilized By Sellers Ppt PowerPoint Presentation Diagram Graph Charts PDF for your personal presentations from our wonderful collection. A few clicks is all it takes to discover and get the most relevant and appropriate templates. Use our Templates to add a unique zing and appeal to your presentation and meetings. All the slides are easy to edit and you can use them even for advertisement purposes.
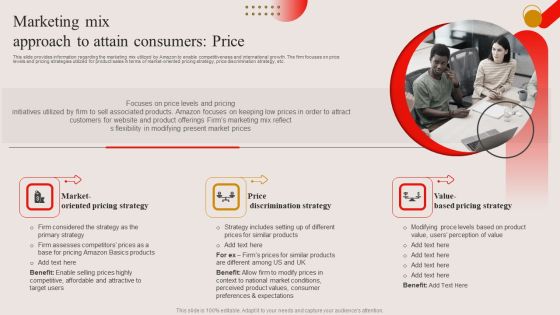
Marketing Mix Approach To Attain Consumers Price Ppt PowerPoint Presentation Diagram Graph Charts PDF
This slide provides information regarding the marketing mix utilized by Amazon to enable competitiveness and international growth. The firm focuses on price levels and pricing strategies utilized for product sales in terms of market-oriented pricing strategy, price discrimination strategy, etc. This Marketing Mix Approach To Attain Consumers Price Ppt PowerPoint Presentation Diagram Graph Charts PDF from Slidegeeks makes it easy to present information on your topic with precision. It provides customization options, so you can make changes to the colors, design, graphics, or any other component to create a unique layout. It is also available for immediate download, so you can begin using it right away. Slidegeeks has done good research to ensure that you have everything you need to make your presentation stand out. Make a name out there for a brilliant performance.

Presenting Deals And Offers To Lure Prospects Ppt PowerPoint Presentation Diagram Graph Charts PDF
The following slide showcases deals and offers which can be presented by marketers to lure more customers. It provides information about email marketing sequence, news events, holidays, seasons, etc. Slidegeeks is here to make your presentations a breeze with Presenting Deals And Offers To Lure Prospects Ppt PowerPoint Presentation Diagram Graph Charts PDF With our easy to use and customizable templates, you can focus on delivering your ideas rather than worrying about formatting. With a variety of designs to choose from, you are sure to find one that suits your needs. And with animations and unique photos, illustrations, and fonts, you can make your presentation pop. So whether you are giving a sales pitch or presenting to the board, make sure to check out Slidegeeks first.

Latest And Emerging Trends In SMS Marketing Ppt PowerPoint Presentation Diagram Graph Charts PDF
This slide represents the SMS marketing trends to help brand in communicating its business values in diverse manner and to break market boundaries. It includes details related to emerging SMS marketing trends such as RCS messaging, conversational marketing etc. Present like a pro with Latest And Emerging Trends In SMS Marketing Ppt PowerPoint Presentation Diagram Graph Charts PDF Create beautiful presentations together with your team, using our easy to use presentation slides. Share your ideas in real time and make changes on the fly by downloading our templates. So whether you are in the office, on the go, or in a remote location, you can stay in sync with your team and present your ideas with confidence. With Slidegeeks presentation got a whole lot easier. Grab these presentations today.
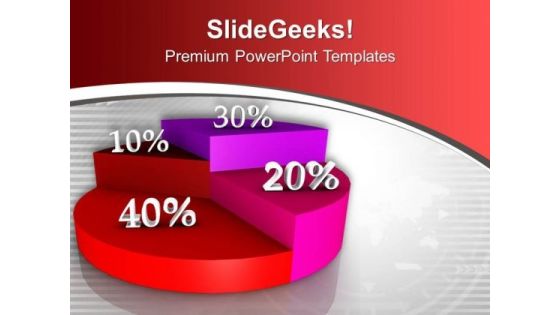
Circular Chart Represents Statistical Diagram PowerPoint Templates Ppt Backgrounds For Slides 0313
We present our Circular Chart Represents Statistical Diagram PowerPoint Templates PPT Backgrounds For Slides 0313.Use our Marketing PowerPoint Templates because Our PowerPoint Templates and Slides are truly out of this world. Even the MIB duo has been keeping tabs on our team. Use our Business PowerPoint Templates because Our PowerPoint Templates and Slides will help you be quick off the draw. Just enter your specific text and see your points hit home. Download our Shapes PowerPoint Templates because Our PowerPoint Templates and Slides will effectively help you save your valuable time. They are readymade to fit into any presentation structure. Download and present our Finance PowerPoint Templates because Our PowerPoint Templates and Slides team portray an attitude of elegance. Personify this quality by using them regularly. Download and present our Signs PowerPoint Templates because Our PowerPoint Templates and Slides are effectively colour coded to prioritise your plans They automatically highlight the sequence of events you desire.Use these PowerPoint slides for presentations relating to Pie chart, finance, business, shapes, signs, marketing. The prominent colors used in the PowerPoint template are Red, Pink, White.
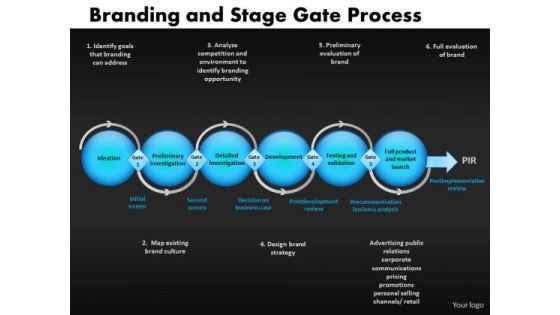
Multiple Stages Process Diagram With Stage Gates PowerPoint Slides
Multiple Stages Process Diagram with Stage Gates PowerPoint Slides-These high quality powerpoint pre-designed slides and powerpoint templates have been carefully created by our professional team to help you impress your audience. All slides have been created and are 100% editable in powerpoint. Each and every property of any graphic - color, size, orientation, shading, outline etc. can be modified to help you build an effective powerpoint presentation. Any text can be entered at any point in the powerpoint template or slide. Simply DOWNLOAD, TYPE and PRESENT! These PowerPoint presentation slides can be used to represent themes relating to -

PowerPoint Slides Stage Gates Process Diagram Ppt Templates
PowerPoint slides Stage Gates Process Diagram PPT templates-These high quality powerpoint pre-designed slides and powerpoint templates have been carefully created by our professional team to help you impress your audience. All slides have been created and are 100% editable in powerpoint. Each and every property of any graphic - color, size, orientation, shading, outline etc. can be modified to help you build an effective powerpoint presentation. Any text can be entered at any point in the powerpoint template or slide. Simply DOWNLOAD, TYPE and PRESENT! These PowerPoint presentation slides can be used to represent themes relating to -
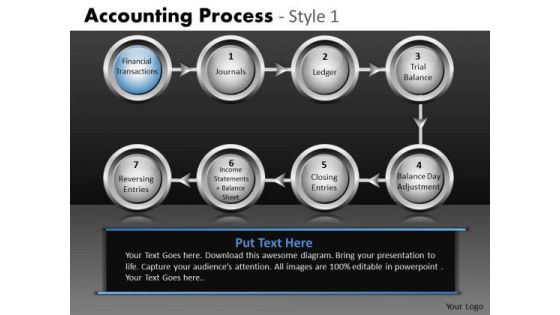
Linear Process Flow Diagram PowerPoint Slides Ppt Templates
Linear Process Flow Diagram PowerPoint Slides PPT templates-These high quality powerpoint pre-designed slides and powerpoint templates have been carefully created by our professional team to help you impress your audience. All slides have been created and are 100% editable in powerpoint. Each and every property of any graphic - color, size, orientation, shading, outline etc. can be modified to help you build an effective powerpoint presentation. Any text can be entered at any point in the powerpoint template or slide. Simply DOWNLOAD, TYPE and PRESENT! These PowerPoint presentation slides can be used to represent themes relating to -
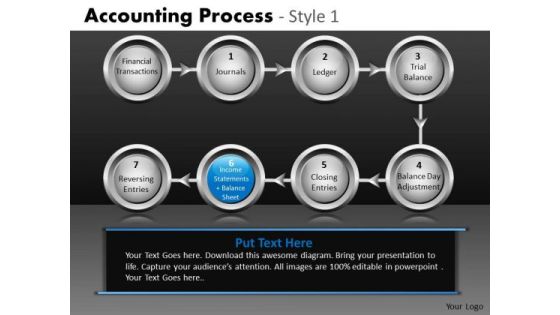
Linear Process Flowchart Diagram PowerPoint Slides Ppt Templates
Linear Process FlowChart Diagram PowerPoint Slides PPT templates-These high quality powerpoint pre-designed slides and powerpoint templates have been carefully created by our professional team to help you impress your audience. All slides have been created and are 100% editable in powerpoint. Each and every property of any graphic - color, size, orientation, shading, outline etc. can be modified to help you build an effective powerpoint presentation. Any text can be entered at any point in the powerpoint template or slide. Simply DOWNLOAD, TYPE and PRESENT! These PowerPoint presentation slides can be used to represent themes relating to -
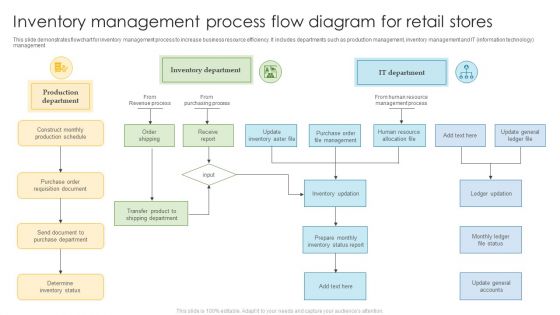
Inventory Management Process Flow Diagram For Retail Stores Brochure PDF
This slide demonstrates flowchart for inventory management process to increase business resource efficiency. It includes departments such as production management, inventory management and IT information technology management. Presenting Inventory Management Process Flow Diagram For Retail Stores Brochure PDF to dispense important information. This template comprises one stage. It also presents valuable insights into the topics including Production Department, Inventory Department, Requisition Document. This is a completely customizable PowerPoint theme that can be put to use immediately. So, download it and address the topic impactfully.

Retail Store Order Management Process Flow Diagram Elements PDF
Mentioned slide displays order management process which can be used by retail stores to increase business sales. It includes stakeholders such as receiving agent, vendor, supervisor, buyer agent and shipping officer. Presenting Retail Store Order Management Process Flow Diagram Elements PDF to dispense important information. This template comprises one stage. It also presents valuable insights into the topics including Communicate Customer, Customer Counter, Payment Customer. This is a completely customizable PowerPoint theme that can be put to use immediately. So, download it and address the topic impactfully.
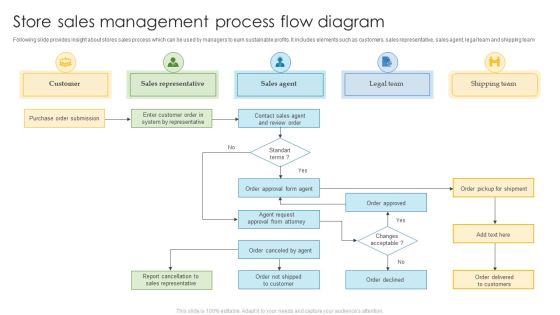
Store Sales Management Process Flow Diagram Slides PDF
Following slide provides insight about stores sales process which can be used by managers to earn sustainable profits. It includes elements such as customers, sales representative, sales agent, legal team and shipping team.Presenting Store Sales Management Process Flow Diagram Slides PDF to dispense important information. This template comprises one stage. It also presents valuable insights into the topics including Report Cancellation, Sales Representative, System Representative. This is a completely customizable PowerPoint theme that can be put to use immediately. So, download it and address the topic impactfully.

Brand Perceptual Grid Diagram For Competitive Analysis Slides PDF
This slide highlights a perceptual mapping matrix of brands to analyze current position of business in market. It includes key elements like high quality, low quality, high cost and low cost. Presenting Brand Perceptual Grid Diagram For Competitive Analysis Slides PDF to dispense important information. This template comprises one stages. It also presents valuable insights into the topics including Easy Use, Fulfil Customer, Requirements Efficiently. This is a completely customizable PowerPoint theme that can be put to use immediately. So, download it and address the topic impactfully.

Customer Journey Grid Diagram For Brand Analysis Brochure PDF
The following slide showcases a matrix map showing touch points of different brand to enhance customer journey. It includes key elements like impact on likelihood of purchase, feeling about the touch point, etc. Presenting Customer Journey Grid Diagram For Brand Analysis Brochure PDF to dispense important information. This template comprises one stages. It also presents valuable insights into the topics including Television Ad, Conversation, Website. This is a completely customizable PowerPoint theme that can be put to use immediately. So, download it and address the topic impactfully.

Grid Diagram For Business Sustainability Strategy Structure PDF
The slide showcases a matrix map for formulating business sustainability strategy to achieve sustainability goals. It includes key elements like importance of economic, environmental and social influence, impact on stakeholder evaluation and decisions, etc. Presenting Grid Diagram For Business Sustainability Strategy Structure PDF to dispense important information. This template comprises four stages. It also presents valuable insights into the topics including Employee Health Safety, Diversity, Climate Change. This is a completely customizable PowerPoint theme that can be put to use immediately. So, download it and address the topic impactfully.
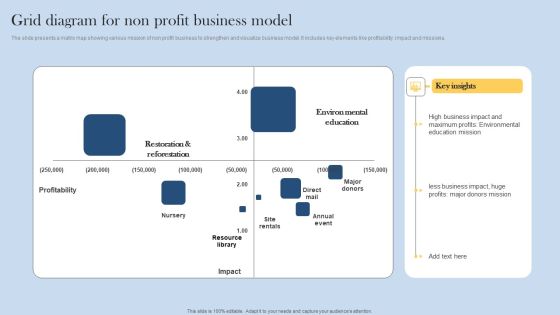
Grid Diagram For Non Profit Business Model Introduction PDF
The slide presents a matrix map showing various mission of non profit business to strengthen and visualize business model. It includes key elements like profitability, impact and missions. Presenting Grid Diagram For Non Profit Business Model Introduction PDF to dispense important information. This template comprises one stages. It also presents valuable insights into the topics including Restoration Reforestation, Environ Mental Education, Resource Library. This is a completely customizable PowerPoint theme that can be put to use immediately. So, download it and address the topic impactfully.

Materiality Analysis Grid Diagram For Business Success Graphics PDF
The following slide highlights a materiality analysis matrix map to formulate sustainability strategy for business growth and success. It includes topics addressed by external stakeholders and importance for companys success. Presenting Materiality Analysis Grid Diagram For Business Success Graphics PDF to dispense important information. This template comprises one stages. It also presents valuable insights into the topics including Green Products, Digital Solutions, Corporate Integrity. This is a completely customizable PowerPoint theme that can be put to use immediately. So, download it and address the topic impactfully.

Small Midsize Business ERP Value Grid Diagram Inspiration PDF
The slide highlights a matrix map of corporate performance management showing ERP value of small midsize businesses. It includes key components like facilitator, leader, expert, core provider, greater usability and better functionality. Presenting Small Midsize Business ERP Value Grid Diagram Inspiration PDF to dispense important information. This template comprises one stages. It also presents valuable insights into the topics including Greater Usability, Better Functionality, Providing ERP Solutions. This is a completely customizable PowerPoint theme that can be put to use immediately. So, download it and address the topic impactfully.
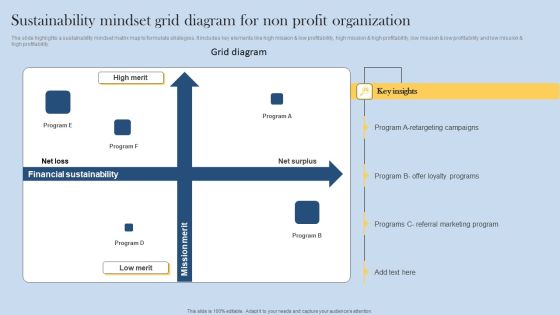
Sustainability Mindset Grid Diagram For Non Profit Organization Demonstration PDF
The slide highlights a sustainability mindset matrix map to formulate strategies. It includes key elements like high mission and low profitability, high mission and high profitability, low mission and low profitability and low mission and high profitability. Presenting Sustainability Mindset Grid Diagram For Non Profit Organization Demonstration PDF to dispense important information. This template comprises one stages. It also presents valuable insights into the topics including Referral Marketing Program, Loyalty Programs, A Retargeting Campaigns. This is a completely customizable PowerPoint theme that can be put to use immediately. So, download it and address the topic impactfully.


 Continue with Email
 Sign up for an account
 Home
Home