Phases

Circular Process Flow Diagram Powerpoint Slides
This PowerPoint template has been designed with circular diagram. This PPT slide displays circular petals diagram. Present your opinions in impressive manner using this professional template.

API Integration Software Development Circular Diagram Ppt Icon Clipart Images PDF
Presenting this set of slides with name api integration software development circular diagram ppt icon clipart images pdf. This is a six stage process. The stages in this process are circular diagram. This is a completely editable PowerPoint presentation and is available for immediate download. Download now and impress your audience.
Organizational Administration Structure Icon Rules PDF
Presenting organizational administration structure icon rules pdf to dispense important information. This template comprises three stages. It also presents valuable insights into the topics including organizational administration structure icon. This is a completely customizable PowerPoint theme that can be put to use immediately. So, download it and address the topic impactfully.
Organizational Leadership Style Matrix Icon Portrait PDF
Presenting Organizational Leadership Style Matrix Icon Portrait PDF to dispense important information. This template comprises four stages. It also presents valuable insights into the topics including Organizational Leadership Style, Matrix Icon. This is a completely customizable PowerPoint theme that can be put to use immediately. So, download it and address the topic impactfully.

1 Cloud Infrastructure Show With Application Storage And Servers And Mobile Devices Ppt Slides
This image slide displays cloud infrastructure depicted with application, storage and servers. This image slide has been crafted with graphic of cloud with application, storage and infrastructure icons. Graphic of various technology devices has also been used in this image. This image slide depicts cloud computing infrastructure. You may change size, color and orientation of any icon to your liking. Use this PowerPoint template, in your presentations to explain concepts like cloud computing, technology and business. This image slide will help you achieve your goal of making professional presentations.
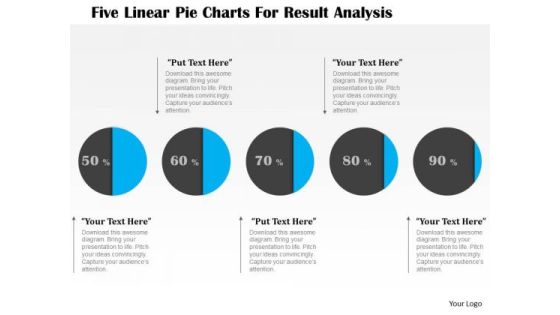
Business Diagram Five Linear Pie Charts For Result Analysis Presentation Template
This business diagram displays graphic of five staged process flow diagram. This PPT slide contains the concept of business data representation. Use this diagram to build professional presentation for your viewers.

Customer Success Department Org Chart Client Success Best Practices Guide Diagrams PDF
Mentioned slide highlights the companys organizational chart. It includes information about the various levels associated with the customer success department.Slidegeeks has constructed Customer Success Department Org Chart Client Success Best Practices Guide Diagrams PDF after conducting extensive research and examination. These presentation templates are constantly being generated and modified based on user preferences and critiques from editors. Here, you will find the most attractive templates for a range of purposes while taking into account ratings and remarks from users regarding the content. This is an excellent jumping-off point to explore our content and will give new users an insight into our top-notch PowerPoint Templates.

Gantt Chart For Interior Design Process And Development Procedure Management Diagrams PDF
The slide depicts a Gantt chart for interior designing project management which helps to track activities efficiently. It covers timeframe, project budget, resources, analysis and cost. Showcasing this set of slides titled Gantt Chart For Interior Design Process And Development Procedure Management Diagrams PDF. The topics addressed in these templates are Cost, Establish Budget, Development Procedure Management. All the content presented in this PPT design is completely editable. Download it and make adjustments in color, background, font etc. as per your unique business setting.
PowerPoint Themes Education Characteristics Of Topic Ppt Slides
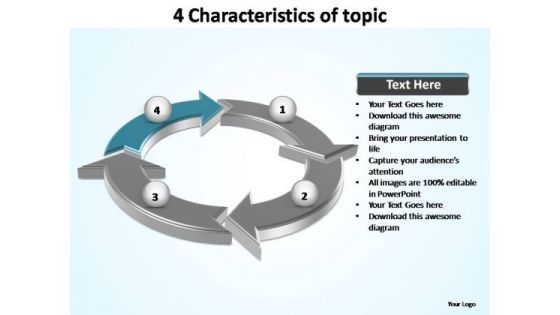
PowerPoint Themes Education Characteristics of Topic PPT Slides-Explore the various directions and layers existing in your in your plans and processes. Unravel the desired and essential elements of your overall strategy. Explain the relevance of the different layers and stages and directions in getting down to your core competence, ability and desired result.
PowerPoint Themes Marketing Characteristics Of Topic Ppt Template
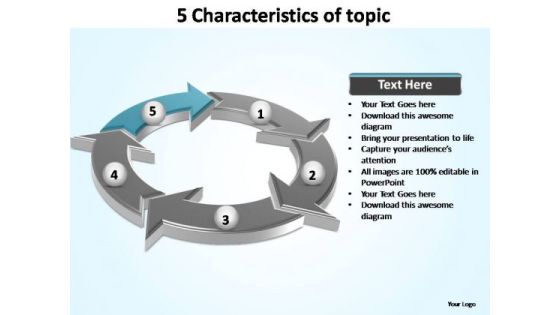
PowerPoint Themes Marketing Characteristics of Topic PPT Template-Explore the various directions and layers existing in your in your plans and processes. Unravel the desired and essential elements of your overall strategy. Explain the relevance of the different layers and stages and directions in getting down to your core competence, ability and desired result.
PowerPoint Layout Leadership Components Of Circular Ppt Theme
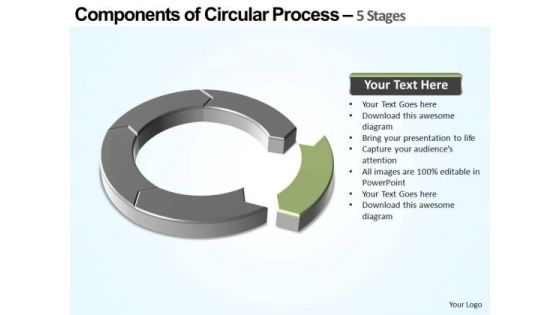
PowerPoint Layout Leadership Components of Circular PPT Theme-The Circle of Life - a concept emmbedded in our minds and hence easy to comprehend. Life and Business is made up of processes comprising stages that flow from one to another. An excellent graphic to attract the attention of and understanding by your audience to improve earnings.
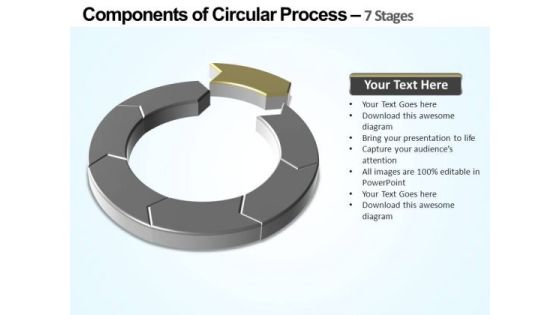
PowerPoint Template Teamwork Components Of Circular Ppt Theme
PowerPoint Template Teamwork Components of Circular PPT Theme-Explore the various directions and layers existing in your in your plans and processes. Unravel the desired and essential elements of your overall strategy. Explain the relevance of the different layers and stages and directions in getting down to your core competence, ability and desired result.
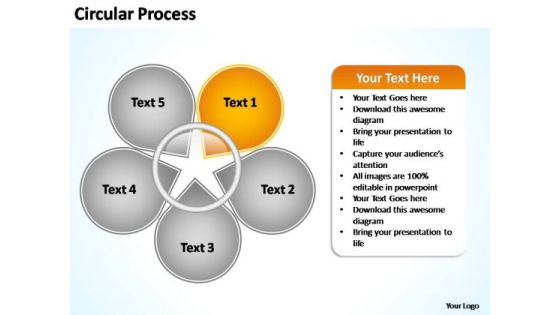
PowerPoint Templates Business Circular Process Flow Ppt Theme
PowerPoint Templates Business Circular Process Flow PPT Theme-The Circle of Life - a concept emmbedded in our minds and hence easy to comprehend. Life and Business is made up of processes comprising stages that flow from one to another. An excellent graphic to attract the attention of and understanding by your audience to improve earnings.
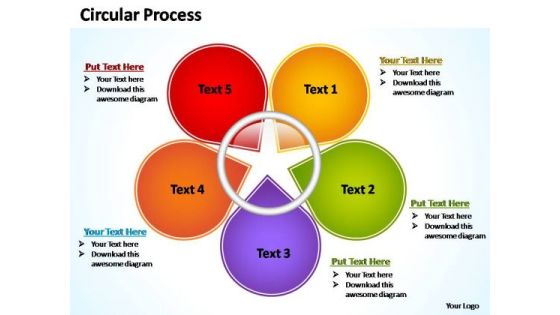
PowerPoint Templates Business Circular Process Flow Ppt Themes
PowerPoint Templates Business Circular Process Flow PPT Themes-The Circle of Life - a concept emmbedded in our minds and hence easy to comprehend. Life and Business is made up of processes comprising stages that flow from one to another. An excellent graphic to attract the attention of and understanding by your audience to improve earnings.

PowerPoint Design Slides Process Puzzle Framework Ppt Themes
PowerPoint Design Slides Process Puzzle Framework PPT Themes-Puzzles PowerPoint templates being the perennial educational tool. Emphasize the process of your business/corporate growth. Highlight your ideas broad- based on strong fundamentals and illustrate how they step by step achieve the set growth factor.

PowerPoint Slide Layout Graphic Circular Process Ppt Theme
PowerPoint_Slide_layout_Graphic_Circular_Process_PPT_Theme Business Power Points-Highlight the key components of your entire manufacturing/ business process. Illustrate how each element flows seamlessly onto the next stage. Emphasise on any critical or key factors within them. Demonstrate how they all combine to form the final product.-PowerPoint_Slide_layout_Graphic_Circular_Process_PPT_Theme Business Power Points
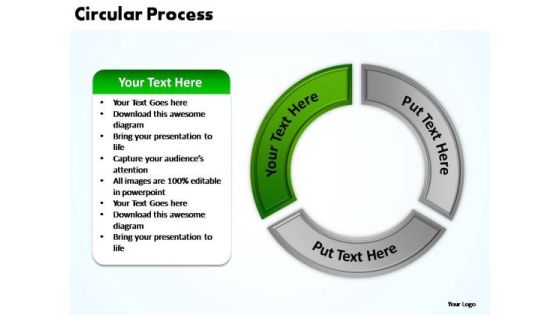
PowerPoint Slide Layout Sales Circular Process Ppt Themes
PowerPoint_Slide_layout_Sales_Circular_Process_PPT_Themes Business Power Points-Highlight the key components of your entire manufacturing/ business process. Illustrate how each element flows seamlessly onto the next stage. Emphasise on any critical or key factors within them. Demonstrate how they all combine to form the final product.-PowerPoint_Slide_layout_Sales_Circular_Process_PPT_Themes Business Power Points
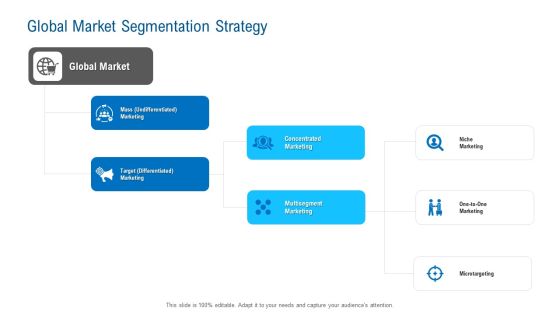
Merchandising Industry Analysis Global Market Segmentation Strategy Themes PDF
Presenting merchandising industry analysis global market segmentation strategy themes pdf to provide visual cues and insights. Share and navigate important information on three stages that need your due attention. This template can be used to pitch topics like global market, target marketing, multisegment marketing. In addtion, this PPT design contains high resolution images, graphics, etc, that are easily editable and available for immediate download.
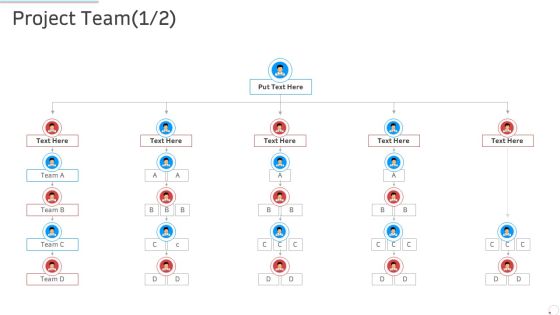
Project Team Manufacturing Control Ppt Show Themes PDF
This is a project team manufacturing control ppt show themes pdf template with various stages. Focus and dispense information on five stages using this creative set, that comes with editable features. It contains large content boxes to add your information on topics like project team. You can also showcase facts, figures, and other relevant content using this PPT layout. Grab it now.
Business Data Graph PowerPoint Icon C
Increasing Bar Chart - Business Data Graph With World Map
Business Data Graph PowerPoint Icon Cc
Increasing Bar Chart - Business Data Graph With World Map
Business Data Graph PowerPoint Icon S
Increasing Bar Chart - Business Data Graph With World Map
Icons Slide For Devops Deployment And Transformation Services Advisory Proposal Graphics PDF
Elevate your presentations with our intuitive Icons Slide For Devops Deployment And Transformation Services Advisory Proposal Graphics PDF template. Whether youre delivering a pitch, sharing data, or presenting ideas, our visually-stunning single-slide PPT template is the perfect tool to captivate your audience. With 100 percent editable features and a user-friendly interface, creating professional presentations has never been easier. Download now and leave a lasting impression.

Icons Comprehensive Guide To Develop A Strategic Product Strategy Template PDF
The Icons Comprehensive Guide To Develop A Strategic Product Strategy Template PDF is a compilation of the most recent design trends as a series of slides. It is suitable for any subject or industry presentation, containing attractive visuals and photo spots for businesses to clearly express their messages. This template contains a variety of slides for the user to input data, such as structures to contrast two elements, bullet points, and slides for written information. Slidegeeks is prepared to create an impression.

Icons Slide For Integrating CRM Solution To Acquire Potential Customers Structure PDF
Boost your pitch with our creative Icons Slide For Integrating CRM Solution To Acquire Potential Customers Structure PDF. Deliver an awe-inspiring pitch that will mesmerize everyone. Using these presentation templates you will surely catch everyones attention. You can browse the ppts collection on our website. We have researchers who are experts at creating the right content for the templates. So you do not have to invest time in any additional work. Just grab the template now and use them.
Icons Slide For Online Marketing Analytics To Enhance Business Growth Formats PDF
Boost your pitch with our creative Icons Slide For Online Marketing Analytics To Enhance Business Growth Formats PDF. Deliver an awe-inspiring pitch that will mesmerize everyone. Using these presentation templates you will surely catch everyones attention. You can browse the ppts collection on our website. We have researchers who are experts at creating the right content for the templates. So you do not have to invest time in any additional work. Just grab the template now and use them.
Icons Slide For Implementing Brand Extension Initiatives For Apple Company Rules PDF
Boost your pitch with our creative Icons Slide For Implementing Brand Extension Initiatives For Apple Company Rules PDF. Deliver an awe-inspiring pitch that will mesmerize everyone. Using these presentation templates you will surely catch everyones attention. You can browse the ppts collection on our website. We have researchers who are experts at creating the right content for the templates. So you do not have to invest time in any additional work. Just grab the template now and use them.
Stages To Implement Social Media Audit With Icons Ppt PowerPoint Presentation Icon Diagrams PDF
Presenting stages to implement social media audit with icons ppt powerpoint presentation icon diagrams pdf. to dispense important information. This template comprises four stages. It also presents valuable insights into the topics including gather information, evaluate data, highlight key issues, summarize findings. This is a completely customizable PowerPoint theme that can be put to use immediately. So, download it and address the topic impactfully.
Steps Of Innovative Product Deployment Process With Icons Ppt PowerPoint Presentation Icon Diagrams PDF
Presenting steps of innovative product deployment process with icons ppt powerpoint presentation icon diagrams pdf to dispense important information. This template comprises eight stages. It also presents valuable insights into the topics including deploy, success, target. This is a completely customizable PowerPoint theme that can be put to use immediately. So, download it and address the topic impactfully.
Swot Analysis Icon Diagram Of Equity Portfolio Management Ppt PowerPoint Presentation Icon Professional PDF
Presenting swot analysis icon diagram of equity portfolio management ppt powerpoint presentation icon professional pdf to dispense important information. This template comprises four stages. It also presents valuable insights into the topics including strengths, weaknesses, opportunities. This is a completely customizable PowerPoint theme that can be put to use immediately. So, download it and address the topic impactfully.

Strategy Diagram Gearwheels Marketing Diagram
Draw Out The Best In You With Our Strategy Diagram Gearwheels Marketing Diagram Powerpoint Templates. Let Your Inner Brilliance Come To The Surface.

Business Diagram Growth Marketing Diagram
Our Business Diagram Growth Marketing Diagram Powerpoint Templates Team Are A Dogged Lot. They Keep At It Till They Get It Right.

Composite Structure Diagram Ppt Diagrams
This is a composite structure diagram ppt diagrams. This is a five stage process. The stages in this process are integrated, measured, performance, process, structures.
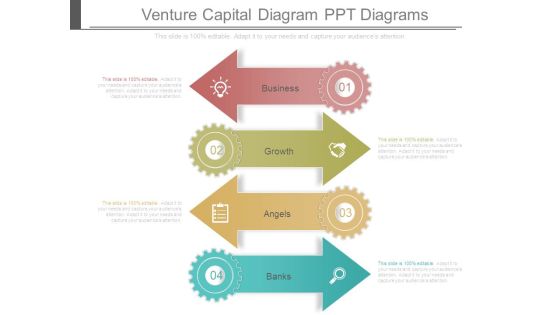
Venture Capital Diagram Ppt Diagrams
This is a venture capital diagram ppt diagrams. This is a four stage process. The stages in this process are business, growth, angels, banks.
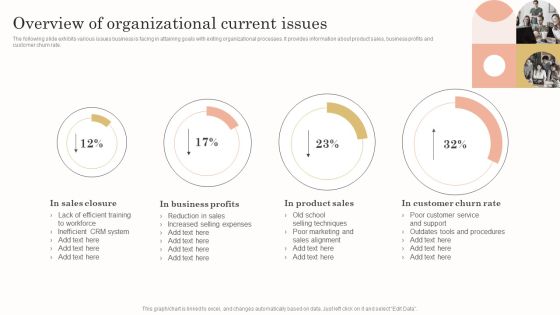
Overview Of Organizational Current Issues Diagrams PDF
The following slide exhibits various issues business is facing in attaining goals with exiting organizational processes. It provides information about product sales, business profits and customer churn rate. Coming up with a presentation necessitates that the majority of the effort goes into the content and the message you intend to convey. The visuals of a PowerPoint presentation can only be effective if it supplements and supports the story that is being told. Keeping this in mind our experts created Overview Of Organizational Current Issues Diagrams PDF to reduce the time that goes into designing the presentation. This way, you can concentrate on the message while our designers take care of providing you with the right template for the situation.
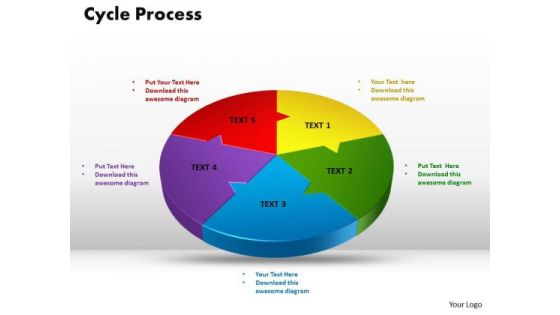
PowerPoint Template Cycle Process Diagram Ppt Slides
PowerPoint Template Cycle Process Diagram PPT Slides-Cycle Diagrams are a type of graphics that shows how items are related to one another in a repeating cycle. In a cycle diagram, you can explain the main events in the cycle, how they interact, and how the cycle repeats-PowerPoint Template Cycle Process Diagram PPT Slides

Business Diagram Cultural Web PowerPoint Ppt Presentation
Delight Them With Our Business Diagram Cultural Web PowerPoint PPT Presentation Powerpoint Templates.

Business Diagram Profitability Analysis PowerPoint Ppt Presentation
Delight Them With Our Business Diagram Profitability Analysis PowerPoint PPT Presentation PowerPoint Templates.

Ppt Template 3d Illustration Of Straightaway Arrow Flow Process Charts Diagram 1 Graphic
We present our PPT template 3d illustration of straightaway arrow flow process charts diagram 1 Graphic. Use our Arrows PowerPoint Templates because, designed to attract the attention of your audience. Use our Symbol PowerPoint Templates because, Shine the light on these thoughts and motivate your team to improve the quality of celebration for all around you. Use our Shapes PowerPoint Templates because, However there is a key aspect to be emphasized. Use our Business PowerPoint Templates because; explain your strategy to co-ordinate activities of these separate groups. Use our Signs PowerPoint Templates because, however you are aware of some pitfalls ahead where you need to be cautious not to overran and avoid a stall. Use these PowerPoint slides for presentations relating to 3d, Arrow, Background, Banner, Business, Chart, Colorful, Diagram, Direction, Element, Financial, Flow, Gradient, Illustration, Isolated, Mirrored, Placeholder, Presentation, Process, Steps. The prominent colors used in the PowerPoint template are Yellow, Green, and Black

Application Of End User Computing In Manufacturing Ppt PowerPoint Presentation Diagram Graph Charts PDF
This slide explains the use cases of end user computing in manufacturing and how it will improve the feedback processes, Kanban process and analysis of the work center. Do you have to make sure that everyone on your team knows about any specific topic I yes, then you should give Application Of End User Computing In Manufacturing Ppt PowerPoint Presentation Diagram Graph Charts PDF a try. Our experts have put a lot of knowledge and effort into creating this impeccable Application Of End User Computing In Manufacturing Ppt PowerPoint Presentation Diagram Graph Charts PDF. You can use this template for your upcoming presentations, as the slides are perfect to represent even the tiniest detail. You can download these templates from the Slidegeeks website and these are easy to edit. So grab these today.
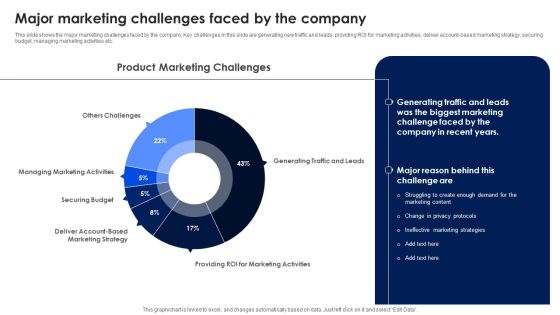
Major Marketing Challenges Faced By The Company Ppt PowerPoint Presentation Diagram Graph Charts PDF
This slide shows the major marketing challenges faced by the company. Key challenges in this slide are generating new traffic and leads, providing ROI for marketing activities, deliver account based marketing strategy, securing budget, managing marketing activities etc. Find highly impressive Major Marketing Challenges Faced By The Company Ppt PowerPoint Presentation Diagram Graph Charts PDF on Slidegeeks to deliver a meaningful presentation. You can save an ample amount of time using these presentation templates. No need to worry to prepare everything from scratch because Slidegeeks experts have already done a huge research and work for you. You need to download Major Marketing Challenges Faced By The Company Ppt PowerPoint Presentation Diagram Graph Charts PDF for your upcoming presentation. All the presentation templates are 100 percent editable and you can change the color and personalize the content accordingly. Download now.

Process Flow Of Service Desk Management Ppt PowerPoint Presentation Diagram Graph Charts PDF
The following slide illustrates process flow of service desk management. It provides information about resolution time, in-call waiting time, agent call connection, issue escalation, client notification, operations management, etc. Explore a selection of the finest Process Flow Of Service Desk Management Ppt PowerPoint Presentation Diagram Graph Charts PDF here. With a plethora of professionally designed and pre made slide templates, you can quickly and easily find the right one for your upcoming presentation. You can use our Process Flow Of Service Desk Management Ppt PowerPoint Presentation Diagram Graph Charts PDF to effectively convey your message to a wider audience. Slidegeeks has done a lot of research before preparing these presentation templates. The content can be personalized and the slides are highly editable. Grab templates today from Slidegeeks.

It Devops Organization Structure Ppt PowerPoint Presentation Diagram Graph Charts PDF
This slide provides the glimpse about the 4 tier of IT organization structure which focuses on base infrastructure, higher order infrastructure, business aligned capabilities, and market facing system. Do you have an important presentation coming up Are you looking for something that will make your presentation stand out from the rest Look no further than It Devops Organization Structure Ppt PowerPoint Presentation Diagram Graph Charts PDF. With our professional designs, you can trust that your presentation will pop and make delivering it a smooth process. And with Slidegeeks, you can trust that your presentation will be unique and memorable. So why wait Grab It Devops Organization Structure Ppt PowerPoint Presentation Diagram Graph Charts PDF today and make your presentation stand out from the rest.
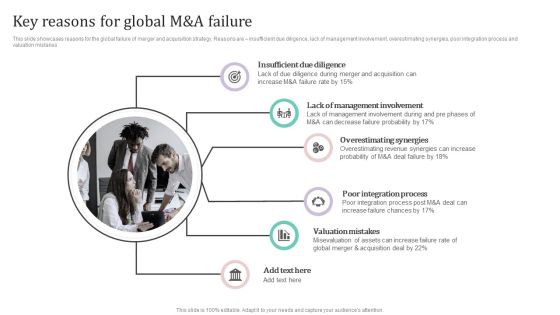
Key Reasons For Global M And A Failure Ppt PowerPoint Presentation Diagram Graph Charts PDF
This slide showcases reasons for the global failure of merger and acquisition strategy. Reasons are insufficient due diligence, lack of management involvement, overestimating synergies, poor integration process and valuation mistakes.Find highly impressive Key Reasons For Global M And A Failure Ppt PowerPoint Presentation Diagram Graph Charts PDF on Slidegeeks to deliver a meaningful presentation. You can save an ample amount of time using these presentation templates. No need to worry to prepare everything from scratch because Slidegeeks experts have already done a huge research and work for you. You need to download Key Reasons For Global M And A Failure Ppt PowerPoint Presentation Diagram Graph Charts PDF for your upcoming presentation. All the presentation templates are 100precent editable and you can change the color and personalize the content accordingly. Download now.
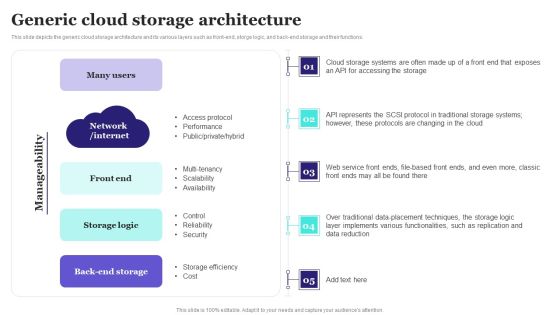
Generic Cloud Storage Architecture Ppt PowerPoint Presentation Diagram Graph Charts PDF
This slide depicts the generic cloud storage architecture and its various layers such as front end, storge logic, and back-end storage and their functions. Crafting an eye catching presentation has never been more straightforward. Let your presentation shine with this tasteful yet straightforward Generic Cloud Storage Architecture Ppt PowerPoint Presentation Diagram Graph Charts PDF template. It offers a minimalistic and classy look that is great for making a statement. The colors have been employed intelligently to add a bit of playfulness while still remaining professional. Construct the ideal Generic Cloud Storage Architecture Ppt PowerPoint Presentation Diagram Graph Charts PDF that effortlessly grabs the attention of your audience Begin now and be certain to wow your customers.

Difference Between Artificial And Augmented Intelligence Ppt PowerPoint Presentation Diagram Graph Charts PDF
This slide outlines the difference between augmented and artificial intelligence based on the factors such as the need of humans, approach, mode focus, and decision making. Here you can discover an assortment of the finest PowerPoint and Google Slides templates. With these templates, you can create presentations for a variety of purposes while simultaneously providing your audience with an eye catching visual experience. Download Difference Between Artificial And Augmented Intelligence Ppt PowerPoint Presentation Diagram Graph Charts PDF to deliver an impeccable presentation. These templates will make your job of preparing presentations much quicker, yet still, maintain a high level of quality. Slidegeeks has experienced researchers who prepare these templates and write high quality content for you. Later on, you can personalize the content by editing the Difference Between Artificial And Augmented Intelligence Ppt PowerPoint Presentation Diagram Graph Charts PDF.

Steps To Implement Business And IT Alignment Ppt PowerPoint Presentation Diagram Graph Charts PDF
This slide represents business and information technology alignment steps. It includes identifying business drivers, creating IT vision, assessing current alignment, identifying alignment gaps, prioritizing IT initiatives, evaluating implementation options, creating implementation options, and adjusting IT strategy. Crafting an eye catching presentation has never been more straightforward. Let your presentation shine with this tasteful yet straightforward Steps To Implement Business And IT Alignment Ppt PowerPoint Presentation Diagram Graph Charts PDF template. It offers a minimalistic and classy look that is great for making a statement. The colors have been employed intelligently to add a bit of playfulness while still remaining professional. Construct the ideal Steps To Implement Business And IT Alignment Ppt PowerPoint Presentation Diagram Graph Charts PDF that effortlessly grabs the attention of your audience Begin now and be certain to wow your customers.

Scrum Company Chart For Enterprise Agility Ppt PowerPoint Presentation Diagram Lists PDF
This slide provides the glimpse about the scrum enterprise structure which focuses on portfolio vision, architectural runway, portfolio, program and project details. Do you have to make sure that everyone on your team knows about any specific topic I yes, then you should give Scrum Company Chart For Enterprise Agility Ppt PowerPoint Presentation Diagram Lists PDF a try. Our experts have put a lot of knowledge and effort into creating this impeccable Scrum Company Chart For Enterprise Agility Ppt PowerPoint Presentation Diagram Lists PDF. You can use this template for your upcoming presentations, as the slides are perfect to represent even the tiniest detail. You can download these templates from the Slidegeeks website and these are easy to edit. So grab these today.

FDDI Architecture And Its Working Ppt PowerPoint Presentation Diagram Graph Charts PDF
This slide demonstrates the architecture and the working of FDDI, which is often implemented as a double token-passing ring inside a ring topology primary and secondary rings make up the dual ring, and the main ring carries data. Here you can discover an assortment of the finest PowerPoint and Google Slides templates. With these templates, you can create presentations for a variety of purposes while simultaneously providing your audience with an eye catching visual experience. Download FDDI Architecture And Its Working Ppt PowerPoint Presentation Diagram Graph Charts PDF to deliver an impeccable presentation. These templates will make your job of preparing presentations much quicker, yet still, maintain a high level of quality. Slidegeeks has experienced researchers who prepare these templates and write high quality content for you. Later on, you can personalize the content by editing the FDDI Architecture And Its Working Ppt PowerPoint Presentation Diagram Graph Charts PDF.

Disadvantages Associated With Multi Brand Strategy Ppt PowerPoint Presentation Diagram Graph Charts PDF
This slide showcases disadvantages of multi brand strategy in market. Key drawbacks are consumer expectations, difficulty in brand management and overlapping of brands. Explore a selection of the finest Disadvantages Associated With Multi Brand Strategy Ppt PowerPoint Presentation Diagram Graph Charts PDF here. With a plethora of professionally designed and pre made slide templates, you can quickly and easily find the right one for your upcoming presentation. You can use our Disadvantages Associated With Multi Brand Strategy Ppt PowerPoint Presentation Diagram Graph Charts PDF to effectively convey your message to a wider audience. Slidegeeks has done a lot of research before preparing these presentation templates. The content can be personalized and the slides are highly editable. Grab templates today from Slidegeeks.

Collecting Consumer Qualitative Data For Personalized Marketing Ppt PowerPoint Presentation Diagram Graph Charts PDF
This slide showcases consumer qualitative data that can be collected to formulate personalized marketing campaign. It also shows ways to collect data from different sources Do you have an important presentation coming up Are you looking for something that will make your presentation stand out from the rest Look no further than Collecting Consumer Qualitative Data For Personalized Marketing Ppt PowerPoint Presentation Diagram Graph Charts PDF. With our professional designs, you can trust that your presentation will pop and make delivering it a smooth process. And with Slidegeeks, you can trust that your presentation will be unique and memorable. So why wait Grab Collecting Consumer Qualitative Data For Personalized Marketing Ppt PowerPoint Presentation Diagram Graph Charts PDF today and make your presentation stand out from the rest.
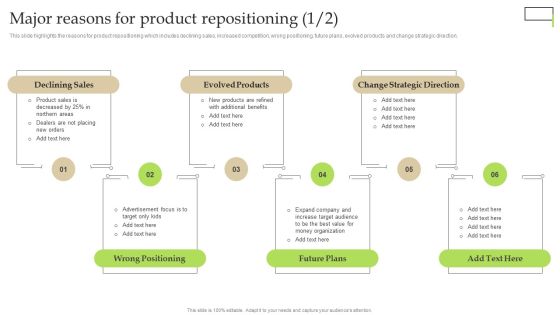
Major Reasons For Product Repositioning Ppt PowerPoint Presentation Diagram Graph Charts PDF
This slide highlights the reasons for product repositioning which includes declining sales, increased competition, wrong positioning, future plans, evolved products and change strategic direction. Do you have to make sure that everyone on your team knows about any specific topic I yes, then you should give Major Reasons For Product Repositioning Ppt PowerPoint Presentation Diagram Graph Charts PDF a try. Our experts have put a lot of knowledge and effort into creating this impeccable Major Reasons For Product Repositioning Ppt PowerPoint Presentation Diagram Graph Charts PDF. You can use this template for your upcoming presentations, as the slides are perfect to represent even the tiniest detail. You can download these templates from the Slidegeeks website and these are easy to edit. So grab these today

Developing Our Social Media Content Calendar Ppt PowerPoint Presentation Diagram Graph Charts PDF
The following slide displays the detailed content calendar of the organization, the provided slide displays the key social media websites on which the organization is present. Get a simple yet stunning designed Developing Our Social Media Content Calendar Ppt PowerPoint Presentation Diagram Graph Charts PDF. It is the best one to establish the tone in your meetings. It is an excellent way to make your presentations highly effective. So, download this PPT today from Slidegeeks and see the positive impacts. Our easy to edit Developing Our Social Media Content Calendar Ppt PowerPoint Presentation Diagram Graph Charts PDF can be your go to option for all upcoming conferences and meetings. So, what are you waiting for Grab this template today.
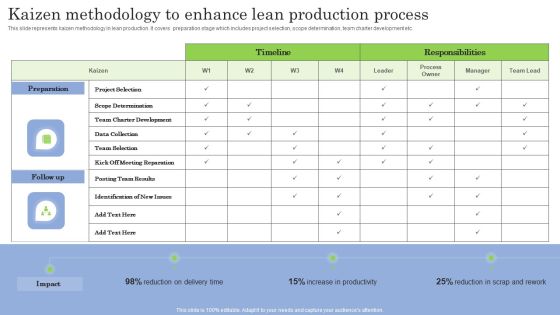
Kaizen Methodology To Enhance Lean Production Process Ppt PowerPoint Presentation Diagram Graph Charts PDF
This slide represents kaizen methodology in lean production. It covers preparation stage which includes project selection, scope determination, team charter development etc. Crafting an eye catching presentation has never been more straightforward. Let your presentation shine with this tasteful yet straightforward Kaizen Methodology To Enhance Lean Production Process Ppt PowerPoint Presentation Diagram Graph Charts PDF template. It offers a minimalistic and classy look that is great for making a statement. The colors have been employed intelligently to add a bit of playfulness while still remaining professional. Construct the ideal Kaizen Methodology To Enhance Lean Production Process Ppt PowerPoint Presentation Diagram Graph Charts PDF that effortlessly grabs the attention of your audience. Begin now and be certain to wow your customers.

Process To Formulate Performance Marketing Campaign Ppt PowerPoint Presentation Diagram Graph Charts PDF
This slide showcases process that can help organization to formulate performance marketing campaign and run online targeted ads. Its key steps are - establish campaign objectives, determine marketing channels, run marketing campaigns and optimize campaigns Explore a selection of the finest Process To Formulate Performance Marketing Campaign Ppt PowerPoint Presentation Diagram Graph Charts PDF here. With a plethora of professionally designed and pre made slide templates, you can quickly and easily find the right one for your upcoming presentation. You can use our Process To Formulate Performance Marketing Campaign Ppt PowerPoint Presentation Diagram Graph Charts PDF to effectively convey your message to a wider audience. Slidegeeks has done a lot of research before preparing these presentation templates. The content can be personalized and the slides are highly editable. Grab templates today from Slidegeeks.

Deployment Of Digital Twin In Healthcare Organizations Ppt PowerPoint Presentation Diagram Graph Charts PDF
This slide represents the application of digital twin technology in healthcare institutions to improve healthcare operational efficiency and improved personalized care. Here you can discover an assortment of the finest PowerPoint and Google Slides templates. With these templates, you can create presentations for a variety of purposes while simultaneously providing your audience with an eye catching visual experience. Download Deployment Of Digital Twin In Healthcare Organizations Ppt PowerPoint Presentation Diagram Graph Charts PDF to deliver an impeccable presentation. These templates will make your job of preparing presentations much quicker, yet still, maintain a high level of quality. Slidegeeks has experienced researchers who prepare these templates and write high quality content for you. Later on, you can personalize the content by editing the Deployment Of Digital Twin In Healthcare Organizations Ppt PowerPoint Presentation Diagram Graph Charts PDF.

Cost For Setting Billing System Structure Ppt PowerPoint Presentation Diagram Graph Charts PDF
Following slides provide information about total cost requirements to install and operate customer billing system. It include costs such as purchasing, implementing, maintaining, hiring, training etc. Crafting an eye catching presentation has never been more straightforward. Let your presentation shine with this tasteful yet straightforward Cost For Setting Billing System Structure Ppt PowerPoint Presentation Diagram Graph Charts PDF template. It offers a minimalistic and classy look that is great for making a statement. The colors have been employed intelligently to add a bit of playfulness while still remaining professional. Construct the ideal Cost For Setting Billing System Structure Ppt PowerPoint Presentation Diagram Graph Charts PDF that effortlessly grabs the attention of your audience. Begin now and be certain to wow your customers.

Various Billing Software Comparison Chart Ppt PowerPoint Presentation File Diagrams PDF
Following slide represents comparative analysis of various software for company billing system. It includes various parameters such as prices, installation, time tracking, individual invoices, expense tracking etc. Do you have an important presentation coming up Are you looking for something that will make your presentation stand out from the rest Look no further than Various Billing Software Comparison Chart Ppt PowerPoint Presentation File Diagrams PDF With our professional designs, you can trust that your presentation will pop and make delivering it a smooth process. And with Slidegeeks, you can trust that your presentation will be unique and memorable. So why wait Grab Various Billing Software Comparison Chart Ppt PowerPoint Presentation File Diagrams PDF today and make your presentation stand out from the rest.

Brand Positioning Statement Target Benefits Points For Assistance Ppt PowerPoint Presentation Diagram Graph Charts PDF
This slide provides information regarding brand positioning that portrays how Amazon functions, the target audience, showcases products benefits, point of assistance to highlight competitive advantage. Get a simple yet stunning designed Brand Positioning Statement Target Benefits Points For Assistance Ppt PowerPoint Presentation Diagram Graph Charts PDF. It is the best one to establish the tone in your meetings. It is an excellent way to make your presentations highly effective. So, download this PPT today from Slidegeeks and see the positive impacts. Our easy to edit Brand Positioning Statement Target Benefits Points For Assistance Ppt PowerPoint Presentation Diagram Graph Charts PDF can be your go to option for all upcoming conferences and meetings. So, what are you waiting for Grab this template today.

Transform Management Instruction Schedule Change Management Team Org Chart Diagrams PDF
This slide covers the details related to the team structure of the team responsible for implementing changes in the organization. It includes details related to the chief information officer, steering committee, director information management etc. Create an editable Transform Management Instruction Schedule Change Management Team Org Chart Diagrams PDF that communicates your idea and engages your audience. Whether youre presenting a business or an educational presentation, pre designed presentation templates help save time. Transform Management Instruction Schedule Change Management Team Org Chart Diagrams PDF is highly customizable and very easy to edit, covering many different styles from creative to business presentations. Slidegeeks has creative team members who have crafted amazing templates. So, go and get them without any delay.


 Continue with Email
 Sign up for an account
 Home
Home