Performance

Bar Charts For Business Performance Analysis Ppt PowerPoint Presentation Show Slideshow
This is a bar charts for business performance analysis ppt powerpoint presentation show slideshow. This is a two stage process. The stages in this process are compare, comparison of two, competitive analysis.

Comparing Performance Of Two Business Sectors Ppt PowerPoint Presentation Layouts Design Templates
This is a comparing performance of two business sectors ppt powerpoint presentation layouts design templates. This is a five stage process. The stages in this process are compare, comparison of two, competitive analysis.
Four Points Performance Comparison Of Two Business Sectors Ppt PowerPoint Presentation Layouts Icons
This is a four points performance comparison of two business sectors ppt powerpoint presentation layouts icons. This is a four stage process. The stages in this process are compare, comparison of two, competitive analysis.
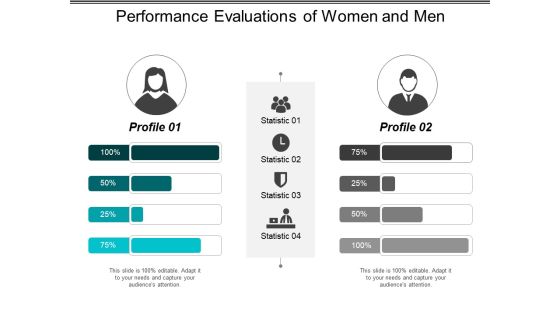
Performance Evaluations Of Women And Men Ppt PowerPoint Presentation File Design Ideas
This is a performance evaluations of women and men ppt powerpoint presentation file design ideas. This is a two stage process. The stages in this process are compare, comparison of two, competitive analysis.
Three Points Performance Comparison Of Two Business Sectors Ppt PowerPoint Presentation Icon Graphic Tips
This is a three points performance comparison of two business sectors ppt powerpoint presentation icon graphic tips. This is a three stage process. The stages in this process are compare, comparison of two, competitive analysis.

Employee Performance Feedback Employee Value Proposition Ppt PowerPoint Presentation Gallery Inspiration
This is a employee performance feedback employee value proposition ppt powerpoint presentation gallery inspiration. This is a five stage process. The stages in this process are business, management, strategy, analysis, marketing.

Continuous Performance Monitoring Assessment And Review Ppt PowerPoint Presentation Pictures Graphic Images
This is a continuous performance monitoring assessment and review ppt powerpoint presentation pictures graphic images. This is a four stage process. The stages in this process are monitoring controls, continuous controls, ccm.
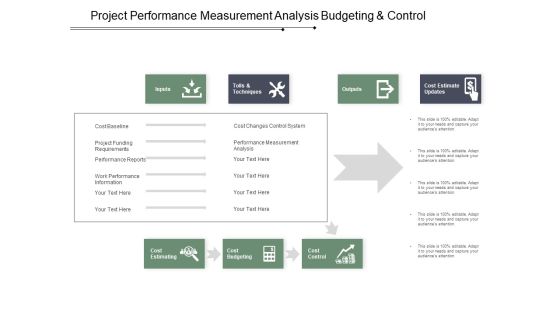
Project Performance Measurement Analysis Budgeting And Control Ppt PowerPoint Presentation Outline Format
This is a project performance measurement analysis budgeting and control ppt powerpoint presentation outline format. This is a three stage process. The stages in this process are cost control, money control, price control.

Crm Performance Metrics Sales And Service Ppt Powerpoint Presentation Inspiration Show
This is a crm performance metrics sales and service ppt powerpoint presentation inspiration show. This is a three stage process. The stages in this process are crm, customer relationship management, client relationships.

Improve Sales Performance And Productivity Ppt PowerPoint Presentation Diagram Graph Charts
This is a improve sales performance and productivity ppt powerpoint presentation diagram graph charts. This is a four stage process. The stages in this process are marketing effort, branding initiative, marketing initiatives.
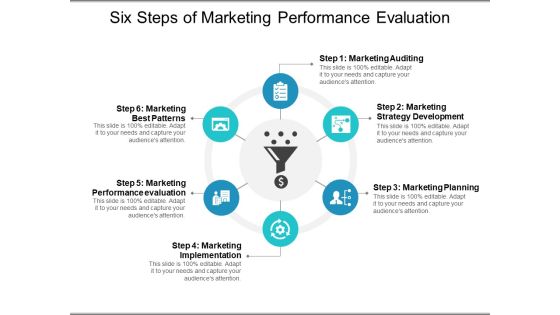
Six Steps Of Marketing Performance Evaluation Ppt PowerPoint Presentation Summary Skills
This is a six steps of marketing performance evaluation ppt powerpoint presentation summary skills. This is a six stage process. The stages in this process are marketing management, strategic management, marketing strategy.
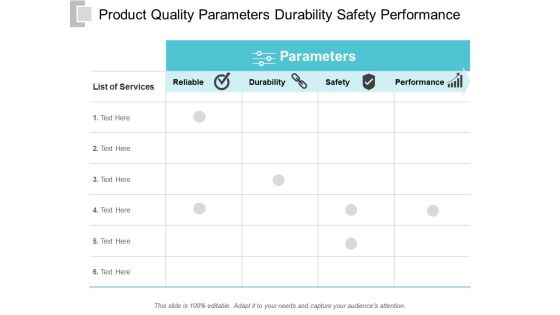
Product Quality Parameters Durability Safety Performance Ppt PowerPoint Presentation Portfolio Portrait
This is a product quality parameters durability safety performance ppt powerpoint presentation portfolio portrait. This is a four stage process. The stages in this process are quality assurance, quality management, quality standards.
Pie Chart For Measuring Marketing Performance Ppt PowerPoint Presentation Icon Format
This is a pie chart for measuring marketing performance ppt powerpoint presentation icon format. This is a eight stage process. The stages in this process are b2b marketing strategy, b2b marketing plan, b2b marketing approach.
Warehouse Performance KPIS Inventory Accuracy Real Time Reporting Ppt PowerPoint Presentation Icon Maker
This is a warehouse performance kpis inventory accuracy real time reporting ppt powerpoint presentation icon maker. This is a five stage process. The stages in this process are supply chain management, order fulfilment.

Hedge Funds Performance Contribution Ppt PowerPoint Presentation Infographic Template Visual Aids
This is a hedge funds performance contribution ppt powerpoint presentation infographic template visual aids. This is a five stage process. The stages in this process are business, management, strategy, analysis, marketing.
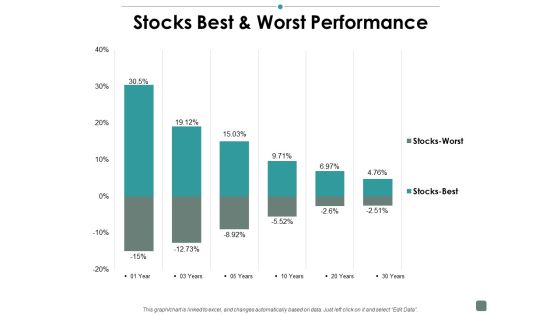
Stocks Best And Worst Performance Contribution Ppt PowerPoint Presentation Gallery Tips
This is a stocks best and worst performance contribution ppt powerpoint presentation gallery tips. This is a two stage process. The stages in this process are finanace, marketing, business, management, strategy.
Financial Performance Report Vector Icon Ppt Powerpoint Presentation Pictures Background Image
This is a financial performance report vector icon ppt powerpoint presentation pictures background image. This is a four stage process. The stages in this process are financial statements icon, accounting ratio icon, balance sheet icon.

Product Competitive Analysis Feature And Performance Ppt Powerpoint Presentation Show Graphics Design
This is a product competitive analysis feature and performance ppt powerpoint presentation show graphics design. This is a five stage process. The stages in this process are competitive analysis, product differentiation, product competition.

Daily Weekly Monthly Performance Management Plan Ppt Powerpoint Presentation Gallery Graphics Design
This is a daily weekly monthly performance management plan ppt powerpoint presentation gallery graphics design. This is a three stage process. The stages in this process are six sigma, operating rhythm, business rhythm.
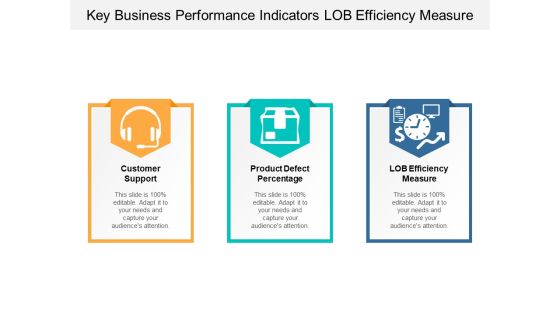
Key Business Performance Indicators Lob Efficiency Measure Ppt Powerpoint Presentation Infographics File Formats
This is a key business performance indicators lob efficiency measure ppt powerpoint presentation infographics file formats. This is a three stage process. The stages in this process are dashboard, kpi, metrics.
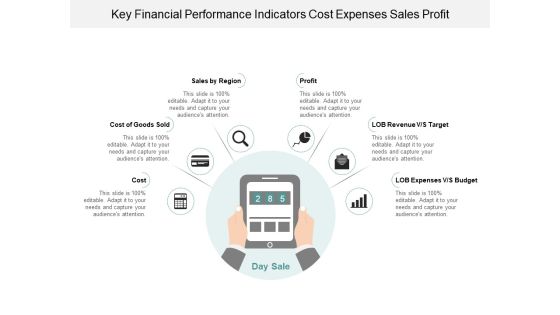
Key Financial Performance Indicators Cost Expenses Sales Profit Ppt Powerpoint Presentation Infographic Template Graphic Images
This is a key financial performance indicators cost expenses sales profit ppt powerpoint presentation infographic template graphic images. This is a six stage process. The stages in this process are dashboard, kpi, metrics.
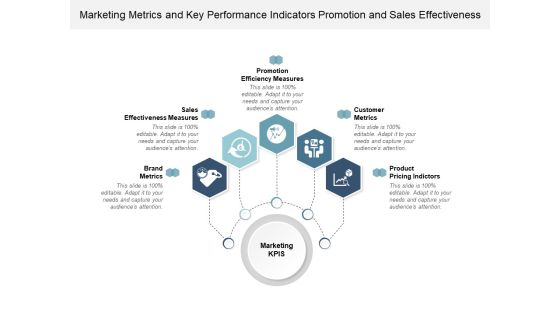
Marketing Metrics And Key Performance Indicators Promotion And Sales Effectiveness Ppt Powerpoint Presentation Infographics Graphics Example
This is a marketing metrics and key performance indicators promotion and sales effectiveness ppt powerpoint presentation infographics graphics example. This is a five stage process. The stages in this process are dashboard, kpi, metrics.
Performance Indicators Of Business Icons Ppt Powerpoint Presentation Infographics Graphics Template
This is a performance indicators of business icons ppt powerpoint presentation infographics graphics template. This is a four stage process. The stages in this process are dashboard, kpi, metrics.

Profitability Key Performance Indicators Financial Activities Cash Flow Ppt Powerpoint Presentation Portfolio Clipart Images
This is a profitability key performance indicators financial activities cash flow ppt powerpoint presentation portfolio clipart images. This is a five stage process. The stages in this process are dashboard, kpi, metrics.
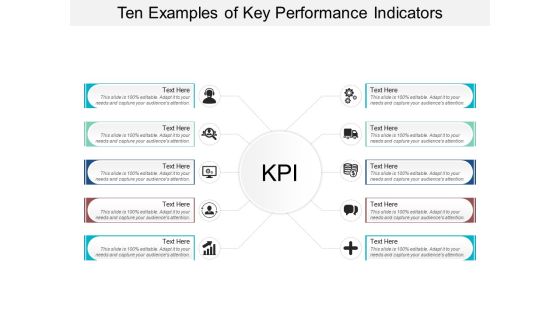
Ten Examples Of Key Performance Indicators Ppt Powerpoint Presentation Layouts Professional
This is a ten examples of key performance indicators ppt powerpoint presentation layouts professional. This is a ten stage process. The stages in this process are dashboard, kpi, metrics.

Risk Impact And Probability Analysis Performance Ppt Powerpoint Presentation Infographics Deck
This is a risk impact and probability analysis performance ppt powerpoint presentation infographics deck. This is a five stage process. The stages in this process are business, management, planning, strategy, marketing.

Online Business Strategy Market Research And Performance Analytics Ppt Powerpoint Presentation Infographics Images
This is a online business strategy market research and performance analytics ppt powerpoint presentation infographics images. This is a five stage process. The stages in this process are ecommerce, mercantilism, commercialism.

Supplier Performance Management Scorecard Business Ppt Powerpoint Presentation Infographics Slide Portrait
This is a supplier performance management scorecard business ppt powerpoint presentation infographics slide portrait. This is a five stage process. The stages in this process are business, management, planning, strategy, marketing.
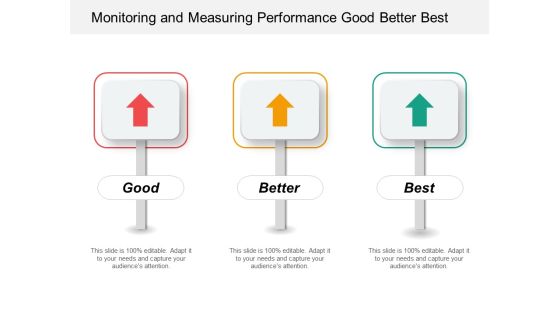
Monitoring And Measuring Performance Good Better Best Ppt Powerpoint Presentation Gallery Graphics
This is a monitoring and measuring performance good better best ppt powerpoint presentation gallery graphics. This is a three stage process. The stages in this process are good better best, good great superb, good great excellent.
Performance Tracking Good Better Best With Icons Ppt Powerpoint Presentation Show Graphics
This is a performance tracking good better best with icons ppt powerpoint presentation show graphics. This is a three stage process. The stages in this process are good better best, good great superb, good great excellent.

Benchmarking And Performance Evaluation Culture Collaboration Contribution Ppt Powerpoint Presentation Layouts Templates
This is a benchmarking and performance evaluation culture collaboration contribution ppt powerpoint presentation layouts templates. This is a six stage process. The stages in this process are best practice, best technique, best procedure.

Benchmarking Tools Performance Knowledge Competence Vision Development Ppt Powerpoint Presentation Portfolio Graphics Pictures
This is a benchmarking tools performance knowledge competence vision development ppt powerpoint presentation portfolio graphics pictures. This is a eight stage process. The stages in this process are best practice, best technique, best procedure.

Performance Management Benchmarking Decision Making Engagement And Increment Ppt Powerpoint Presentation Outline Deck
This is a performance management benchmarking decision making engagement and increment ppt powerpoint presentation outline deck. This is a six stage process. The stages in this process are best practice, best technique, best procedure.

Data Statistics Charts And Key Performance Indicators Ppt Powerpoint Presentation Layouts Guide
This is a data statistics charts and key performance indicators ppt powerpoint presentation layouts guide. This is a four stage process. The stages in this process are business metrics, business kpi, business dashboard.
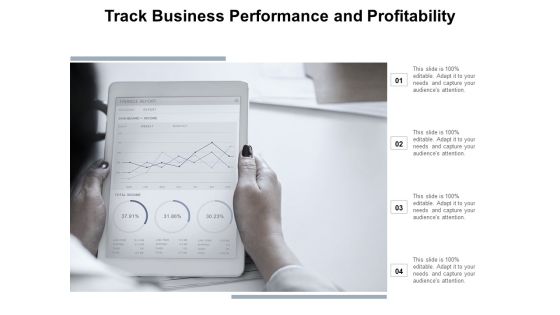
Track Business Performance And Profitability Ppt Powerpoint Presentation File Master Slide
This is a track business performance and profitability ppt powerpoint presentation file master slide. This is a four stage process. The stages in this process are business metrics, business kpi, business dashboard.
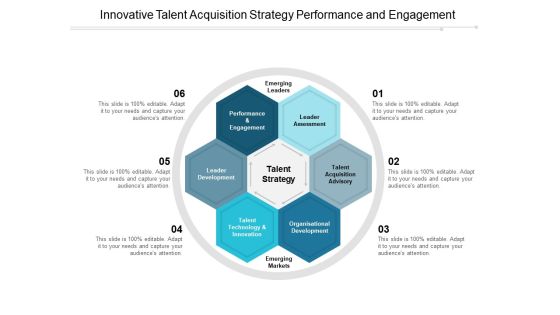
Innovative Talent Acquisition Strategy Performance And Engagement Ppt PowerPoint Presentation Slides Background
This is a innovative talent acquisition strategy performance and engagement ppt powerpoint presentation slides background. This is a six stage process. The stages in this process are talent strategy, talent plan, talent approach.
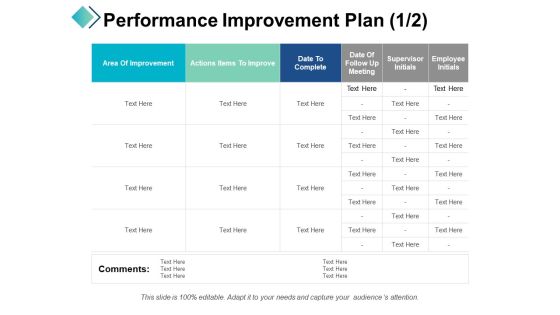
Performance Improvement Plan Area Of Improvement Ppt PowerPoint Presentation Slides Background Image
This is a performance improvement plan area of improvement ppt powerpoint presentation slides background image. This is a four stage process. The stages in this process are management, strategy, analysis, business, marketing.
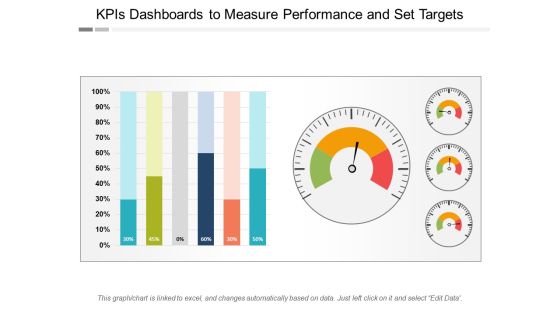
Kpis Dashboards To Measure Performance And Set Targets Ppt PowerPoint Presentation Gallery Visual Aids
This is a kpis dashboards to measure performance and set targets ppt powerpoint presentation gallery visual aids. This is a four stage process. The stages in this process are project dashboard, project kpis, project metrics.
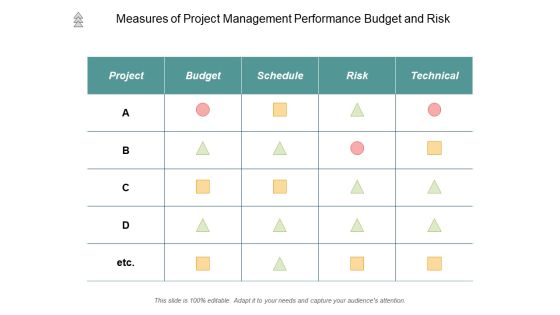
Measures Of Project Management Performance Budget And Risk Ppt PowerPoint Presentation Outline Graphics Design
This is a measures of project management performance budget and risk ppt powerpoint presentation outline graphics design. This is a four stage process. The stages in this process are project dashboard, project kpis, project metrics.
Measures Of Project Management Performance Quality Actions Time Cost Ppt PowerPoint Presentation Styles Icons
This is a measures of project management performance quality actions time cost ppt powerpoint presentation styles icons. This is a six stage process. The stages in this process are project dashboard, project kpis, project metrics.

Availability Key Performance Indicator Inventory Turnover Ratio Ppt Powerpoint Presentation Layouts Graphics Download
This is a availability key performance indicator inventory turnover ratio ppt powerpoint presentation layouts graphics download. This is a two stage process. The stages in this process are availability kpi, availability dashboard, availability metrics.

Factors Affecting Work Performance Communication And Cooperation Ppt Powerpoint Presentation Infographics Introduction
This is a factors affecting work performance communication and cooperation ppt powerpoint presentation infographics introduction. This is a four stage process. The stages in this process are business outcomes, business results, business output.

Yearly Roadmap For Business Performance Analysis And Planning Ppt Powerpoint Presentation Show Professional
This is a yearly roadmap for business performance analysis and planning ppt powerpoint presentation show professional. This is a five stage process. The stages in this process are business outcomes, business results, business output.
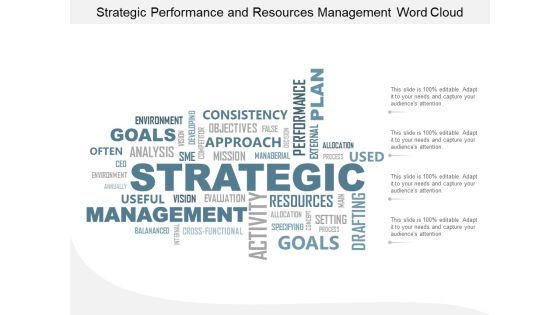
Strategic Performance And Resources Management Word Cloud Ppt Powerpoint Presentation Professional Slides
This is a strategic performance and resources management word cloud ppt powerpoint presentation professional slides. This is a four stage process. The stages in this process are success, business, motivation, management, always, objectives, item, organizational, money, taking.
Risk Impact And Probability Analysis Performance Ppt Powerpoint Presentation Inspiration Picture Ppt Powerpoint Presentation Icon Skills
This is a risk impact and probability analysis performance ppt powerpoint presentation inspiration picture ppt powerpoint presentation icon skills. This is a three stage process. The stages in this process are business, management, planning, strategy, marketing.

Business Performance Review Taking Actions And Improving Ppt PowerPoint Presentation Icon Background
This is a business performance review taking actions and improving ppt powerpoint presentation icon background. This is a four stage process. The stages in this process are data analysis, data review, data evaluation.

Man In Gear For Performance Management Ppt PowerPoint Presentation Summary Influencers
This is a man in gear for performance management ppt powerpoint presentation summary influencers. This is a four stage process. The stages in this process are employee information system, staff management system.
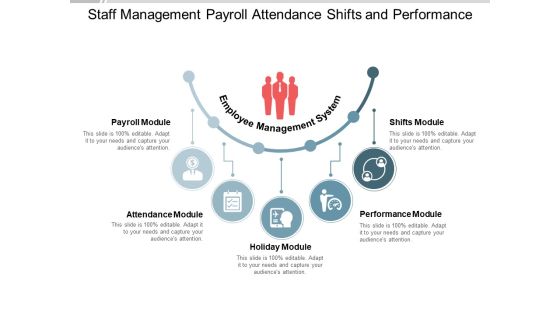
Staff Management Payroll Attendance Shifts And Performance Ppt PowerPoint Presentation Infographics Ideas
This is a staff management payroll attendance shifts and performance ppt powerpoint presentation infographics ideas. This is a five stage process. The stages in this process are employee information system, staff management system.
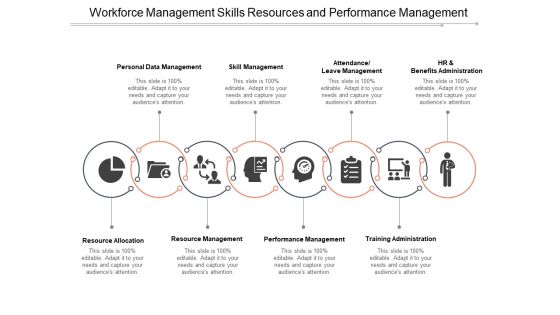
Workforce Management Skills Resources And Performance Management Ppt PowerPoint Presentation Layouts Visual Aids
This is a workforce management skills resources and performance management ppt powerpoint presentation layouts visual aids. This is a eight stage process. The stages in this process are employee information system, staff management system.

Workforce Management Work Report And Performance Analysis Ppt PowerPoint Presentation Styles Layouts
This is a workforce management work report and performance analysis ppt powerpoint presentation styles layouts. This is a twelve stage process. The stages in this process are employee information system, staff management system.

Quarterly Financial Performance Ratio Analysis Ppt PowerPoint Presentation Model Format Ideas
This is a quarterly financial performance ratio analysis ppt powerpoint presentation model format ideas. This is a four stage process. The stages in this process are financial analysis, quantitative, statistical modelling.
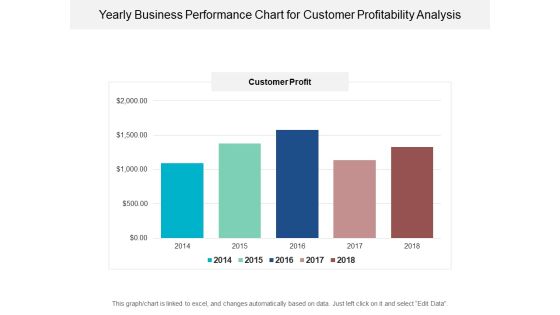
Yearly Business Performance Chart For Customer Profitability Analysis Ppt PowerPoint Presentation Ideas Picture
This is a yearly business performance chart for customer profitability analysis ppt powerpoint presentation ideas picture. This is a five stage process. The stages in this process are financial analysis, quantitative, statistical modelling.

Sales Competition For Sales Performance Management Ppt PowerPoint Presentation Summary Guidelines
This is a sales competition for sales performance management ppt powerpoint presentation summary guidelines. This is a three stage process. The stages in this process are sales contest, sales competition, sales opposition.
Sales Contest To Improve Sales Performance With Icons Ppt PowerPoint Presentation Professional Inspiration
This is a sales contest to improve sales performance with icons ppt powerpoint presentation professional inspiration. This is a three stage process. The stages in this process are sales contest, sales competition, sales opposition.

2018 Year In Review Performance Assessment Ppt PowerPoint Presentation Layouts Graphics Example
This is a 2018 year in review performance assessment ppt powerpoint presentation layouts graphics example. This is a four stage process. The stages in this process are year in review, yearly highlights, countdowns.

Business Review And Performance Assessment Dashboards Ppt PowerPoint Presentation Infographics Show
This is a business review and performance assessment dashboards ppt powerpoint presentation infographics show. This is a four stage process. The stages in this process are year in review, yearly highlights, countdowns.
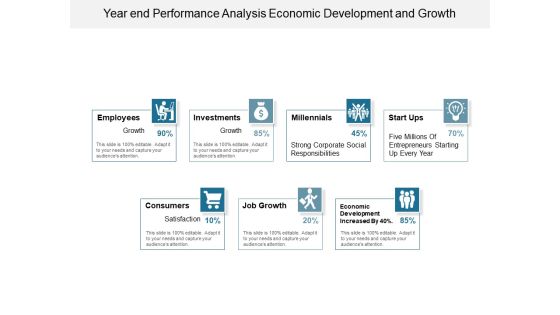
Year End Performance Analysis Economic Development And Growth Ppt PowerPoint Presentation Infographic Template Shapes
This is a year end performance analysis economic development and growth ppt powerpoint presentation infographic template shapes. This is a seven stage process. The stages in this process are year in review, yearly highlights, countdowns.
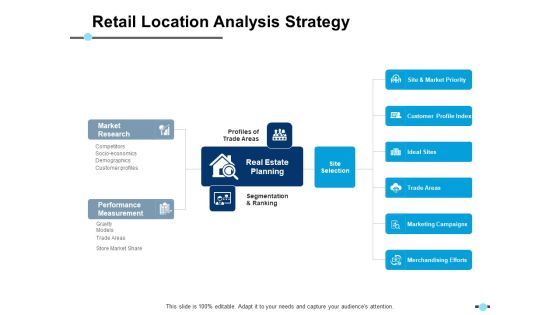
Retail Location Analysis Strategy Performance Measurement Ppt PowerPoint Presentation Slides Templates
This is a retail location analysis strategy performance measurement ppt powerpoint presentation slides templates. This is a two stage process. The stages in this process are business, management, strategy, analysis, marketing.

Product Performance And Profitability Report Unit Costs Sales And Revenues Analysis Ppt PowerPoint Presentation Model Show
This is a product performance and profitability report unit costs sales and revenues analysis ppt powerpoint presentation model show. This is a five stage process. The stages in this process are business unit profitability, profitable organization, corporate unit profitability.
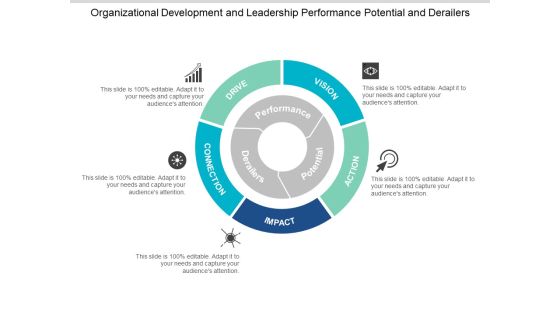
Organizational Development And Leadership Performance Potential And Derailers Ppt PowerPoint Presentation Gallery Inspiration
This is a organizational development and leadership performance potential and derailers ppt powerpoint presentation gallery inspiration. This is a five stage process. The stages in this process are leadership model, leadership framework, leadership structure.

Business Timeline For Past Performance And Future Planning Ppt PowerPoint Presentation Summary Files
This is a business timeline for past performance and future planning ppt powerpoint presentation summary files. This is a five stage process. The stages in this process are office timeline, office roadmap, office schedule.
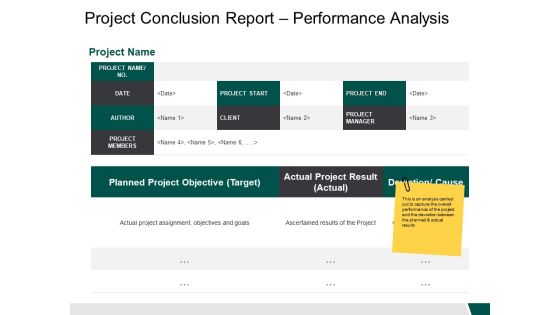
Project Conclusion Report Performance Analysis Planned Ppt PowerPoint Presentation Outline Samples
This is a project conclusion report performance analysis planned ppt powerpoint presentation outline samples. This is a two stage process. The stages in this process are business, management, strategy, analysis, marketing.
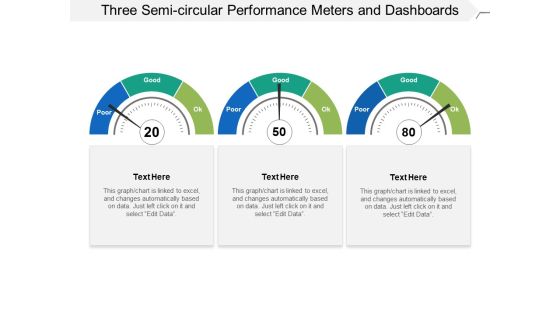
Three Semi Circular Performance Meters And Dashboards Ppt PowerPoint Presentation Slides Influencers
This is a three semi circular performance meters and dashboards ppt powerpoint presentation slides influencers. This is a three stage process. The stages in this process are fuel gauge, gas gauge, fuel containers.

Sales Performance Dashboard Template 2 Of 2 Ppt PowerPoint Presentation Infographics Design Inspiration
This is a sales performance dashboard template 2 of 2 ppt powerpoint presentation infographics design inspiration. This is a three stage process. The stages in this process are finance, management, strategy, analysis, marketing.

Contract Performance Management Administration And Monitoring Ppt PowerPoint Presentation Inspiration Deck
This is a contract performance management administration and monitoring ppt powerpoint presentation inspiration deck. This is a five stage process. The stages in this process are contract management, contract negotiation, deal making.
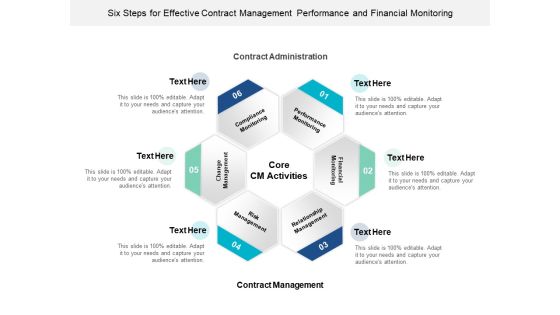
Six Steps For Effective Contract Management Performance And Financial Monitoring Ppt PowerPoint Presentation Portfolio Show
This is a six steps for effective contract management performance and financial monitoring ppt powerpoint presentation portfolio show. This is a five stage process. The stages in this process are contract management, contract negotiation, deal making.

Return On Capital Employed Product Performance Chart Ppt PowerPoint Presentation Portfolio Visuals
This is a return on capital employed product performance chart ppt powerpoint presentation portfolio visuals. This is a three stage process. The stages in this process are accounting ratio, roce, return on capital employed.

Cloud Adoption Blueprint Development Planning Performance And Scalability Optimization Ppt PowerPoint Presentation Model Clipart
This is a cloud adoption blueprint development planning performance and scalability optimization ppt powerpoint presentation model clipart. This is a four stage process. The stages in this process are cloud strategy, cloud planning, cloud management.

100 Days Strategy Key Milestones To Drive Performance Ppt PowerPoint Presentation Model Inspiration
This is a 100 days strategy key milestones to drive performance ppt powerpoint presentation model inspiration. This is a four stage process. The stages in this process are 100 day plan, 100 day action plan, 100 day strategy.

Five Priorities Of Building High Performance Teams Ppt PowerPoint Presentation Slides Microsoft
This is a five priorities of building high performance teams ppt powerpoint presentation slides microsoft. This is a five stage process. The stages in this process are 5 priorities, five priorities, 5 preference.
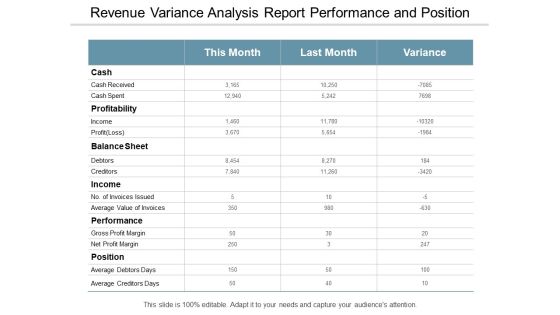
Revenue Variance Analysis Report Performance And Position Ppt PowerPoint Presentation Sample
This is a revenue variance analysis report performance and position ppt powerpoint presentation sample. This is a three stage process. The stages in this process are accounting review, accounting report, accounting statement.

Business Growth Arrow With Icons Define Needs And Measure Performance Ppt Powerpoint Presentation Inspiration Introduction
This is a business growth arrow with icons define needs and measure performance ppt powerpoint presentation inspiration introduction. This is a four stage process. The stages in this process are increasing arrows, improving arrows, growing arrows.

Business Timeline For Monthly Performance Evaluation Ppt Powerpoint Presentation Show Slide Download
This is a business timeline for monthly performance evaluation ppt powerpoint presentation show slide download. This is a five stage process. The stages in this process are monthly roadmap, 30 day roadmap, monthly timeline.

Closing The Strategy To Performance Gap Ppt PowerPoint Presentation Complete Deck With Slides
This is a closing the strategy to performance gap ppt powerpoint presentation complete deck with slides. This is a one stage process. The stages in this process are marketing, business, management, planning, strategy.

Closing The Strategy To Performance Gap Slide Ppt PowerPoint Presentation Ideas Designs
This is a closing the strategy to performance gap slide ppt powerpoint presentation ideas designs. This is a three stage process. The stages in this process are technology, marketing, planning, business, management.

Closing The Strategy To Performance Gap Ppt PowerPoint Presentation Portfolio Clipart
This is a closing the strategy to performance gap ppt powerpoint presentation portfolio clipart. This is a seven stage process. The stages in this process are marketing, business, management, planning, strategy.

Thank You Closing The Strategy To Performance Gap Ppt PowerPoint Presentation Styles Graphic Tips
This is a thank you closing the strategy to performance gap ppt powerpoint presentation styles graphic tips. This is a one stage process. The stages in this process are thank you, risk matrix business, management, planning, strategy.

Five Linear Arrows Planning Performance And Control Ppt Powerpoint Presentation Portfolio Show
This is a five linear arrows planning performance and control ppt powerpoint presentation portfolio show. This is a five stage process. The stages in this process are arrow steps, arrow stages, arrow phases.

Business Compliance And Operations Planning Strategy Performance Ppt Powerpoint Presentation Infographics Portrait
This is a business compliance and operations planning strategy performance ppt powerpoint presentation infographics portrait. This is a four stage process. The stages in this process are governance model, governance flow, governance structures.
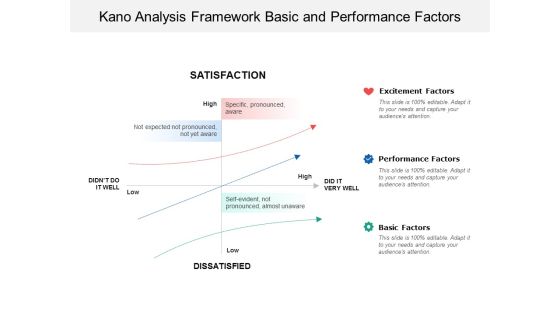
Kano Analysis Framework Basic And Performance Factors Ppt PowerPoint Presentation Pictures Clipart Images
This is a kano analysis framework basic and performance factors ppt powerpoint presentation pictures clipart images. This is a three stage process. The stages in this process are product development, kano model, kano framework.

Annual Review Document For Performance Appraisal Ppt Powerpoint Presentation Design Templates
This is a annual review document for performance appraisal ppt powerpoint presentation design templates. This is a three stage process. The stages in this process are year end review, annual review, yearly review.

End Of Year Employee Performance Review Document Ppt Powerpoint Presentation Gallery Professional
This is a end of year employee performance review document ppt powerpoint presentation gallery professional. This is a one stage process. The stages in this process are year end review, annual review, yearly review.
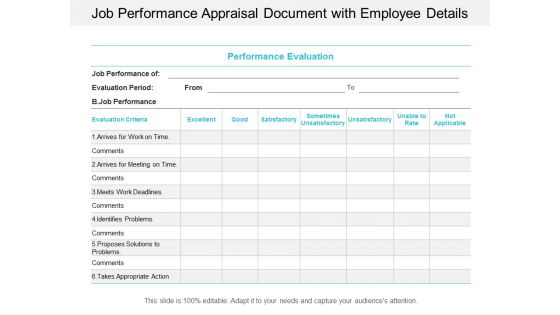
Job Performance Appraisal Document With Employee Details Ppt Powerpoint Presentation Ideas Portfolio
This is a job performance appraisal document with employee details ppt powerpoint presentation ideas portfolio. This is a six stage process. The stages in this process are year end review, annual review, yearly review.
Mid Year Performance Review Training And Feedback Ppt Powerpoint Presentation Model Icon
This is a mid year performance review training and feedback ppt powerpoint presentation model icon. This is a three stage process. The stages in this process are year end review, annual review, yearly review.

Performance Evaluation Document With Employee Information Ppt Powerpoint Presentation File Outline
This is a performance evaluation document with employee information ppt powerpoint presentation file outline. This is a one stage process. The stages in this process are year end review, annual review, yearly review.
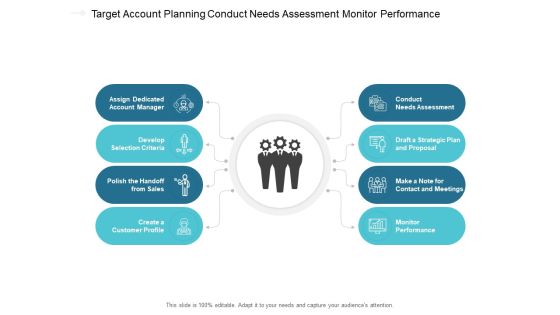
Target Account Planning Conduct Needs Assessment Monitor Performance Ppt PowerPoint Presentation Ideas Images Cpb
This is a target account planning conduct needs assessment monitor performance ppt powerpoint presentation ideas images cpb. This is a eight stage process. The stages in this process are account plan, sales planning, account strategy.
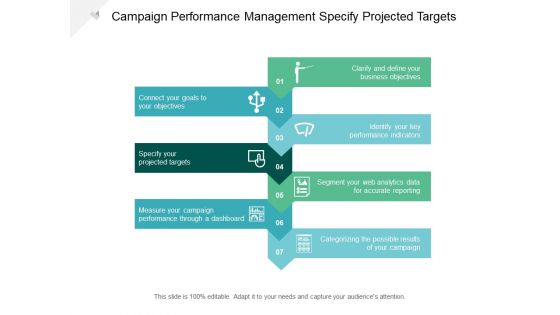
Campaign Performance Management Specify Projected Targets Ppt PowerPoint Presentation Layouts Topics Cpb
This is a campaign performance management specify projected targets ppt powerpoint presentation layouts topics cpb. This is a seven stage process. The stages in this process are data analysis, analytics architecture, analytics framework.

Seven Stages Web Data Analysis Identify Key Performance Indicators Ppt PowerPoint Presentation Infographics Example Topics Cpb
This is a seven stages web data analysis identify key performance indicators ppt powerpoint presentation infographics example topics cpb. This is a seven stage process. The stages in this process are data analysis, analytics architecture, analytics framework.
Employee Performance Management Vector Icon Ppt PowerPoint Presentation Slides Example Introduction
This is a employee performance management vector icon ppt powerpoint presentation slides example introduction. This is a three stage process. The stages in this process are activity tracker, business, marketing.

Improve Work Performance Attain Leadership Role Ppt PowerPoint Presentation File Samples
This is a improve work performance attain leadership role ppt powerpoint presentation file samples. This is a seven stage process. The stages in this process are career objectives, career goals, career targets.

Measure Performance And Set Targets Achieve Greater Focus Ppt PowerPoint Presentation Gallery Slides
This is a measure performance and set targets achieve greater focus ppt powerpoint presentation gallery slides. This is a one stage process. The stages in this process are career objectives, career goals, career targets.

Two Products Features And Performance Comparison Chart Ppt Powerpoint Presentation Ideas Layout Ideas
This is a two products features and performance comparison chart ppt powerpoint presentation ideas layout ideas. This is a two stage process. The stages in this process are product differentiation, product comparison, brand differentiation.
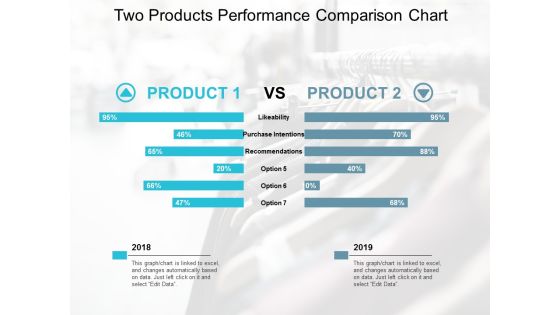
Two Products Performance Comparison Chart Ppt Powerpoint Presentation Outline Design Inspiration
This is a two products performance comparison chart ppt powerpoint presentation outline design inspiration. The topics discussed in this diagram are product differentiation, product comparison, brand differentiation. This is a completely editable PowerPoint presentation, and is available for immediate download.

Two Products Performance Usability And Features Comparison Ppt Powerpoint Presentation Infographic Template Portrait
This is a two products performance usability and features comparison ppt powerpoint presentation infographic template portrait. This is a two stage process. The stages in this process are product differentiation, product comparison, brand differentiation.

Five Linear Arrows Planning Performance And Control Ppt Powerpoint Presentation Slides Templates
This is a five linear arrows planning performance and control ppt powerpoint presentation slides templates. This is a five stage process. The stages in this process are arrow steps, arrow stages, arrow phases.
Market Performance Growth Arrow Vector Icon Ppt Powerpoint Presentation Summary Template
This is a market performance growth arrow vector icon ppt powerpoint presentation summary template. The topics discussed in this diagram are increase icon, improved icon, growth icon. This is a completely editable PowerPoint presentation, and is available for immediate download.
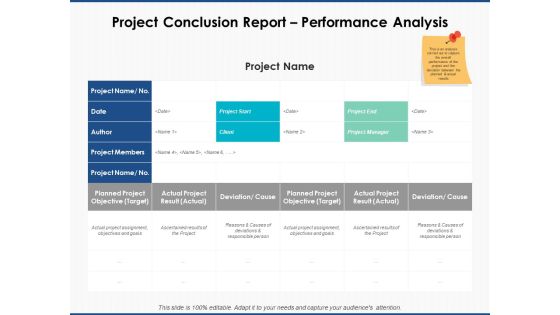
Project Conclusion Report Performance Analysis Ppt PowerPoint Presentation Diagram Graph Charts
This is a project conclusion report performance analysis ppt powerpoint presentation diagram graph charts. The topics discussed in this diagram are marketing, business, management, planning, strategy This is a completely editable PowerPoint presentation, and is available for immediate download.

Assessing Performance In Energy Sector Ppt PowerPoint Presentation Complete Deck With Slides
This is a assessing performance in energy sector ppt powerpoint presentation complete deck with slides. The topics discussed in this diagram are business, management, planning, strategy, marketing. This is a completely editable PowerPoint presentation, and is available for immediate download.
Five Funnel Steps Integrity Evaluating Performance With Icons Ppt Powerpoint Presentation Model Demonstration
This is a five funnel steps integrity evaluating performance with icons ppt powerpoint presentation model demonstration. This is a five stage process. The stages in this process are funnel arrow, funnel conversion, arrow canning funnel.

Performance Evaluation In Energy Sector Ppt PowerPoint Presentation Complete Deck With Slides
This is a performance evaluation in energy sector ppt powerpoint presentation complete deck with slides. The topics discussed in this diagram are business, management, marketing, planning. This is a completely editable PowerPoint presentation, and is available for immediate download.
Performance Evaluation In Energy Sector Icons Slide Ppt PowerPoint Presentation Infographics Slide Portrait
This is a performance evaluation in energy sector icons slide ppt powerpoint presentation infographics slide portrait. The topics discussed in this diagram are management, planning, business, marketing. This is a completely editable PowerPoint presentation, and is available for immediate download.

Thank You For Your Attention Performance Evaluation In Energy Sector Ppt PowerPoint Presentation Slides Display
This is a thank you for your attention performance evaluation in energy sector ppt powerpoint presentation slides display. This is a one stage process. The stages in this process are thank you.
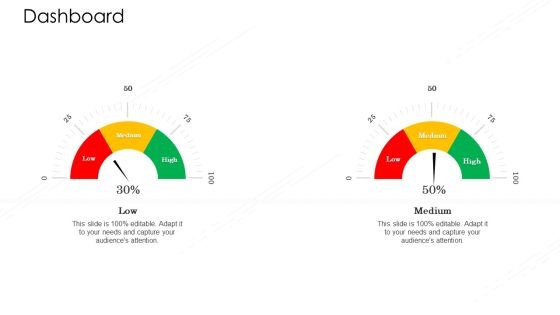
Value Chain Techniques For Performance Assessment Dashboard Ppt Layouts Microsoft PDF
This is a value chain techniques for performance assessment dashboard ppt layouts microsoft pdf. template with various stages. Focus and dispense information on two showcase facts, figures, and other relevant content using this PPT layout. Grab it now.
How To Administer Accounts To Increase Sales Revenue Present Account Based Performance Delivery Gap Icons PDF
This slide provides information regarding the present delivery gap that firm is facing in terms of its performance as compared to the industry standards. The firms performance is assessed on metrics such as number of accounts closed, conversion rate, etc. This is a how to administer accounts to increase sales revenue present account based performance delivery gap icons pdf template with various stages. Focus and dispense information on one stages using this creative set, that comes with editable features. It contains large content boxes to add your information on topics like performance metrics, industry benchmark, own firm, sales effectiveness. You can also showcase facts, figures, and other relevant content using this PPT layout. Grab it now.

Advancement Of Retail Store In Future Analyzing Present Performance Delivery Gap Guidelines PDF
This slide provides information regarding the present delivery gap that retail store is facing in terms of its performance as compared to the industry standards. The firms performance is assessed on metrics such as marketing effectiveness, response rate, forecast accuracy, lead qualification rate, etc. Presenting advancement of retail store in future analyzing present performance delivery gap guidelines pdf to provide visual cues and insights. Share and navigate important information on five stages that need your due attention. This template can be used to pitch topics like performance metrics, industry benchmark, retail store, online store. In addtion, this PPT design contains high resolution images, graphics, etc, that are easily editable and available for immediate download.
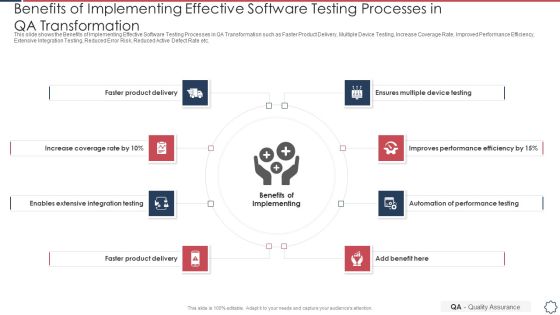
Quality Assurance Transformation Strategies To Improve Business Performance Efficiency Benefits Of Implementing Template PDF
This slide shows the Benefits of Implementing Effective Software Testing Processes in QA Transformation such as Faster Product Delivery, Multiple Device Testing, Increase Coverage Rate, Improved Performance Efficiency, Extensive Integration Testing, Reduced Error Risk, Reduced Active Defect Rate etc. Presenting quality assurance transformation strategies to improve business performance efficiency benefits of implementing template pdf to provide visual cues and insights. Share and navigate important information on eight stages that need your due attention. This template can be used to pitch topics like increase coverage rate, enables extensive integration testing, faster product delivery, automation of performance testing, improves performance efficiency. In addtion, this PPT design contains high resolution images, graphics, etc, that are easily editable and available for immediate download.

Checklist Steps For Evaluating And Enhancing Workforce Performance Ppt PowerPoint Presentation Ideas Background Designs PDF
Mentioned slide showcases checklist points to effectively evaluate and boost employee performance with doubling the engagement rate. It includes regular performance review, record staff achievements and mishaps, standard evaluation, reward and recognition, schedule one on one sessions, offering feedbacks, peer to peer evaluation and schedule training.Persuade your audience using this Checklist Steps For Evaluating And Enhancing Workforce Performance Ppt PowerPoint Presentation Ideas Background Designs PDF. This PPT design covers nine stages, thus making it a great tool to use. It also caters to a variety of topics including Performance Review, Sessions Employees, Offering Feedbacks. Download this PPT design now to present a convincing pitch that not only emphasizes the topic but also showcases your presentation skills.

Creating New Product Launch Campaign Strategy Touchpoints To Measure Campaign Performance Icons PDF
Mentioned slide illustrates the performance comparison of companys touchpoint with respect to its competitor. Performance measurement is based on the feelings about touchpoint Vs impact on likelihood of purchase. Get a simple yet stunning designed Creating New Product Launch Campaign Strategy Touchpoints To Measure Campaign Performance Icons PDF. It is the best one to establish the tone in your meetings. It is an excellent way to make your presentations highly effective. So, download this PPT today from Slidegeeks and see the positive impacts. Our easy to edit Creating New Product Launch Campaign Strategy Touchpoints To Measure Campaign Performance Icons PDF can be your go to option for all upcoming conferences and meetings. So, what are you waiting for Grab this template today.

Construction Site Safety Measure Performance Of Projects Undertaken By The Company Slides PDF
This slide highlights the dashboard to showcase the performance of multiple projects undertaken by the construction company based on KPIs schedule performance index SPI and cost performance index CPI. It also includes details regarding the number of projects undertaken and contracted value.Take your projects to the next level with our ultimate collection of Construction Site Safety Measure Performance Of Projects Undertaken By The Company Slides PDF. Slidegeeks has designed a range of layouts that are perfect for representing task or activity duration, keeping track of all your deadlines at a glance. Tailor these designs to your exact needs and give them a truly corporate look with your own brand colors they all make your projects stand out from the rest.

Ppc Campaign Performance Measuring Dashboard Guide To Personal Branding Pictures PDF
Mentioned slide displays KPI dashboard that can be used to track the performance of PPC campaign. Metrics covered are AD cost, clicks, impressions, CTR and cost per conversion.Presenting this PowerPoint presentation, titled Ppc Campaign Performance Measuring Dashboard Guide To Personal Branding Pictures PDF, with topics curated by our researchers after extensive research. This editable presentation is available for immediate download and provides attractive features when used. Download now and captivate your audience. Presenting this Ppc Campaign Performance Measuring Dashboard Guide To Personal Branding Pictures PDF. Our researchers have carefully researched and created these slides with all aspects taken into consideration. This is a completely customizable Ppc Campaign Performance Measuring Dashboard Guide To Personal Branding Pictures PDF that is available for immediate downloading. Download now and make an impact on your audience. Highlight the attractive features available with our PPTs.

Performance Evaluation Grid To Identify Employees For Understudy Training Graphics PDF
This slides showcases performance evaluation grid that can help organization to identify potential employees for understudy training program. It evaluate employees on the basis of performance and potential. Get a simple yet stunning designed Performance Evaluation Grid To Identify Employees For Understudy Training Graphics PDF. It is the best one to establish the tone in your meetings. It is an excellent way to make your presentations highly effective. So, download this PPT today from Slidegeeks and see the positive impacts. Our easy to edit Performance Evaluation Grid To Identify Employees For Understudy Training Graphics PDF can be your go to option for all upcoming conferences and meetings. So, what are you waiting for Grab this template today.
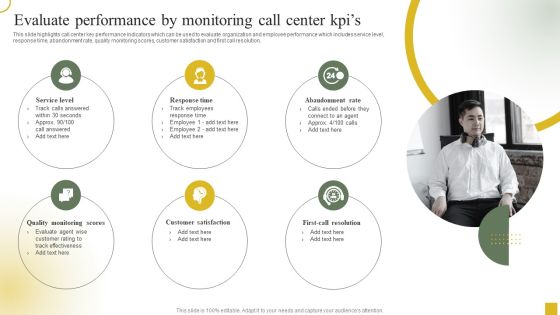
Strategic Plan For Call Center Employees Evaluate Performance By Monitoring Call Center Kpis Guidelines PDF
This slide highlights call center key performance indicators which can be used to evaluate organization and employee performance which includes service level, response time, abandonment rate, quality monitoring scores, customer satisfaction and first call resolution. Get a simple yet stunning designed Strategic Plan For Call Center Employees Evaluate Performance By Monitoring Call Center Kpis Guidelines PDF. It is the best one to establish the tone in your meetings. It is an excellent way to make your presentations highly effective. So, download this PPT today from Slidegeeks and see the positive impacts. Our easy to edit Strategic Plan For Call Center Employees Evaluate Performance By Monitoring Call Center Kpis Guidelines PDF can be your go to option for all upcoming conferences and meetings. So, what are you waiting for Grab this template today.

Campaign Sessions And Conversion Performance Dashboard Strategic Promotion Plan To Improve Inspiration PDF
Following slide illustrates campaign session and conversion performance dashboard. It covers details such as revenues, cost per click, transactions, impressions, sessions and conversion performance.Do you have to make sure that everyone on your team knows about any specific topic I yes, then you should give Campaign Sessions And Conversion Performance Dashboard Strategic Promotion Plan To Improve Inspiration PDF a try. Our experts have put a lot of knowledge and effort into creating this impeccable Campaign Sessions And Conversion Performance Dashboard Strategic Promotion Plan To Improve Inspiration PDF. You can use this template for your upcoming presentations, as the slides are perfect to represent even the tiniest detail. You can download these templates from the Slidegeeks website and these are easy to edit. So grab these today.

Competitive Landscape Analysis Based On Product Performance Strategic Promotion Plan Template PDF
Following slide displays competitive landscape analysis based on product performance. Performance is measured based on attributes namely market awareness, product quality, customer experience etc.Find highly impressive Competitive Landscape Analysis Based On Product Performance Strategic Promotion Plan Template PDF on Slidegeeks to deliver a meaningful presentation. You can save an ample amount of time using these presentation templates. No need to worry to prepare everything from scratch because Slidegeeks experts have already done a huge research and work for you. You need to download Competitive Landscape Analysis Based On Product Performance Strategic Promotion Plan Template PDF for your upcoming presentation. All the presentation templates are 100 precent editable and you can change the color and personalize the content accordingly. Download now.

Quality Enhancement Strategic Evaluate Performance By Monitoring Call Center Kpis Rules PDF
This slide highlights call center key performance indicators which can be used to evaluate organization and employee performance which includes service level, response time, abandonment rate, quality monitoring scores, customer satisfaction and first call resolution. Formulating a presentation can take up a lot of effort and time, so the content and message should always be the primary focus. The visuals of the PowerPoint can enhance the presenters message, so our Quality Enhancement Strategic Evaluate Performance By Monitoring Call Center Kpis Rules PDF was created to help save time. Instead of worrying about the design, the presenter can concentrate on the message while our designers work on creating the ideal templates for whatever situation is needed. Slidegeeks has experts for everything from amazing designs to valuable content, we have put everything into Quality Enhancement Strategic Evaluate Performance By Monitoring Call Center Kpis Rules PDF.

BPO Performance Improvement Action Plan Impact Of Poor Customer Support At Call Center Background PDF
This slide highlights the impacts on the company of poor customer support at BPO call center which showcases comparison of call center companies performance with quarterly revenue. Presenting this PowerPoint presentation, titled BPO Performance Improvement Action Plan Impact Of Poor Customer Support At Call Center Background PDF, with topics curated by our researchers after extensive research. This editable presentation is available for immediate download and provides attractive features when used. Download now and captivate your audience. Presenting this BPO Performance Improvement Action Plan Impact Of Poor Customer Support At Call Center Background PDF. Our researchers have carefully researched and created these slides with all aspects taken into consideration. This is a completely customizable BPO Performance Improvement Action Plan Impact Of Poor Customer Support At Call Center Background PDF that is available for immediate downloading. Download now and make an impact on your audience. Highlight the attractive features available with our PPTs.

AMR Robot Dashboard To Track Autonomous Mobile Robot Performance Ppt PowerPoint Presentation Diagram Images PDF
This slide represents the dashboard to track the AMRs performance in the warehouse. It covers various AMRs status reports, energy consumption, battery level, total working hours, and time to return. Presenting this PowerPoint presentation, titled AMR Robot Dashboard To Track Autonomous Mobile Robot Performance Ppt PowerPoint Presentation Diagram Images PDF, with topics curated by our researchers after extensive research. This editable presentation is available for immediate download and provides attractive features when used. Download now and captivate your audience. Presenting this AMR Robot Dashboard To Track Autonomous Mobile Robot Performance Ppt PowerPoint Presentation Diagram Images PDF. Our researchers have carefully researched and created these slides with all aspects taken into consideration. This is a completely customizable AMR Robot Dashboard To Track Autonomous Mobile Robot Performance Ppt PowerPoint Presentation Diagram Images PDF that is available for immediate downloading. Download now and make an impact on your audience. Highlight the attractive features available with our PPTs.
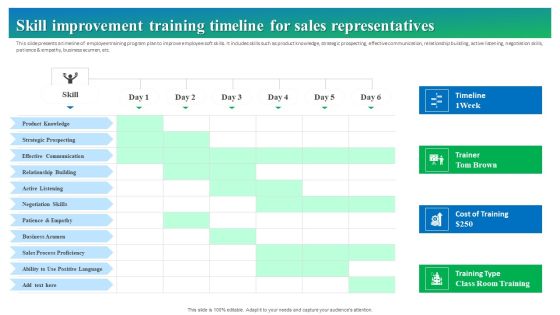
Process Enhancement Plan To Boost Sales Performance Skill Improvement Training Timeline For Sales Representatives Summary PDF
This slide showcases issues business is facing with existing sales prospecting tools. It includes problems such as low productivity due to unreliable software performance, data loss due to software failures, operating system bugs, limited access to advanced features, poor performance due to improper operations, etc. Do you have to make sure that everyone on your team knows about any specific topic I yes, then you should give Process Enhancement Plan To Boost Sales Performance Skill Improvement Training Timeline For Sales Representatives Summary PDF a try. Our experts have put a lot of knowledge and effort into creating this impeccable Process Enhancement Plan To Boost Sales Performance Skill Improvement Training Timeline For Sales Representatives Summary PDF. You can use this template for your upcoming presentations, as the slides are perfect to represent even the tiniest detail. You can download these templates from the Slidegeeks website and these are easy to edit. So grab these today.

Customer Success Kpi Dashboard To Measure Support Team Performance Client Success Best Practices Guide Icons PDF
Mentioned slide showcases customer success dashboard that company is currently using to measure its support team performance. KPIs covered in the dashboard are health score, retention cost, churn rate etc.Presenting this PowerPoint presentation, titled Customer Success Kpi Dashboard To Measure Support Team Performance Client Success Best Practices Guide Icons PDF, with topics curated by our researchers after extensive research. This editable presentation is available for immediate download and provides attractive features when used. Download now and captivate your audience. Presenting this Customer Success Kpi Dashboard To Measure Support Team Performance Client Success Best Practices Guide Icons PDF. Our researchers have carefully researched and created these slides with all aspects taken into consideration. This is a completely customizable Customer Success Kpi Dashboard To Measure Support Team Performance Client Success Best Practices Guide Icons PDF that is available for immediate downloading. Download now and make an impact on your audience. Highlight the attractive features available with our PPTs.

KPI Dashboard To Analyze Performance Of Healthcare Financial Department Summary PDF
The following slide showcases key performance indicator KPI dashboard which can be used to analyze the financial performance of hospital. The metrics covered in the slide are net profit margin, income and expenses, etc. Do you have an important presentation coming up Are you looking for something that will make your presentation stand out from the rest Look no further than KPI Dashboard To Analyze Performance Of Healthcare Financial Department Summary PDF. With our professional designs, you can trust that your presentation will pop and make delivering it a smooth process. And with Slidegeeks, you can trust that your presentation will be unique and memorable. So why wait Grab KPI Dashboard To Analyze Performance Of Healthcare Financial Department Summary PDF today and make your presentation stand out from the rest.
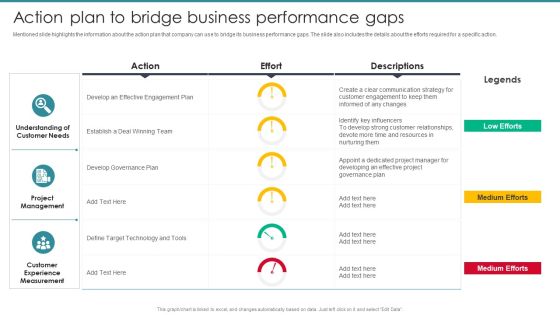
Guide To Mergers And Acquisitions Action Plan To Bridge Business Performance Gaps Mockup PDF
Mentioned slide highlights the information about the action plan that company can use to bridge its business performance gaps. The slide also includes the details about the efforts required for a specific action. Presenting this PowerPoint presentation, titled Guide To Mergers And Acquisitions Action Plan To Bridge Business Performance Gaps Mockup PDF, with topics curated by our researchers after extensive research. This editable presentation is available for immediate download and provides attractive features when used. Download now and captivate your audience. Presenting this Guide To Mergers And Acquisitions Action Plan To Bridge Business Performance Gaps Mockup PDF. Our researchers have carefully researched and created these slides with all aspects taken into consideration. This is a completely customizable Guide To Mergers And Acquisitions Action Plan To Bridge Business Performance Gaps Mockup PDF that is available for immediate downloading. Download now and make an impact on your audience. Highlight the attractive features available with our PPTs.

Assessment Of Supplier Current Performance Vendor Management Program For Supplier Information PDF
The purpose of the following slide is to showcase the findings of the supplier current performance assessment. The key evaluation parameters are quality, reliability, delivery, after sales services and cost. It also contains details of each KPIs weightage, minimum expected score and score obtained details.Presenting this PowerPoint presentation, titled Assessment Of Supplier Current Performance Vendor Management Program For Supplier Information PDF, with topics curated by our researchers after extensive research. This editable presentation is available for immediate download and provides attractive features when used. Download now and captivate your audience. Presenting this Assessment Of Supplier Current Performance Vendor Management Program For Supplier Information PDF. Our researchers have carefully researched and created these slides with all aspects taken into consideration. This is a completely customizable Assessment Of Supplier Current Performance Vendor Management Program For Supplier Information PDF that is available for immediate downloading. Download now and make an impact on your audience. Highlight the attractive features available with our PPTs.

Construction Project Cost Benefit Analysis Report Our Previous Project Performance Scoreboard Infographics PDF
This slide shows the performance scoreboard of previous project. It includes performance criteria, score and assessment method. Do you have to make sure that everyone on your team knows about any specific topic I yes, then you should give Construction Project Cost Benefit Analysis Report Our Previous Project Performance Scoreboard Infographics PDF a try. Our experts have put a lot of knowledge and effort into creating this impeccable Construction Project Cost Benefit Analysis Report Our Previous Project Performance Scoreboard Infographics PDF. You can use this template for your upcoming presentations, as the slides are perfect to represent even the tiniest detail. You can download these templates from the Slidegeeks website and these are easy to edit. So grab these today.
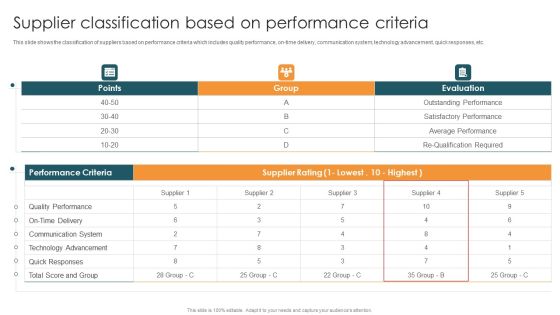
Vendor Relation Management Techniques Supplier Classification Based On Performance Criteria Graphics PDF
This slide shows the classification of suppliers based on performance criteria which includes quality performance, on time delivery, communication system, technology advancement, quick responses, etc. Formulating a presentation can take up a lot of effort and time, so the content and message should always be the primary focus. The visuals of the PowerPoint can enhance the presenters message, so our Vendor Relation Management Techniques Supplier Classification Based On Performance Criteria Graphics PDF was created to help save time. Instead of worrying about the design, the presenter can concentrate on the message while our designers work on creating the ideal templates for whatever situation is needed. Slidegeeks has experts for everything from amazing designs to valuable content, we have put everything into Vendor Relation Management Techniques Supplier Classification Based On Performance Criteria Graphics PDF.

Collaborative Robots IT Dashboard To Track Cobot Performance Ppt Slides Guidelines PDF
This slide represents the cobots performance dashboard by covering details of battery level, performance, total hours, average time, time to return, energy consumption, and so on. If you are looking for a format to display your unique thoughts, then the professionally designed Collaborative Robots IT Dashboard To Track Cobot Performance Ppt Slides Guidelines PDF is the one for you. You can use it as a Google Slides template or a PowerPoint template. Incorporate impressive visuals, symbols, images, and other charts. Modify or reorganize the text boxes as you desire. Experiment with shade schemes and font pairings. Alter, share or cooperate with other people on your work. Download Collaborative Robots IT Dashboard To Track Cobot Performance Ppt Slides Guidelines PDF and find out how to give a successful presentation. Present a perfect display to your team and make your presentation unforgettable.
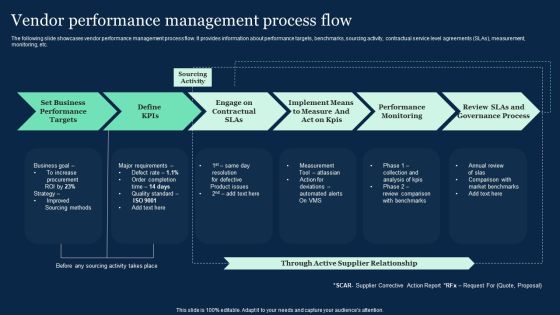
Vendor Performance Management Process Flow Effective Vendor Management For Enhancing Introduction PDF
The following slide showcases vendor performance management process flow. It provides information about performance targets, benchmarks, sourcing activity, contractual service level agreements SLAs, measurement, monitoring, etc. Whether you have daily or monthly meetings, a brilliant presentation is necessary. Vendor Performance Management Process Flow Effective Vendor Management For Enhancing Introduction PDF can be your best option for delivering a presentation. Represent everything in detail using Vendor Performance Management Process Flow Effective Vendor Management For Enhancing Introduction PDF and make yourself stand out in meetings. The template is versatile and follows a structure that will cater to your requirements. All the templates prepared by Slidegeeks are easy to download and edit. Our research experts have taken care of the corporate themes as well. So, give it a try and see the results.

Analyzing And Deploying Effective CMS Key Metrics To Measure Current Performance Of Ecommerce Website Infographics PDF
This slide represents the key performance indicators to track and monitor the performance of ecommerce website to draw effective strategies to tackle the problems. It includes key metrics for ecommerce website performance measurement such as average order value and shopping cart abandonment rate. Do you know about Slidesgeeks Analyzing And Deploying Effective CMS Key Metrics To Measure Current Performance Of Ecommerce Website Infographics PDF These are perfect for delivering any kind od presentation. Using it, create PowerPoint presentations that communicate your ideas and engage audiences. Save time and effort by using our pre designed presentation templates that are perfect for a wide range of topic. Our vast selection of designs covers a range of styles, from creative to business, and are all highly customizable and easy to edit. Download as a PowerPoint template or use them as Google Slides themes.

Social Media Channel Performance Analysis Strategies For Acquiring Consumers Slides PDF
This slide covers social media platform tracking tools for creating performance reports to share with your team, stakeholders, and boss. It includes metrics percentage of promotional posts, followers, followers lost or gained, published posts or mentions, referral traffic, conversions, and GCR. Presenting this PowerPoint presentation, titled Social Media Channel Performance Analysis Strategies For Acquiring Consumers Slides PDF, with topics curated by our researchers after extensive research. This editable presentation is available for immediate download and provides attractive features when used. Download now and captivate your audience. Presenting this Social Media Channel Performance Analysis Strategies For Acquiring Consumers Slides PDF. Our researchers have carefully researched and created these slides with all aspects taken into consideration. This is a completely customizable Social Media Channel Performance Analysis Strategies For Acquiring Consumers Slides PDF that is available for immediate downloading. Download now and make an impact on your audience. Highlight the attractive features available with our PPTs.
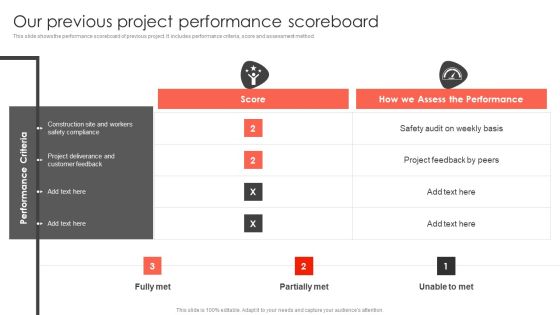
Our Previous Project Performance Scoreboard Construct Project Feasibility Analysis Report Sample PDF
This slide shows the performance scoreboard of previous project. It includes performance criteria, score and assessment method. Do you have an important presentation coming up Are you looking for something that will make your presentation stand out from the rest Look no further than Our Previous Project Performance Scoreboard Construct Project Feasibility Analysis Report Sample PDF. With our professional designs, you can trust that your presentation will pop and make delivering it a smooth process. And with Slidegeeks, you can trust that your presentation will be unique and memorable. So why wait Grab Our Previous Project Performance Scoreboard Construct Project Feasibility Analysis Report Sample PDF today and make your presentation stand out from the rest.

Brand Management To Enhance Rebranding Performance Tracking Dashboard To Track Renewed Brand Mockup PDF
This slide provides information regarding rebranding performance tracking dashboard in order to track renewed brand. It includes details about total spent, total link clicks, total conversations, etc. Presenting this PowerPoint presentation, titled Brand Management To Enhance Rebranding Performance Tracking Dashboard To Track Renewed Brand Mockup PDF, with topics curated by our researchers after extensive research. This editable presentation is available for immediate download and provides attractive features when used. Download now and captivate your audience. Presenting this Brand Management To Enhance Rebranding Performance Tracking Dashboard To Track Renewed Brand Mockup PDF. Our researchers have carefully researched and created these slides with all aspects taken into consideration. This is a completely customizable Brand Management To Enhance Rebranding Performance Tracking Dashboard To Track Renewed Brand Mockup PDF that is available for immediate downloading. Download now and make an impact on your audience. Highlight the attractive features available with our PPTs.

Prevention Of Information KPI Dashboard To Monitor Cyber Security Performance Information PDF
The purpose of this slide is to highlight key performance indicator KPI dashboard which can be used to track the performance of organization cyber security. The KPI metrics covered in the slide are asset type control, control issues by standard AND regulation etc. This Prevention Of Information KPI Dashboard To Monitor Cyber Security Performance Information PDF is perfect for any presentation, be it in front of clients or colleagues. It is a versatile and stylish solution for organizing your meetings. The Prevention Of Information KPI Dashboard To Monitor Cyber Security Performance Information PDF features a modern design for your presentation meetings. The adjustable and customizable slides provide unlimited possibilities for acing up your presentation. Slidegeeks has done all the homework before launching the product for you. So, dont wait, grab the presentation templates today

Addressing Present Performance Delivery Gap Managing Sales Pipeline Health Introduction PDF
This slide provides information regarding the present delivery gap that firm is facing in terms of its performance as compared to the industry standards. The firms performance is assessed on metrics such as response rate, forecast accuracy, lead qualification rate, etc. Are you searching for a Addressing Present Performance Delivery Gap Managing Sales Pipeline Health Introduction PDF that is uncluttered, straightforward, and original It is easy to edit, and you can change the colors to suit your personal or business branding. For a presentation that expresses how much effort you have put in, this template is ideal With all of its features, including tables, diagrams, statistics, and lists, it is perfect for a business plan presentation. Make your ideas more appealing with these professional slides. Download Addressing Present Performance Delivery Gap Managing Sales Pipeline Health Introduction PDF from Slidegeeks today.

Customer Support Center Evaluate Performance By Monitoring Call Center Kpis Professional PDF
This slide highlights call center key performance indicators which can be used to evaluate organization and employee performance which includes service level, response time, abandonment rate, quality monitoring scores, customer satisfaction and first call resolution. Find highly impressive Customer Support Center Evaluate Performance By Monitoring Call Center Kpis Professional PDF on Slidegeeks to deliver a meaningful presentation. You can save an ample amount of time using these presentation templates. No need to worry to prepare everything from scratch because Slidegeeks experts have already done a huge research and work for you. You need to download Customer Support Center Evaluate Performance By Monitoring Call Center Kpis Professional PDF for your upcoming presentation. All the presentation templates are 100 percent editable and you can change the color and personalize the content accordingly. Download now
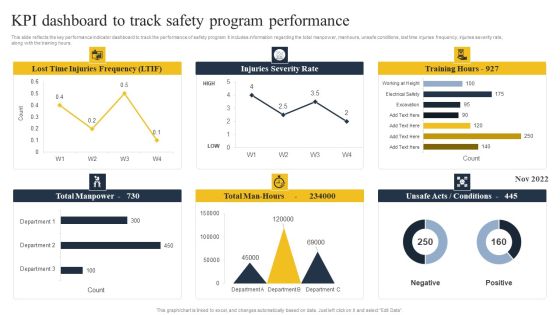
Security Control Techniques For Real Estate Project KPI Dashboard To Track Safety Program Performance Brochure PDF
This slide reflects the key performance indicator dashboard to track the performance of safety program. It includes information regarding the total manpower, manhours, unsafe conditions, lost time injuries frequency, injuries severity rate, along with the training hours. Create an editable Security Control Techniques For Real Estate Project KPI Dashboard To Track Safety Program Performance Brochure PDF that communicates your idea and engages your audience. Whether youre presenting a business or an educational presentation, pre-designed presentation templates help save time. Security Control Techniques For Real Estate Project KPI Dashboard To Track Safety Program Performance Brochure PDF is highly customizable and very easy to edit, covering many different styles from creative to business presentations. Slidegeeks has creative team members who have crafted amazing templates. So, go and get them without any delay.

Successful Brand Management Product And Content Performance Assessment For Brand Ideas PDF
This slide provides information regarding product and content performance assessment for brand growth analysis. The products performance is assessed on parameters such as price, packaging , quality and content performance is determined through site traffic, on-site time, etc. Want to ace your presentation in front of a live audience Our Successful Brand Management Product And Content Performance Assessment For Brand Ideas PDF can help you do that by engaging all the users towards you. Slidegeeks experts have put their efforts and expertise into creating these impeccable powerpoint presentations so that you can communicate your ideas clearly. Moreover, all the templates are customizable, and easy-to-edit and downloadable. Use these for both personal and commercial use.
B2b Sales Performance Tracking Dashboard Comprehensive Guide For Developing Topics PDF
This slide represents metric dashboard to track sales performance on e-commerce website. It cover performance indicators such as sales breakdown, order breakdown, recurring sales etc.Do you have to make sure that everyone on your team knows about any specific topic I yes, then you should give B2b Sales Performance Tracking Dashboard Comprehensive Guide For Developing Topics PDF a try. Our experts have put a lot of knowledge and effort into creating this impeccable B2b Sales Performance Tracking Dashboard Comprehensive Guide For Developing Topics PDF. You can use this template for your upcoming presentations, as the slides are perfect to represent even the tiniest detail. You can download these templates from the Slidegeeks website and these are easy to edit. So grab these today.

Kpi Dashboard To Evaluate The New Retail Store Performance Opening Retail Store In Untapped Download PDF
The following slide showcases key performance indicator dashboard which can be used to measure the performance of new store. It covers information about net sales, sales per square foot, average basket size ABS, total visitors count etc.Create an editable Kpi Dashboard To Evaluate The New Retail Store Performance Opening Retail Store In Untapped Download PDF that communicates your idea and engages your audience. Whether you are presenting a business or an educational presentation, pre-designed presentation templates help save time. Kpi Dashboard To Evaluate The New Retail Store Performance Opening Retail Store In Untapped Download PDF is highly customizable and very easy to edit, covering many different styles from creative to business presentations. Slidegeeks has creative team members who have crafted amazing templates. So, go and get them without any delay.
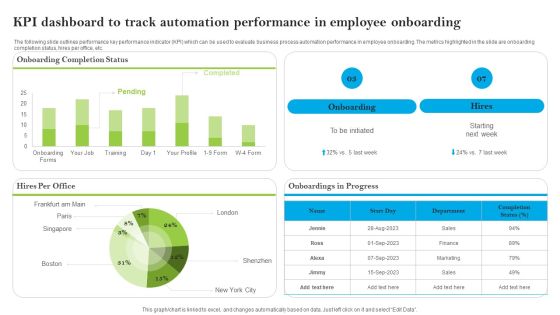
Introducing AI Tools KPI Dashboard To Track Automation Performance In Employee Formats PDF
The following slide outlines performance key performance indicator KPI which can be used to evaluate business process automation performance in employee onboarding. The metrics highlighted in the slide are onboarding completion status, hires per office, etc. This modern and well-arranged Introducing AI Tools KPI Dashboard To Track Automation Performance In Employee Formats PDF provides lots of creative possibilities. It is very simple to customize and edit with the Powerpoint Software. Just drag and drop your pictures into the shapes. All facets of this template can be edited with Powerpoint, no extra software is necessary. Add your own material, put your images in the places assigned for them, adjust the colors, and then you can show your slides to the world, with an animated slide included.
Product And Customer Performance Tracking Dashboard Techniques For Crafting Killer Background PDF
This slide provides information regarding dashboard utilized by firm to monitor performance of products offered and customer associated. The performance is tracked through revenues generated, new customer acquired, customer satisfaction, sales comparison, etc. This Product And Customer Performance Tracking Dashboard Techniques For Crafting Killer Background PDF is perfect for any presentation, be it in front of clients or colleagues. It is a versatile and stylish solution for organizing your meetings. The Product And Customer Performance Tracking Dashboard Techniques For Crafting Killer Background PDF features a modern design for your presentation meetings. The adjustable and customizable slides provide unlimited possibilities for acing up your presentation. Slidegeeks has done all the homework before launching the product for you. So, do not wait, grab the presentation templates today

Multi Cloud Infrastructure Management Strategy To Scale Up Application Performance When Brochure PDF
This slide covers the strategies to scale up the application performance when business will grow significantly and all applications would need a highly scalable platform. Presenting this PowerPoint presentation, titled Multi Cloud Infrastructure Management Strategy To Scale Up Application Performance When Brochure PDF, with topics curated by our researchers after extensive research. This editable presentation is available for immediate download and provides attractive features when used. Download now and captivate your audience. Presenting this Multi Cloud Infrastructure Management Strategy To Scale Up Application Performance When Brochure PDF. Our researchers have carefully researched and created these slides with all aspects taken into consideration. This is a completely customizable Multi Cloud Infrastructure Management Strategy To Scale Up Application Performance When Brochure PDF that is available for immediate downloading. Download now and make an impact on your audience. Highlight the attractive features available with our PPTs.

Optimizing Online Stores Key Metrics To Measure Current Performance Download PDF
This slide represents the key performance indicators to track and monitor the performance of ecommerce website to draw effective strategies to tackle the problems. It includes key metrics for ecommerce website performance measurement such as average order value and shopping cart abandonment rate. The Optimizing Online Stores Key Metrics To Measure Current Performance Download PDF is a compilation of the most recent design trends as a series of slides. It is suitable for any subject or industry presentation, containing attractive visuals and photo spots for businesses to clearly express their messages. This template contains a variety of slides for the user to input data, such as structures to contrast two elements, bullet points, and slides for written information. Slidegeeks is prepared to create an impression.

Gaining Competitive Edge Income Statement Highlighting Companys Financial Performance Introduction PDF
The following slide showcases profit and loss statement financial performance of company. It provides information about sales, sales return, allowance, gross profit, selling expenses, operating expenses, income tax, etc. Presenting this PowerPoint presentation, titled Gaining Competitive Edge Income Statement Highlighting Companys Financial Performance Introduction PDF, with topics curated by our researchers after extensive research. This editable presentation is available for immediate download and provides attractive features when used. Download now and captivate your audience. Presenting this Gaining Competitive Edge Income Statement Highlighting Companys Financial Performance Introduction PDF. Our researchers have carefully researched and created these slides with all aspects taken into consideration. This is a completely customizable Gaining Competitive Edge Income Statement Highlighting Companys Financial Performance Introduction PDF that is available for immediate downloading. Download now and make an impact on your audience. Highlight the attractive features available with our PPTs.
Strategic Corporate Planning To Attain Corporate Financial Performance Tracking Dashboard Icons PDF
This slide provides information regarding dashboard utilized by firm to monitor financial performance. The performance is tracked through revenues generated, vendors associated, profit generated, etc. This Strategic Corporate Planning To Attain Corporate Financial Performance Tracking Dashboard Icons PDF is perfect for any presentation, be it in front of clients or colleagues. It is a versatile and stylish solution for organizing your meetings. The Strategic Corporate Planning To Attain Corporate Financial Performance Tracking Dashboard Icons PDF features a modern design for your presentation meetings. The adjustable and customizable slides provide unlimited possibilities for acing up your presentation. Slidegeeks has done all the homework before launching the product for you. So, do not wait, grab the presentation templates today

Comprehensive Promotion Guidelines To Administer Brand Overall Brand Performance Tracking Dashboard Mockup PDF
This slide provides information regarding brand performance tracking dashboard capturing KPIs such as brand metric, brand commitment, advertising metrics, and purchase metrics. Presenting this PowerPoint presentation, titled Comprehensive Promotion Guidelines To Administer Brand Overall Brand Performance Tracking Dashboard Mockup PDF, with topics curated by our researchers after extensive research. This editable presentation is available for immediate download and provides attractive features when used. Download now and captivate your audience. Presenting this Comprehensive Promotion Guidelines To Administer Brand Overall Brand Performance Tracking Dashboard Mockup PDF. Our researchers have carefully researched and created these slides with all aspects taken into consideration. This is a completely customizable Comprehensive Promotion Guidelines To Administer Brand Overall Brand Performance Tracking Dashboard Mockup PDF that is available for immediate downloading. Download now and make an impact on your audience. Highlight the attractive features available with our PPTs.

Digital Marketing Approach For Brand Awareness Metric Dashboard Showcasing Brand Performance Post Marketing Mockup PDF
Presenting this PowerPoint presentation, titled Digital Marketing Approach For Brand Awareness Metric Dashboard Showcasing Brand Performance Post Marketing Mockup This slide represents brand promotion dashboard highlighting performance post digital marketing. It includes sales quantity, return quantity, cost of goods, return amount etc. PDF, with topics curated by our researchers after extensive research. This editable presentation is available for immediate download and provides attractive features when used. Download now and captivate your audience. Presenting this Digital Marketing Approach For Brand Awareness Metric Dashboard Showcasing Brand Performance Post Marketing Mockup PDF. Our researchers have carefully researched and created these slides with all aspects taken into consideration. This is a completely customizable Digital Marketing Approach For Brand Awareness Metric Dashboard Showcasing Brand Performance Post Marketing Mockup PDF that is available for immediate downloading. Download now and make an impact on your audience. Highlight the attractive features available with our PPTs.

KPI Dashboard To Analyze In Store Merchandising Strategy Performance Introduction PDF
The following slide outlines a performance key performance indicator KPI dashboard used to evaluate the effectiveness of in-store merchandising strategy. The KPIs covered in the slide are total sales, average inventory, active stores, distinct products sold, etc. Formulating a presentation can take up a lot of effort and time, so the content and message should always be the primary focus. The visuals of the PowerPoint can enhance the presenters message, so our KPI Dashboard To Analyze In Store Merchandising Strategy Performance Introduction PDF was created to help save time. Instead of worrying about the design, the presenter can concentrate on the message while our designers work on creating the ideal templates for whatever situation is needed. Slidegeeks has experts for everything from amazing designs to valuable content, we have put everything into KPI Dashboard To Analyze In Store Merchandising Strategy Performance Introduction PDF.
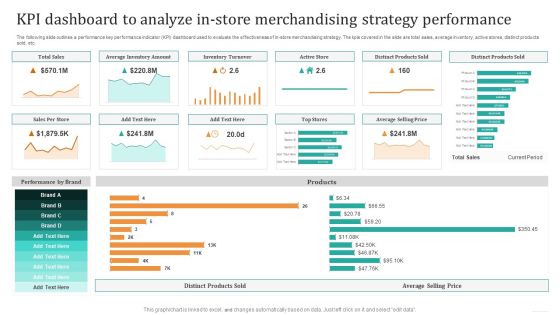
KPI Dashboard To Analyze In Store Merchandising Strategy Performance Pictures PDF
The following slide outlines a performance key performance indicator KPI dashboard used to evaluate the effectiveness of in-store merchandising strategy. The KPIs covered in the slide are total sales, average inventory, active stores, distinct products sold, etc. Formulating a presentation can take up a lot of effort and time, so the content and message should always be the primary focus. The visuals of the PowerPoint can enhance the presenters message, so our KPI Dashboard To Analyze In Store Merchandising Strategy Performance Pictures PDF was created to help save time. Instead of worrying about the design, the presenter can concentrate on the message while our designers work on creating the ideal templates for whatever situation is needed. Slidegeeks has experts for everything from amazing designs to valuable content, we have put everything into KPI Dashboard To Analyze In Store Merchandising Strategy Performance Pictures PDF.
Recommender Systems Performance Tracking Dashboard Integrating Recommender System To Enhance Guidelines PDF
This slide shows the dashboard to keep a track of the performance of recommender systems. The purpose of this slide is to provide a graphical representation of recommendation engines performance to enhance the accuracy and effectiveness of the system.Find highly impressive Recommender Systems Performance Tracking Dashboard Integrating Recommender System To Enhance Guidelines PDF on Slidegeeks to deliver a meaningful presentation. You can save an ample amount of time using these presentation templates. No need to worry to prepare everything from scratch because Slidegeeks experts have already done a huge research and work for you. You need to download Recommender Systems Performance Tracking Dashboard Integrating Recommender System To Enhance Guidelines PDF for your upcoming presentation. All the presentation templates are 100 precent editable and you can change the color and personalize the content accordingly. Download now.

Defining The Most Commonly Used Performance Monitoring Metrics For Supply Chain Microsoft PDF
Purpose of this slide is to illustrate key performance metrics used by supply chain enterprises to track overall business performance. KPIs covered are of operational, financial, strategic and relationship.Crafting an eye-catching presentation has never been more straightforward. Let your presentation shine with this tasteful yet straightforward Defining The Most Commonly Used Performance Monitoring Metrics For Supply Chain Microsoft PDF template. It offers a minimalistic and classy look that is great for making a statement. The colors have been employed intelligently to add a bit of playfulness while still remaining professional. Construct the ideal Defining The Most Commonly Used Performance Monitoring Metrics For Supply Chain Microsoft PDF that effortlessly grabs the attention of your audience Begin now and be certain to wow your customers
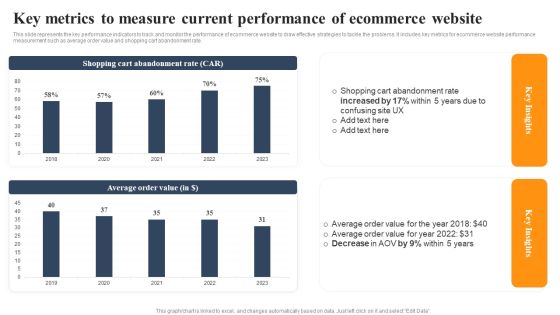
Implementing An Effective Ecommerce Management Framework Key Metrics Current Performance Of Ecommerce Website Slides PDF
This slide represents the key performance indicators to track and monitor the performance of ecommerce website to draw effective strategies to tackle the problems. It includes key metrics for ecommerce website performance measurement such as average order value and shopping cart abandonment rate. The Implementing An Effective Ecommerce Management Framework Key Metrics Current Performance Of Ecommerce Website Slides PDF is a compilation of the most recent design trends as a series of slides. It is suitable for any subject or industry presentation, containing attractive visuals and photo spots for businesses to clearly express their messages. This template contains a variety of slides for the user to input data, such as structures to contrast two elements, bullet points, and slides for written information. Slidegeeks is prepared to create an impression.

Critical Initiatives To Deploy Product And Customer Performance Tracking Dashboard Guidelines PDF
This slide provides information regarding dashboard utilized by firm to monitor performance of products offered and customer associated. The performance is tracked through revenues generated, new customer acquired, customer satisfaction, sales comparison, etc. Do you have an important presentation coming up Are you looking for something that will make your presentation stand out from the rest Look no further than Critical Initiatives To Deploy Product And Customer Performance Tracking Dashboard Guidelines PDF. With our professional designs, you can trust that your presentation will pop and make delivering it a smooth process. And with Slidegeeks, you can trust that your presentation will be unique and memorable. So why wait Grab Critical Initiatives To Deploy Product And Customer Performance Tracking Dashboard Guidelines PDF today and make your presentation stand out from the rest.

Talent Management Optimization With Workforce Staffing Performance Management And Reward Framework Elements PDF
This slide represents performance management framework. It covers performance planning, monitoring, assessment, appraisal, rewards and compensations that helps in enhancing employee motivation and productivity. Crafting an eye catching presentation has never been more straightforward. Let your presentation shine with this tasteful yet straightforward Talent Management Optimization With Workforce Staffing Performance Management And Reward Framework Elements PDF template. It offers a minimalistic and classy look that is great for making a statement. The colors have been employed intelligently to add a bit of playfulness while still remaining professional. Construct the ideal Talent Management Optimization With Workforce Staffing Performance Management And Reward Framework Elements PDF that effortlessly grabs the attention of your audience Begin now and be certain to wow your customers.

Product And Content Performance Assessment For Brand Growth Analysis Demonstration PDF
This slide provides information regarding product and content performance assessment for brand growth analysis. The products performance is assessed on parameters such as price, packaging , quality and content performance is determined through site traffic, on site time, etc. The Product And Content Performance Assessment For Brand Growth Analysis Demonstration PDF is a compilation of the most recent design trends as a series of slides. It is suitable for any subject or industry presentation, containing attractive visuals and photo spots for businesses to clearly express their messages. This template contains a variety of slides for the user to input data, such as structures to contrast two elements, bullet points, and slides for written information. Slidegeeks is prepared to create an impression.
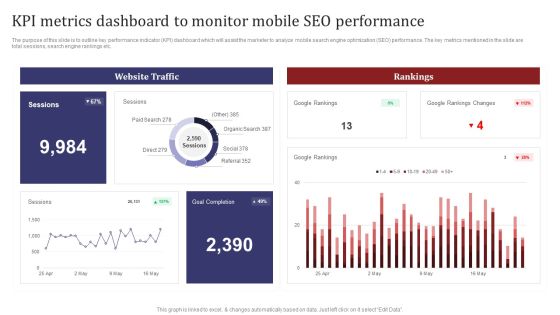
Mobile Search Engine Optimization Plan KPI Metrics Dashboard To Monitor Mobile SEO Performance Inspiration PDF
The purpose of this slide is to outline key performance indicator KPI dashboard which will assist the marketer to analyze mobile search engine optimization SEO performance. The key metrics mentioned in the slide are total sessions, search engine rankings etc. This Mobile Search Engine Optimization Plan KPI Metrics Dashboard To Monitor Mobile SEO Performance Inspiration PDF from Slidegeeks makes it easy to present information on your topic with precision. It provides customization options, so you can make changes to the colors, design, graphics, or any other component to create a unique layout. It is also available for immediate download, so you can begin using it right away. Slidegeeks has done good research to ensure that you have everything you need to make your presentation stand out. Make a name out there for a brilliant performance.

Yearly Project Performance Highlights And Its Degree Credibility Assessment Summary For Construction Project Download PDF
This slide explains about project degree of success based on performance parameters. Performance parameters included here are cost control, schedule meeting, technical performance and customer satisfaction. Retrieve professionally designed Yearly Project Performance Highlights And Its Degree Credibility Assessment Summary For Construction Project Download PDF to effectively convey your message and captivate your listeners. Save time by selecting pre-made slideshows that are appropriate for various topics, from business to educational purposes. These themes come in many different styles, from creative to corporate, and all of them are easily adjustable and can be edited quickly. Access them as PowerPoint templates or as Google Slides themes. You don not have to go on a hunt for the perfect presentation because Slidegeeks got you covered from everywhere.

Agile Software Programming Module For IT Agile Performance Evaluation Metrics Diagrams PDF
This slide covers the metrics used by the organisation to measure agile capability on the basis of product performance, security level and user satisfaction. Presenting this PowerPoint presentation, titled Agile Software Programming Module For IT Agile Performance Evaluation Metrics Diagrams PDF, with topics curated by our researchers after extensive research. This editable presentation is available for immediate download and provides attractive features when used. Download now and captivate your audience. Presenting this Agile Software Programming Module For IT Agile Performance Evaluation Metrics Diagrams PDF. Our researchers have carefully researched and created these slides with all aspects taken into consideration. This is a completely customizable Agile Software Programming Module For IT Agile Performance Evaluation Metrics Diagrams PDF that is available for immediate downloading. Download now and make an impact on your audience. Highlight the attractive features available with our PPTs.
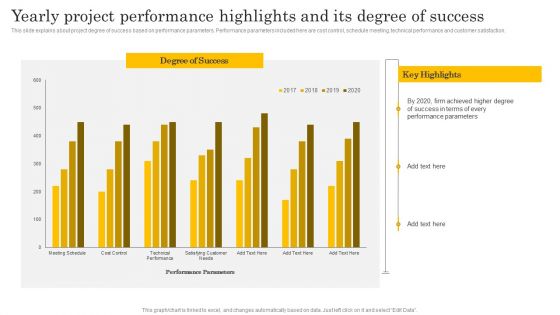
Financial Evaluation Report Yearly Project Performance Highlights And Its Degree Template PDF
This slide explains about project degree of success based on performance parameters. Performance parameters included here are cost control, schedule meeting, technical performance and customer satisfaction. Retrieve professionally designed Financial Evaluation Report Yearly Project Performance Highlights And Its Degree Template PDF to effectively convey your message and captivate your listeners. Save time by selecting pre-made slideshows that are appropriate for various topics, from business to educational purposes. These themes come in many different styles, from creative to corporate, and all of them are easily adjustable and can be edited quickly. Access them as PowerPoint templates or as Google Slides themes. You dont have to go on a hunt for the perfect presentation because Slidegeeks got you covered from everywhere.
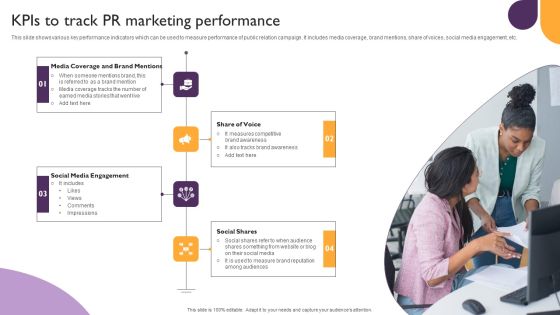
Public Relations Guide To Enhance Brand Credibility Kpis To Track PR Marketing Performance Infographics PDF
This slide shows various key performance indicators which can be used to measure performance of public relation campaign. It includes media coverage, brand mentions, share of voices, social media engagement, etc. Formulating a presentation can take up a lot of effort and time, so the content and message should always be the primary focus. The visuals of the PowerPoint can enhance the presenters message, so our Public Relations Guide To Enhance Brand Credibility Kpis To Track PR Marketing Performance Infographics PDF was created to help save time. Instead of worrying about the design, the presenter can concentrate on the message while our designers work on creating the ideal templates for whatever situation is needed. Slidegeeks has experts for everything from amazing designs to valuable content, we have put everything into Public Relations Guide To Enhance Brand Credibility Kpis To Track PR Marketing Performance Infographics PDF

Metrics To Evaluate Real Time Marketing Campaign Performance Ppt Inspiration Portfolio PDF
The following slide showcases some key performance indicators KPIs to assess real time marketing campaign results for performance review. It includes elements such as engagement, awareness, led generation, reach, impressions, click through rate, open rate etc. Get a simple yet stunning designed Metrics To Evaluate Real Time Marketing Campaign Performance Ppt Inspiration Portfolio PDF. It is the best one to establish the tone in your meetings. It is an excellent way to make your presentations highly effective. So, download this PPT today from Slidegeeks and see the positive impacts. Our easy-to-edit Metrics To Evaluate Real Time Marketing Campaign Performance Ppt Inspiration Portfolio PDF can be your go-to option for all upcoming conferences and meetings. So, what are you waiting for Grab this template today.

Traditional Approach Being Used For Staff Performance Evaluation Process Introduction PDF
This slide shows the methods currently used by the organization for employee performance evaluation. It also depicts the modern methods which the organization will implement in further employee performance review process. Here you can discover an assortment of the finest PowerPoint and Google Slides templates. With these templates, you can create presentations for a variety of purposes while simultaneously providing your audience with an eye catching visual experience. Download Traditional Approach Being Used For Staff Performance Evaluation Process Introduction PDF to deliver an impeccable presentation. These templates will make your job of preparing presentations much quicker, yet still, maintain a high level of quality. Slidegeeks has experienced researchers who prepare these templates and write high quality content for you. Later on, you can personalize the content by editing the Traditional Approach Being Used For Staff Performance Evaluation Process Introduction PDF.

Determining Sales Enhancement Areas Identifying Steps Of Sales Performance Improvement Inspiration PDF
This slide highlights various steps for sales performance improvement process to ensure sales team is targeting right opportunities and prioritizing best deals to achieve business goals. Its key steps are identifying goals AND needs, developing strategic plan, implementing plan and evaluating performance. This Determining Sales Enhancement Areas Identifying Steps Of Sales Performance Improvement Inspiration PDF is perfect for any presentation, be it in front of clients or colleagues. It is a versatile and stylish solution for organizing your meetings. The Determining Sales Enhancement Areas Identifying Steps Of Sales Performance Improvement Inspiration PDF features a modern design for your presentation meetings. The adjustable and customizable slides provide unlimited possibilities for acing up your presentation. Slidegeeks has done all the homework before launching the product for you. So, do not wait, grab the presentation templates today

Analyzing Multiple Performance Marketing Strategies Ppt PowerPoint Presentation File Professional PDF
This slide provides glimpse about the different performance marketing strategies that helps the business to track the performance of holistic marketing adoption. It includes strategies such as focus on good landing page, A B testing, choose traffic sources carefully, etc. Do you have an important presentation coming up Are you looking for something that will make your presentation stand out from the rest Look no further than Analyzing Multiple Performance Marketing Strategies Ppt PowerPoint Presentation File Professional PDF. With our professional designs, you can trust that your presentation will pop and make delivering it a smooth process. And with Slidegeeks, you can trust that your presentation will be unique and memorable. So why wait Grab Analyzing Multiple Performance Marketing Strategies Ppt PowerPoint Presentation File Professional PDF today and make your presentation stand out from the rest.
Virtual WAN Architecture SD WAN Network Performance Tracking Dashboard Designs PDF
This slide represents the SD-WAN network performance tracking dashboard. The purpose of this slide is to demonstrate the performance of the SD-WAN network. The main components include control status, site health, transport interface distribution, WAN edge inventory, edge health, and so on. Crafting an eye-catching presentation has never been more straightforward. Let your presentation shine with this tasteful yet straightforward Virtual WAN Architecture SD WAN Network Performance Tracking Dashboard Designs PDF template. It offers a minimalistic and classy look that is great for making a statement. The colors have been employed intelligently to add a bit of playfulness while still remaining professional. Construct the ideal Virtual WAN Architecture SD WAN Network Performance Tracking Dashboard Designs PDF that effortlessly grabs the attention of your audience Begin now and be certain to wow your customers.
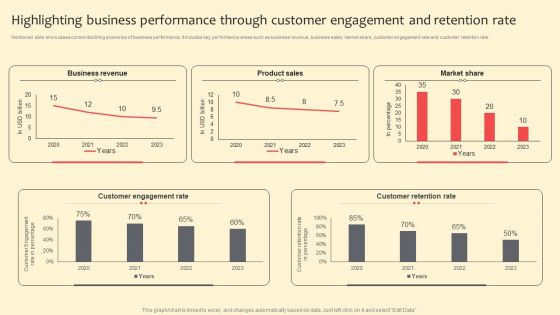
Highlighting Business Performance Through Customer Engagement And Retention Rate Summary PDF
Mentioned slide showcases current declining scenarios of business performance. It includes key performance areas such as business revenue, business sales, market share, customer engagement rate and customer retention rate. Create an editable Highlighting Business Performance Through Customer Engagement And Retention Rate Summary PDF that communicates your idea and engages your audience. Whether you are presenting a business or an educational presentation, pre designed presentation templates help save time. Highlighting Business Performance Through Customer Engagement And Retention Rate Summary PDF is highly customizable and very easy to edit, covering many different styles from creative to business presentations. Slidegeeks has creative team members who have crafted amazing templates. So, go and get them without any delay.
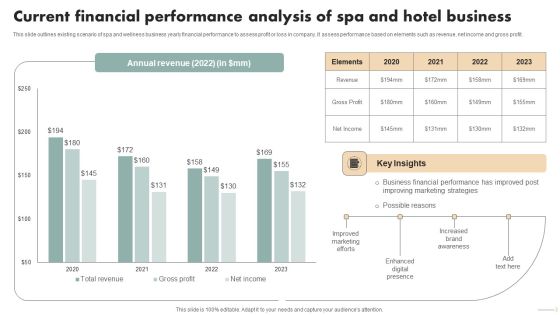
Spa Marketing Strategy Boost Reservations Enhance Revenue Current Financial Performance Analysis Mockup PDF
This slide outlines existing scenario of spa and wellness business yearly financial performance to assess profit or loss in company. It assess performance based on elements such as revenue, net income and gross profit. Do you have to make sure that everyone on your team knows about any specific topic I yes, then you should give Spa Marketing Strategy Boost Reservations Enhance Revenue Current Financial Performance Analysis Mockup PDF a try. Our experts have put a lot of knowledge and effort into creating this impeccable Spa Marketing Strategy Boost Reservations Enhance Revenue Current Financial Performance Analysis Mockup PDF. You can use this template for your upcoming presentations, as the slides are perfect to represent even the tiniest detail. You can download these templates from the Slidegeeks website and these are easy to edit. So grab these today.

Online PR Techniques To Boost Brands Online Visibility Kpis To Track PR Marketing Performance Guidelines PDF
This slide shows various key performance indicators which can be used to measure performance of public relation campaign. It includes media coverage, brand mentions, share of voices, social media engagement, etc. Are you searching for a Online PR Techniques To Boost Brands Online Visibility Kpis To Track PR Marketing Performance Guidelines PDF that is uncluttered, straightforward, and original Its easy to edit, and you can change the colors to suit your personal or business branding. For a presentation that expresses how much effort you have put in, this template is ideal. With all of its features, including tables, diagrams, statistics, and lists, its perfect for a business plan presentation. Make your ideas more appealing with these professional slides. Download Online PR Techniques To Boost Brands Online Visibility Kpis To Track PR Marketing Performance Guidelines PDF from Slidegeeks today.

Implementing Management System To Enhance Ecommerce Processes Key Metrics To Measure Current Performance Themes PDF
This slide represents the key performance indicators to track and monitor the performance of ecommerce website to draw effective strategies to tackle the problems. It includes key metrics for ecommerce website performance measurement such as average order value and shopping cart abandonment rate. Do you know about Slidesgeeks Implementing Management System To Enhance Ecommerce Processes Key Metrics To Measure Current Performance Themes PDF. These are perfect for delivering any kind od presentation. Using it, create PowerPoint presentations that communicate your ideas and engage audiences. Save time and effort by using our pre designed presentation templates that are perfect for a wide range of topic. Our vast selection of designs covers a range of styles, from creative to business, and are all highly customizable and easy to edit. Download as a PowerPoint template or use them as Google Slides themes.

Definitive Guide To Conduct Digital Marketing Inspection Content Performance Tracking Dashboard For Social Media Template PDF
This slide indicates the content performance tracking dashboard for social media channels providing information regarding the total number of posts, engagement rate, audience sentiments and multiple hashtags performance. This Definitive Guide To Conduct Digital Marketing Inspection Content Performance Tracking Dashboard For Social Media Template PDF from Slidegeeks makes it easy to present information on your topic with precision. It provides customization options, so you can make changes to the colors, design, graphics, or any other component to create a unique layout. It is also available for immediate download, so you can begin using it right away. Slidegeeks has done good research to ensure that you have everything you need to make your presentation stand out. Make a name out there for a brilliant performance.
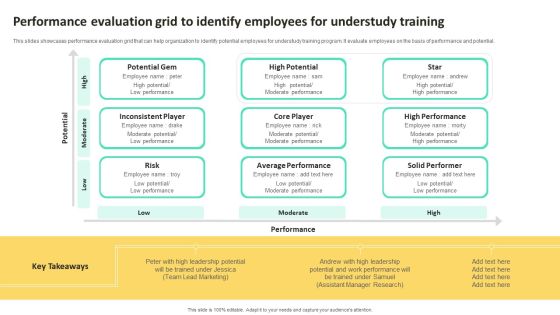
On Job Staff Training Program For Skills Advancement Performance Evaluation Grid To Identify Portrait PDF
This slides showcases performance evaluation grid that can help organization to identify potential employees for understudy training program. It evaluate employees on the basis of performance and potential. This On Job Staff Training Program For Skills Advancement Performance Evaluation Grid To Identify Portrait PDF is perfect for any presentation, be it in front of clients or colleagues. It is a versatile and stylish solution for organizing your meetings. The On Job Staff Training Program For Skills Advancement Performance Evaluation Grid To Identify Portrait PDF features a modern design for your presentation meetings. The adjustable and customizable slides provide unlimited possibilities for acing up your presentation. Slidegeeks has done all the homework before launching the product for you. So, do not wait, grab the presentation templates today

Dashboard To Analyze Flexible Working Strategies Impact On Employees Performance Professional PDF
The following slide delineates a key performance indicator KPI dashboard through which managers can evaluate the success of a flexible working policy on workforce performance. The major KPIs are absenteeism rate, overall labor effectiveness etc. If you are looking for a format to display your unique thoughts, then the professionally designed Dashboard To Analyze Flexible Working Strategies Impact On Employees Performance Professional PDF is the one for you. You can use it as a Google Slides template or a PowerPoint template. Incorporate impressive visuals, symbols, images, and other charts. Modify or reorganize the text boxes as you desire. Experiment with shade schemes and font pairings. Alter, share or cooperate with other people on your work. Download Dashboard To Analyze Flexible Working Strategies Impact On Employees Performance Professional PDF and find out how to give a successful presentation. Present a perfect display to your team and make your presentation unforgettable.

Significance Of CPA To Maximize Digital Marketing ROI Dashboard To Track CPA Advertiser Performance Pictures PDF
This slide present the kpi dashboard to monitor the performance of CPA advertiser. It includes metrics such as sales number, commission, sales amount, CTR, number of clicks, sessions, CTC, advertiser performance report, etc. Here you can discover an assortment of the finest PowerPoint and Google Slides templates. With these templates, you can create presentations for a variety of purposes while simultaneously providing your audience with an eye-catching visual experience. Download Significance Of CPA To Maximize Digital Marketing ROI Dashboard To Track CPA Advertiser Performance Pictures PDF to deliver an impeccable presentation. These templates will make your job of preparing presentations much quicker, yet still, maintain a high level of quality. Slidegeeks has experienced researchers who prepare these templates and write high-quality content for you. Later on, you can personalize the content by editing the Significance Of CPA To Maximize Digital Marketing ROI Dashboard To Track CPA Advertiser Performance Pictures PDF.

Strategies For Implementing CPA Marketing How To Measure CPA Marketing Performance Portrait PDF
Mentioned slide showcase the estimation of CPA marketing campaign performance. It provides total advertising cost, average cost per action calculation explained with help of an example. Presenting this PowerPoint presentation, titled Strategies For Implementing CPA Marketing How To Measure CPA Marketing Performance Portrait PDF, with topics curated by our researchers after extensive research. This editable presentation is available for immediate download and provides attractive features when used. Download now and captivate your audience. Presenting this Strategies For Implementing CPA Marketing How To Measure CPA Marketing Performance Portrait PDF. Our researchers have carefully researched and created these slides with all aspects taken into consideration. This is a completely customizable Strategies For Implementing CPA Marketing How To Measure CPA Marketing Performance Portrait PDF that is available for immediate downloading. Download now and make an impact on your audience. Highlight the attractive features available with our PPTs.
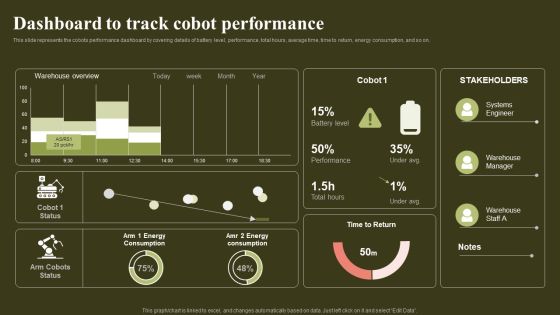
Revolutionizing Human Machine Collaboration Cobots Dashboard To Track Cobot Performance Clipart PDF
This slide represents the cobots performance dashboard by covering details of battery level, performance, total hours, average time, time to return, energy consumption, and so on. Here you can discover an assortment of the finest PowerPoint and Google Slides templates. With these templates, you can create presentations for a variety of purposes while simultaneously providing your audience with an eye catching visual experience. Download Revolutionizing Human Machine Collaboration Cobots Dashboard To Track Cobot Performance Clipart PDF to deliver an impeccable presentation. These templates will make your job of preparing presentations much quicker, yet still, maintain a high level of quality. Slidegeeks has experienced researchers who prepare these templates and write high quality content for you. Later on, you can personalize the content by editing the Revolutionizing Human Machine Collaboration Cobots Dashboard To Track Cobot Performance Clipart PDF.
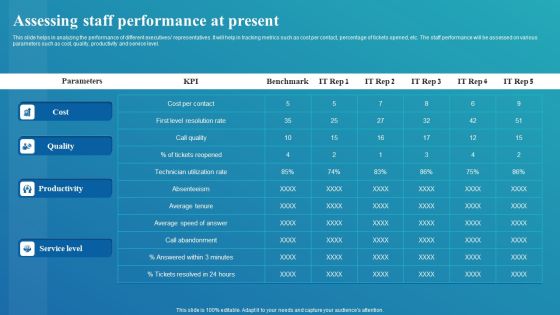
Framework For Digital Transformation And Modernization Assessing Staff Performance At Present Download PDF
This slide helps in analyzing the performance of different executives representatives. It will help in tracking metrics such as cost per contact, percentage of tickets opened, etc. The staff performance will be assessed on various parameters such as cost, quality, productivity and service level. This Framework For Digital Transformation And Modernization Assessing Staff Performance At Present Download PDF from Slidegeeks makes it easy to present information on your topic with precision. It provides customization options, so you can make changes to the colors, design, graphics, or any other component to create a unique layout. It is also available for immediate download, so you can begin using it right away. Slidegeeks has done good research to ensure that you have everything you need to make your presentation stand out. Make a name out there for a brilliant performance.
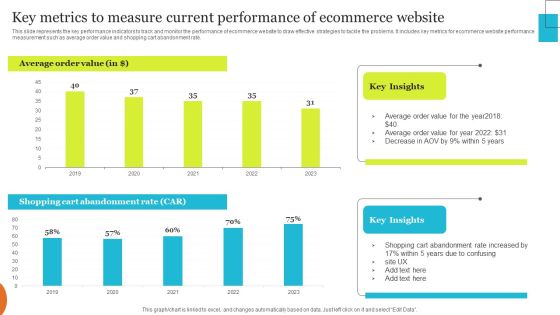
Implementing Effective Ecommerce Managemnet Platform Key Metrics To Measure Current Performance Clipart PDF
This slide represents the key performance indicators to track and monitor the performance of ecommerce website to draw effective strategies to tackle the problems. It includes key metrics for ecommerce website performance measurement such as average order value and shopping cart abandonment rate. Want to ace your presentation in front of a live audience Our Implementing Effective Ecommerce Managemnet Platform Key Metrics To Measure Current Performance Clipart PDF can help you do that by engaging all the users towards you. Slidegeeks experts have put their efforts and expertise into creating these impeccable powerpoint presentations so that you can communicate your ideas clearly. Moreover, all the templates are customizable, and easy to edit and downloadable. Use these for both personal and commercial use.

Strategic Plan To Establish And Promote Brand Awareness Brand Performance Overview Market Share Portrait PDF
Purpose of this slide is to address information about brand performance. Information covered are of competitors, product market share and performance status. Do you have to make sure that everyone on your team knows about any specific topic I yes, then you should give Strategic Plan To Establish And Promote Brand Awareness Brand Performance Overview Market Share Portrait PDF a try. Our experts have put a lot of knowledge and effort into creating this impeccable Strategic Plan To Establish And Promote Brand Awareness Brand Performance Overview Market Share Portrait PDF. You can use this template for your upcoming presentations, as the slides are perfect to represent even the tiniest detail. You can download these templates from the Slidegeeks website and these are easy to edit. So grab these today.
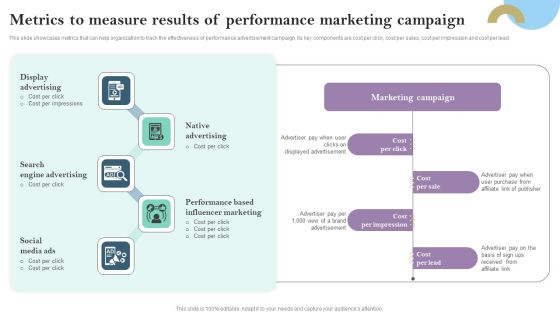
Metrics To Measure Results Of Performance Marketing Campaign Ppt PowerPoint Presentation Diagram Graph Charts PDF
This slide showcases metrics that can help organization to track the effectiveness of performance advertisement campaign. Its key components are cost per click, cost per sales, cost per impression and cost per lead Presenting this PowerPoint presentation, titled Metrics To Measure Results Of Performance Marketing Campaign Ppt PowerPoint Presentation Diagram Graph Charts PDF, with topics curated by our researchers after extensive research. This editable presentation is available for immediate download and provides attractive features when used. Download now and captivate your audience. Presenting this Metrics To Measure Results Of Performance Marketing Campaign Ppt PowerPoint Presentation Diagram Graph Charts PDF. Our researchers have carefully researched and created these slides with all aspects taken into consideration. This is a completely customizable Metrics To Measure Results Of Performance Marketing Campaign Ppt PowerPoint Presentation Diagram Graph Charts PDF that is available for immediate downloading. Download now and make an impact on your audience. Highlight the attractive features available with our PPTs.

Evaluating Current Marketing Performance Of Organization Ppt PowerPoint Presentation File Files PDF
This slide showcases overview of current marketing performance that can help organization to determine issues in current promotional campaigns. Its key elements are website traffic, marketing budget and product sales Presenting this PowerPoint presentation, titled Evaluating Current Marketing Performance Of Organization Ppt PowerPoint Presentation File Files PDF, with topics curated by our researchers after extensive research. This editable presentation is available for immediate download and provides attractive features when used. Download now and captivate your audience. Presenting this Evaluating Current Marketing Performance Of Organization Ppt PowerPoint Presentation File Files PDF. Our researchers have carefully researched and created these slides with all aspects taken into consideration. This is a completely customizable Evaluating Current Marketing Performance Of Organization Ppt PowerPoint Presentation File Files PDF that is available for immediate downloading. Download now and make an impact on your audience. Highlight the attractive features available with our PPTs.
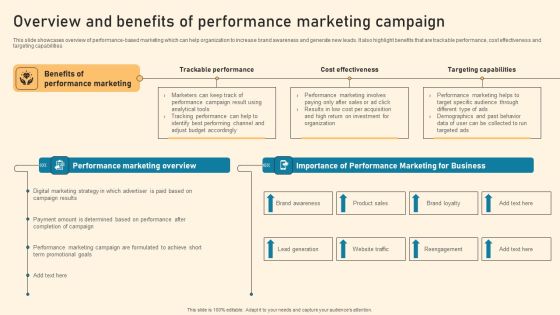
Overview And Benefits Of Performance Marketing Campaign Ppt PowerPoint Presentation File Background Images PDF
This slide showcases overview of performance-based marketing which can help organization to increase brand awareness and generate new leads. It also highlight benefits that are trackable performance, cost effectiveness and targeting capabilities Get a simple yet stunning designed Overview And Benefits Of Performance Marketing Campaign Ppt PowerPoint Presentation File Background Images PDF. It is the best one to establish the tone in your meetings. It is an excellent way to make your presentations highly effective. So, download this PPT today from Slidegeeks and see the positive impacts. Our easy to edit Overview And Benefits Of Performance Marketing Campaign Ppt PowerPoint Presentation File Background Images PDF can be your go to option for all upcoming conferences and meetings. So, what are you waiting for Grab this template today.
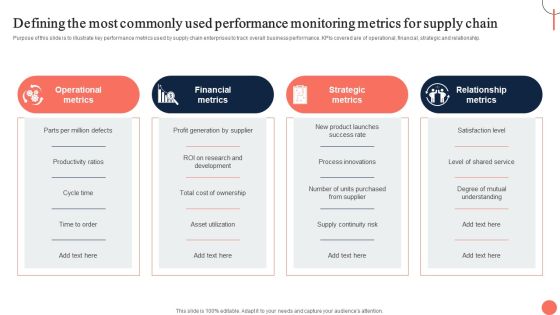
Strategies For Dynamic Supply Chain Agility Defining The Most Commonly Used Performance Demonstration PDF
Purpose of this slide is to illustrate key performance metrics used by supply chain enterprises to track overall business performance. KPIs covered are of operational, financial, strategic and relationship. Create an editable Strategies For Dynamic Supply Chain Agility Defining The Most Commonly Used Performance Demonstration PDF that communicates your idea and engages your audience. Whether youre presenting a business or an educational presentation, pre designed presentation templates help save time. Strategies For Dynamic Supply Chain Agility Defining The Most Commonly Used Performance Demonstration PDF is highly customizable and very easy to edit, covering many different styles from creative to business presentations. Slidegeeks has creative team members who have crafted amazing templates. So, go and get them without any delay.

 Home
Home