Performance Management
Strategic Corporate Planning To Attain Corporate Financial Performance Tracking Dashboard Icons PDF
This slide provides information regarding dashboard utilized by firm to monitor financial performance. The performance is tracked through revenues generated, vendors associated, profit generated, etc. This Strategic Corporate Planning To Attain Corporate Financial Performance Tracking Dashboard Icons PDF is perfect for any presentation, be it in front of clients or colleagues. It is a versatile and stylish solution for organizing your meetings. The Strategic Corporate Planning To Attain Corporate Financial Performance Tracking Dashboard Icons PDF features a modern design for your presentation meetings. The adjustable and customizable slides provide unlimited possibilities for acing up your presentation. Slidegeeks has done all the homework before launching the product for you. So, do not wait, grab the presentation templates today

Advancement Of Retail Store In Future Analyzing Present Performance Delivery Gap Guidelines PDF
This slide provides information regarding the present delivery gap that retail store is facing in terms of its performance as compared to the industry standards. The firms performance is assessed on metrics such as marketing effectiveness, response rate, forecast accuracy, lead qualification rate, etc. Presenting advancement of retail store in future analyzing present performance delivery gap guidelines pdf to provide visual cues and insights. Share and navigate important information on five stages that need your due attention. This template can be used to pitch topics like performance metrics, industry benchmark, retail store, online store. In addtion, this PPT design contains high resolution images, graphics, etc, that are easily editable and available for immediate download.
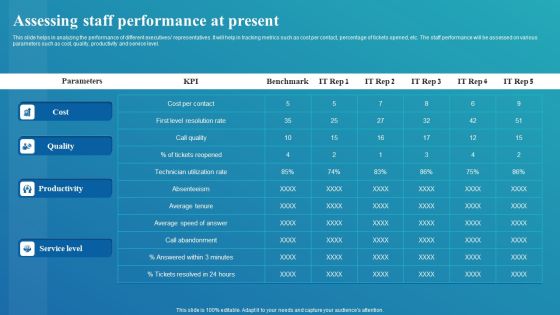
Framework For Digital Transformation And Modernization Assessing Staff Performance At Present Download PDF
This slide helps in analyzing the performance of different executives representatives. It will help in tracking metrics such as cost per contact, percentage of tickets opened, etc. The staff performance will be assessed on various parameters such as cost, quality, productivity and service level. This Framework For Digital Transformation And Modernization Assessing Staff Performance At Present Download PDF from Slidegeeks makes it easy to present information on your topic with precision. It provides customization options, so you can make changes to the colors, design, graphics, or any other component to create a unique layout. It is also available for immediate download, so you can begin using it right away. Slidegeeks has done good research to ensure that you have everything you need to make your presentation stand out. Make a name out there for a brilliant performance.
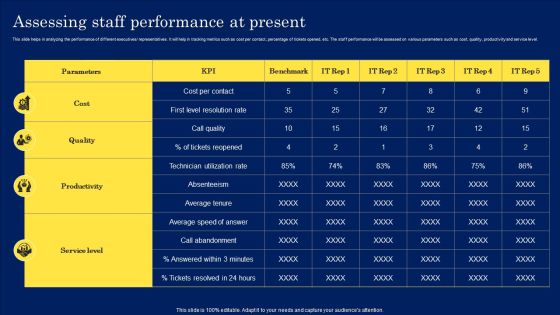
Digitization Framework For Technology Advancement Assessing Staff Performance At Present Inspiration PDF
This slide helps in analyzing the performance of different executives or representatives. It will help in tracking metrics such as cost per contact, percentage of tickets opened, etc. The staff performance will be assessed on various parameters such as cost, quality, productivity and service level. Here you can discover an assortment of the finest PowerPoint and Google Slides templates. With these templates, you can create presentations for a variety of purposes while simultaneously providing your audience with an eye catching visual experience. Download Digitization Framework For Technology Advancement Assessing Staff Performance At Present Inspiration PDF to deliver an impeccable presentation. These templates will make your job of preparing presentations much quicker, yet still, maintain a high level of quality. Slidegeeks has experienced researchers who prepare these templates and write high quality content for you. Later on, you can personalize the content by editing the Digitization Framework For Technology Advancement Assessing Staff Performance At Present Inspiration PDF.

Deliver Efficiency Innovation Metrics Used To Measure Product Team Performance Designs PDF
This slide represents metrics used to measure product team performance that covers product stickiness and usage, feature adoption and retention, net promoter score, product delivery predictability, etc. Deliver an awe inspiring pitch with this creative Deliver Efficiency Innovation Metrics Used To Measure Product Team Performance Designs PDF bundle. Topics like Metrics, Percentage, Product Stickiness, Product Usage can be discussed with this completely editable template. It is available for immediate download depending on the needs and requirements of the user.
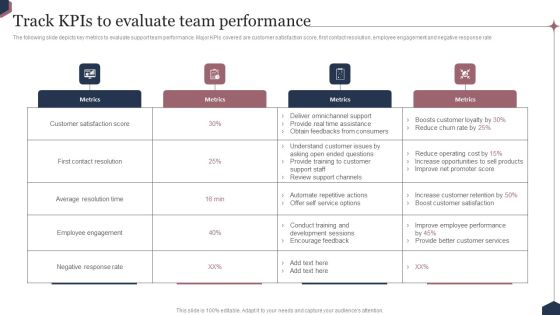
Enhance Customer Engagement Through After Sales Activities Track Kpis To Evaluate Team Performance Microsoft PDF
The following slide depicts key metrics to evaluate support team performance. Major KPIs covered are customer satisfaction score, first contact resolution, employee engagement and negative response rate There are so many reasons you need a Enhance Customer Engagement Through After Sales Activities Track Kpis To Evaluate Team Performance Microsoft PDF. The first reason is you can not spend time making everything from scratch, Thus, Slidegeeks has made presentation templates for you too. You can easily download these templates from our website easily.

Competitive Landscape Analysis Based On Product Performance Strategic Promotion Plan Template PDF
Following slide displays competitive landscape analysis based on product performance. Performance is measured based on attributes namely market awareness, product quality, customer experience etc.Find highly impressive Competitive Landscape Analysis Based On Product Performance Strategic Promotion Plan Template PDF on Slidegeeks to deliver a meaningful presentation. You can save an ample amount of time using these presentation templates. No need to worry to prepare everything from scratch because Slidegeeks experts have already done a huge research and work for you. You need to download Competitive Landscape Analysis Based On Product Performance Strategic Promotion Plan Template PDF for your upcoming presentation. All the presentation templates are 100 precent editable and you can change the color and personalize the content accordingly. Download now.

AMR Robot Dashboard To Track Autonomous Mobile Robot Performance Ppt PowerPoint Presentation Diagram Images PDF
This slide represents the dashboard to track the AMRs performance in the warehouse. It covers various AMRs status reports, energy consumption, battery level, total working hours, and time to return. Presenting this PowerPoint presentation, titled AMR Robot Dashboard To Track Autonomous Mobile Robot Performance Ppt PowerPoint Presentation Diagram Images PDF, with topics curated by our researchers after extensive research. This editable presentation is available for immediate download and provides attractive features when used. Download now and captivate your audience. Presenting this AMR Robot Dashboard To Track Autonomous Mobile Robot Performance Ppt PowerPoint Presentation Diagram Images PDF. Our researchers have carefully researched and created these slides with all aspects taken into consideration. This is a completely customizable AMR Robot Dashboard To Track Autonomous Mobile Robot Performance Ppt PowerPoint Presentation Diagram Images PDF that is available for immediate downloading. Download now and make an impact on your audience. Highlight the attractive features available with our PPTs.

Collaborative Robots IT Dashboard To Track Cobot Performance Ppt Slides Guidelines PDF
This slide represents the cobots performance dashboard by covering details of battery level, performance, total hours, average time, time to return, energy consumption, and so on. If you are looking for a format to display your unique thoughts, then the professionally designed Collaborative Robots IT Dashboard To Track Cobot Performance Ppt Slides Guidelines PDF is the one for you. You can use it as a Google Slides template or a PowerPoint template. Incorporate impressive visuals, symbols, images, and other charts. Modify or reorganize the text boxes as you desire. Experiment with shade schemes and font pairings. Alter, share or cooperate with other people on your work. Download Collaborative Robots IT Dashboard To Track Cobot Performance Ppt Slides Guidelines PDF and find out how to give a successful presentation. Present a perfect display to your team and make your presentation unforgettable.

KPI Dashboard To Analyze In Store Merchandising Strategy Performance Introduction PDF
The following slide outlines a performance key performance indicator KPI dashboard used to evaluate the effectiveness of in-store merchandising strategy. The KPIs covered in the slide are total sales, average inventory, active stores, distinct products sold, etc. Formulating a presentation can take up a lot of effort and time, so the content and message should always be the primary focus. The visuals of the PowerPoint can enhance the presenters message, so our KPI Dashboard To Analyze In Store Merchandising Strategy Performance Introduction PDF was created to help save time. Instead of worrying about the design, the presenter can concentrate on the message while our designers work on creating the ideal templates for whatever situation is needed. Slidegeeks has experts for everything from amazing designs to valuable content, we have put everything into KPI Dashboard To Analyze In Store Merchandising Strategy Performance Introduction PDF.
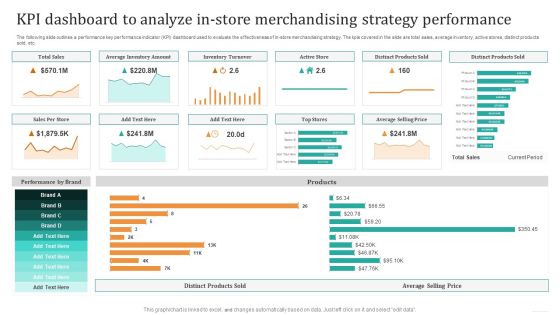
KPI Dashboard To Analyze In Store Merchandising Strategy Performance Pictures PDF
The following slide outlines a performance key performance indicator KPI dashboard used to evaluate the effectiveness of in-store merchandising strategy. The KPIs covered in the slide are total sales, average inventory, active stores, distinct products sold, etc. Formulating a presentation can take up a lot of effort and time, so the content and message should always be the primary focus. The visuals of the PowerPoint can enhance the presenters message, so our KPI Dashboard To Analyze In Store Merchandising Strategy Performance Pictures PDF was created to help save time. Instead of worrying about the design, the presenter can concentrate on the message while our designers work on creating the ideal templates for whatever situation is needed. Slidegeeks has experts for everything from amazing designs to valuable content, we have put everything into KPI Dashboard To Analyze In Store Merchandising Strategy Performance Pictures PDF.
Recommender Systems Performance Tracking Dashboard Integrating Recommender System To Enhance Guidelines PDF
This slide shows the dashboard to keep a track of the performance of recommender systems. The purpose of this slide is to provide a graphical representation of recommendation engines performance to enhance the accuracy and effectiveness of the system.Find highly impressive Recommender Systems Performance Tracking Dashboard Integrating Recommender System To Enhance Guidelines PDF on Slidegeeks to deliver a meaningful presentation. You can save an ample amount of time using these presentation templates. No need to worry to prepare everything from scratch because Slidegeeks experts have already done a huge research and work for you. You need to download Recommender Systems Performance Tracking Dashboard Integrating Recommender System To Enhance Guidelines PDF for your upcoming presentation. All the presentation templates are 100 precent editable and you can change the color and personalize the content accordingly. Download now.
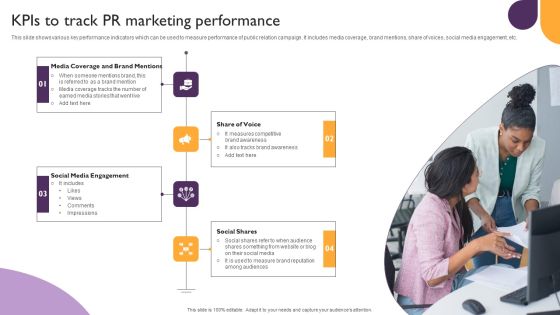
Public Relations Guide To Enhance Brand Credibility Kpis To Track PR Marketing Performance Infographics PDF
This slide shows various key performance indicators which can be used to measure performance of public relation campaign. It includes media coverage, brand mentions, share of voices, social media engagement, etc. Formulating a presentation can take up a lot of effort and time, so the content and message should always be the primary focus. The visuals of the PowerPoint can enhance the presenters message, so our Public Relations Guide To Enhance Brand Credibility Kpis To Track PR Marketing Performance Infographics PDF was created to help save time. Instead of worrying about the design, the presenter can concentrate on the message while our designers work on creating the ideal templates for whatever situation is needed. Slidegeeks has experts for everything from amazing designs to valuable content, we have put everything into Public Relations Guide To Enhance Brand Credibility Kpis To Track PR Marketing Performance Infographics PDF

Overview Of Performance Marketing Channels To Run Promotional Campaigns Download PDF
This slide showcase overview of performance based marketing channels which can help marketers to run online promotional campaigns. Platforms include - search engine ads, performance based influencer marketing, social media ads, display ads and native ads. If you are looking for a format to display your unique thoughts, then the professionally designed Overview Of Performance Marketing Channels To Run Promotional Campaigns Download PDF is the one for you. You can use it as a Google Slides template or a PowerPoint template. Incorporate impressive visuals, symbols, images, and other charts. Modify or reorganize the text boxes as you desire. Experiment with shade schemes and font pairings. Alter, share or cooperate with other people on your work. Download Overview Of Performance Marketing Channels To Run Promotional Campaigns Download PDF and find out how to give a successful presentation. Present a perfect display to your team and make your presentation unforgettable.

Deployment Of Smart Factory Solutions Sustainable Manufacturing Performance Evaluation Framework Professional PDF
This slide represents sustainable manufacturing performance evaluation framework. It covers process metrics, product metrics, 6r methodology etc. Deliver and pitch your topic in the best possible manner with this Deployment Of Smart Factory Solutions Sustainable Manufacturing Performance Evaluation Framework Professional PDF. Use them to share invaluable insights on Organization, Supply Chain, Process Metrics and impress your audience. This template can be altered and modified as per your expectations. So, grab it now.

Bar Chart With Annual Performance Analysis Over Years Ppt PowerPoint Presentation Design Ideas
This is a bar chart with annual performance analysis over years ppt powerpoint presentation design ideas. This is a five stage process. The stages in this process are business, strategy, marketing, analysis, line graph.

Content Marketing Performance Template 1 Ppt PowerPoint Presentation Infographics Graphics Example
This is a content marketing performance template 1 ppt powerpoint presentation infographics graphics example. This is a eight stage process. The stages in this process are brand awareness, engagement, sales, lead generation, customer retention lead nurturing, upsell.
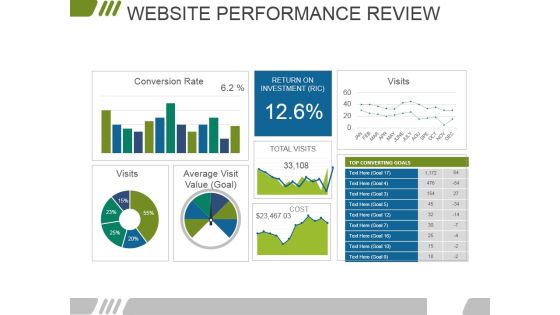
Website Performance Review Template 2 Ppt PowerPoint Presentation Infographics Background Designs
This is a website performance review template 2 ppt powerpoint presentation infographics background designs. This is a three stage process. The stages in this process are conversion rate, visits, return on investment, average visit value.
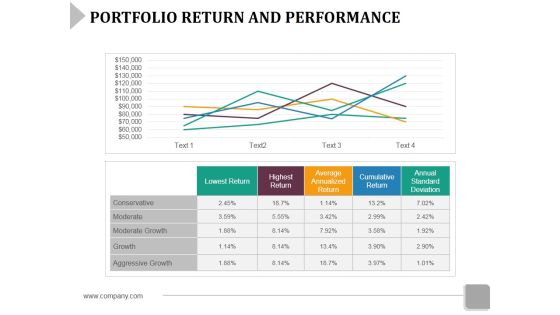
Portfolio Return And Performance Template 1 Ppt PowerPoint Presentation Layouts Mockup
This is a portfolio return and performance template 1 ppt powerpoint presentation layouts mockup. This is a five stage process. The stages in this process are conservative, moderate, moderate growth, lowest return.
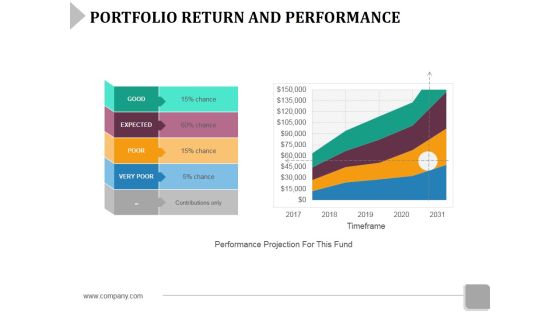
Portfolio Return And Performance Template 2 Ppt PowerPoint Presentation Summary Influencers
This is a portfolio return and performance template 2 ppt powerpoint presentation summary influencers. This is a four stage process. The stages in this process are good, expected, poor, very poor.
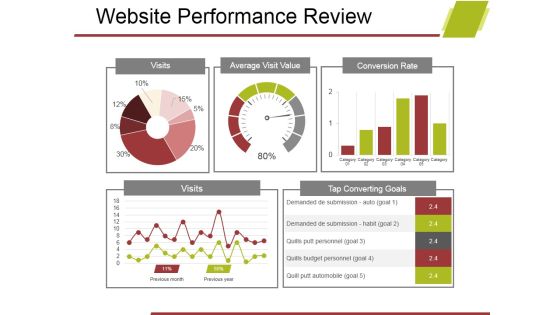
Website Performance Review Template 2 Ppt PowerPoint Presentation Model File Formats
This is a website performance review template 2 ppt powerpoint presentation model file formats. This is a five stage process. The stages in this process are visits, average visit value, conversion rate, visits, tap converting goals.

Portfolio Return And Performance Template 1 Ppt PowerPoint Presentation Pictures Show
This is a portfolio return and performance template 1 ppt powerpoint presentation pictures show. This is a four stage process. The stages in this process are good, expected, poor, very poor, chance.

Portfolio Return And Performance Template 2 Ppt PowerPoint Presentation Summary Example
This is a portfolio return and performance template 2 ppt powerpoint presentation summary example. This is a four stage process. The stages in this process are good, expected, poor, very poor, chance.

Portfolio Return And Performance Template 2 Ppt PowerPoint Presentation File Mockup
This is a portfolio return and performance template 2 ppt powerpoint presentation file mockup. This is a four stage process. The stages in this process are business, finance, marketing, strategy, analysis.

Content Marketing Performance Template 1 Ppt PowerPoint Presentation Infographic Template Brochure
This is a content marketing performance template 1 ppt powerpoint presentation infographic template brochure. This is a eight stage process. The stages in this process are business, finance, marketing, strategy, analysis.
Website Performance Review Template 2 Ppt PowerPoint Presentation Icon Master Slide
This is a website performance review template 2 ppt powerpoint presentation icon master slide. This is a three stage process. The stages in this process are cost, visits, conversion rate.

Brand Performance Dashboard Template 1 Ppt PowerPoint Presentation Infographic Template Vector
This is a brand performance dashboard template 1 ppt powerpoint presentation infographic template vector. This is a five stage process. The stages in this process are dashboard, measurement, analysis, strategy, business.

Brand Performance Dashboard Template 2 Ppt PowerPoint Presentation Show Designs Download
This is a brand performance dashboard template 2 ppt powerpoint presentation show designs download. This is a two stage process. The stages in this process are business, location, geography, information, strategy.

Customer Satisfaction And Performance Metrics Ppt PowerPoint Presentation Complete Deck With Slides
This is a customer satisfaction and performance metrics ppt powerpoint presentation complete deck with slides. This is a one stage process. The stages in this process are customer, service, marketing, planning, strategy.

Project Conclusion Report Performance Analysis Ppt PowerPoint Presentation Slides Design Templates
This is a project conclusion report performance analysis ppt powerpoint presentation slides design templates. This is a three stage process. The stages in this process are business, marketing, table, compare, analysis.
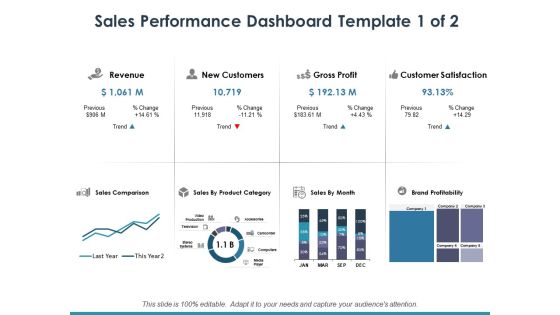
Sales Performance Dashboard Template 1 Ppt PowerPoint Presentation Infographic Template Maker
This is a sales performance dashboard template 1 ppt powerpoint presentation infographic template maker. This is a eight stage process. The stages in this process are dollar, business, finance, marketing.

Measuring Sales Performance And Productivity Ppt PowerPoint Presentation Infographic Template Sample
This is a measuring sales performance and productivity ppt powerpoint presentation infographic template sample. This is a eight stage process. The stages in this process are sales objectives, sales goal, achieving sales target.

Reaching Business Goals Performance Indicator Ppt PowerPoint Presentation Pictures Infographic Template
This is a reaching business goals performance indicator ppt powerpoint presentation pictures infographic template. This is a one stage process. The stages in this process are sales objectives, sales goal, achieving sales target.

Performance Gap Analysis Current And Future State Ppt PowerPoint Presentation Layouts Slide Download

Bar Chart For Business Performance Evaluation Ppt PowerPoint Presentation Infographics Professional
This is a bar chart for business performance evaluation ppt powerpoint presentation infographics professional. This is a five stage process. The stages in this process are metrics icon, kpis icon, statistics icon.

Recognize Great Employee Performance With A Handwritten Note Ppt PowerPoint Presentation Gallery Backgrounds
This is a recognize great employee performance with a handwritten note ppt powerpoint presentation gallery backgrounds. This is a two stage process. The stages in this process are recognize, encourage, innovation, planning, marketing, strategy.

Key Performance Indicator Analytics Dashboard Ppt PowerPoint Presentation Model Example Topics
This is a key performance indicator analytics dashboard ppt powerpoint presentation model example topics. This is a five stage process. The stages in this process are kpi proposal, kpi plan, kpi scheme.

Sales Goals And Performance Kpis Influence Position And Protection Ppt PowerPoint Presentation Styles Inspiration
This is a sales goals and performance kpis influence position and protection ppt powerpoint presentation styles inspiration. This is a three stage process. The stages in this process are kpi proposal, kpi plan, kpi scheme.

Bar Charts For Business Performance Analysis Ppt PowerPoint Presentation Show Slideshow
This is a bar charts for business performance analysis ppt powerpoint presentation show slideshow. This is a two stage process. The stages in this process are compare, comparison of two, competitive analysis.

Comparing Performance Of Two Business Sectors Ppt PowerPoint Presentation Layouts Design Templates
This is a comparing performance of two business sectors ppt powerpoint presentation layouts design templates. This is a five stage process. The stages in this process are compare, comparison of two, competitive analysis.
Four Points Performance Comparison Of Two Business Sectors Ppt PowerPoint Presentation Layouts Icons
This is a four points performance comparison of two business sectors ppt powerpoint presentation layouts icons. This is a four stage process. The stages in this process are compare, comparison of two, competitive analysis.
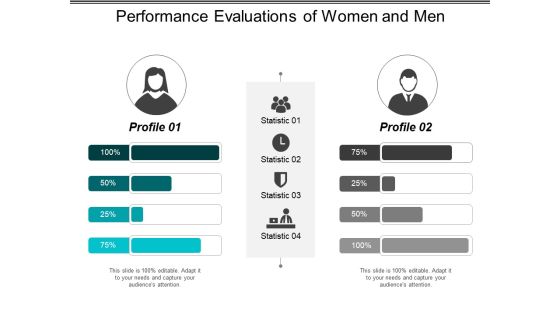
Performance Evaluations Of Women And Men Ppt PowerPoint Presentation File Design Ideas
This is a performance evaluations of women and men ppt powerpoint presentation file design ideas. This is a two stage process. The stages in this process are compare, comparison of two, competitive analysis.
Three Points Performance Comparison Of Two Business Sectors Ppt PowerPoint Presentation Icon Graphic Tips
This is a three points performance comparison of two business sectors ppt powerpoint presentation icon graphic tips. This is a three stage process. The stages in this process are compare, comparison of two, competitive analysis.

Improve Sales Performance And Productivity Ppt PowerPoint Presentation Diagram Graph Charts
This is a improve sales performance and productivity ppt powerpoint presentation diagram graph charts. This is a four stage process. The stages in this process are marketing effort, branding initiative, marketing initiatives.
Pie Chart For Measuring Marketing Performance Ppt PowerPoint Presentation Icon Format
This is a pie chart for measuring marketing performance ppt powerpoint presentation icon format. This is a eight stage process. The stages in this process are b2b marketing strategy, b2b marketing plan, b2b marketing approach.
Financial Performance Report Vector Icon Ppt Powerpoint Presentation Pictures Background Image
This is a financial performance report vector icon ppt powerpoint presentation pictures background image. This is a four stage process. The stages in this process are financial statements icon, accounting ratio icon, balance sheet icon.

Product Competitive Analysis Feature And Performance Ppt Powerpoint Presentation Show Graphics Design
This is a product competitive analysis feature and performance ppt powerpoint presentation show graphics design. This is a five stage process. The stages in this process are competitive analysis, product differentiation, product competition.
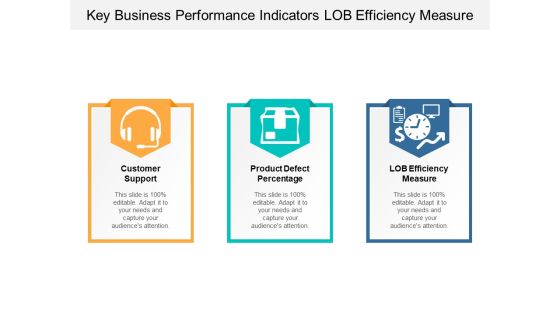
Key Business Performance Indicators Lob Efficiency Measure Ppt Powerpoint Presentation Infographics File Formats
This is a key business performance indicators lob efficiency measure ppt powerpoint presentation infographics file formats. This is a three stage process. The stages in this process are dashboard, kpi, metrics.
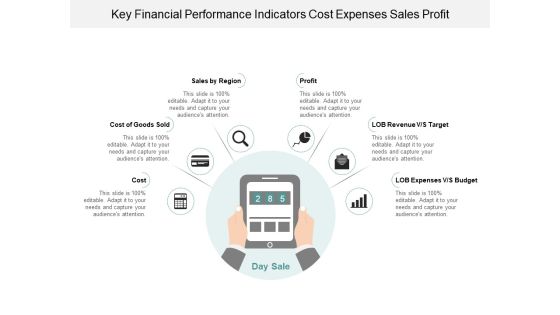
Key Financial Performance Indicators Cost Expenses Sales Profit Ppt Powerpoint Presentation Infographic Template Graphic Images
This is a key financial performance indicators cost expenses sales profit ppt powerpoint presentation infographic template graphic images. This is a six stage process. The stages in this process are dashboard, kpi, metrics.
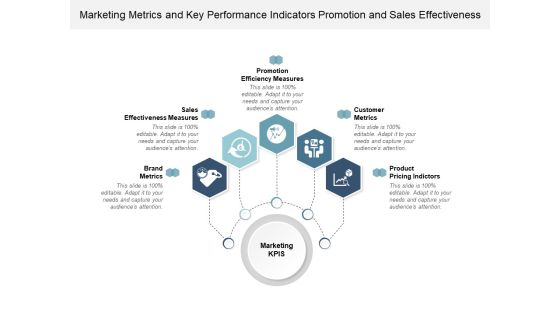
Marketing Metrics And Key Performance Indicators Promotion And Sales Effectiveness Ppt Powerpoint Presentation Infographics Graphics Example
This is a marketing metrics and key performance indicators promotion and sales effectiveness ppt powerpoint presentation infographics graphics example. This is a five stage process. The stages in this process are dashboard, kpi, metrics.
Performance Indicators Of Business Icons Ppt Powerpoint Presentation Infographics Graphics Template
This is a performance indicators of business icons ppt powerpoint presentation infographics graphics template. This is a four stage process. The stages in this process are dashboard, kpi, metrics.

Profitability Key Performance Indicators Financial Activities Cash Flow Ppt Powerpoint Presentation Portfolio Clipart Images
This is a profitability key performance indicators financial activities cash flow ppt powerpoint presentation portfolio clipart images. This is a five stage process. The stages in this process are dashboard, kpi, metrics.
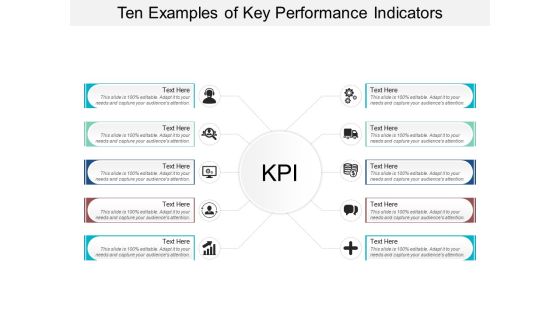
Ten Examples Of Key Performance Indicators Ppt Powerpoint Presentation Layouts Professional
This is a ten examples of key performance indicators ppt powerpoint presentation layouts professional. This is a ten stage process. The stages in this process are dashboard, kpi, metrics.

Online Business Strategy Market Research And Performance Analytics Ppt Powerpoint Presentation Infographics Images
This is a online business strategy market research and performance analytics ppt powerpoint presentation infographics images. This is a five stage process. The stages in this process are ecommerce, mercantilism, commercialism.
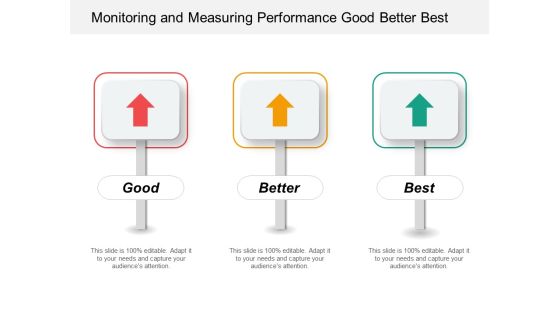
Monitoring And Measuring Performance Good Better Best Ppt Powerpoint Presentation Gallery Graphics
This is a monitoring and measuring performance good better best ppt powerpoint presentation gallery graphics. This is a three stage process. The stages in this process are good better best, good great superb, good great excellent.
Performance Tracking Good Better Best With Icons Ppt Powerpoint Presentation Show Graphics
This is a performance tracking good better best with icons ppt powerpoint presentation show graphics. This is a three stage process. The stages in this process are good better best, good great superb, good great excellent.

Data Statistics Charts And Key Performance Indicators Ppt Powerpoint Presentation Layouts Guide
This is a data statistics charts and key performance indicators ppt powerpoint presentation layouts guide. This is a four stage process. The stages in this process are business metrics, business kpi, business dashboard.
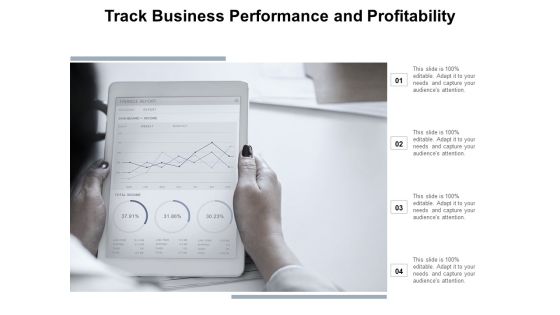
Track Business Performance And Profitability Ppt Powerpoint Presentation File Master Slide
This is a track business performance and profitability ppt powerpoint presentation file master slide. This is a four stage process. The stages in this process are business metrics, business kpi, business dashboard.
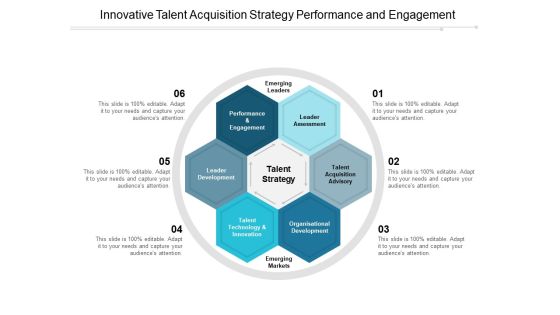
Innovative Talent Acquisition Strategy Performance And Engagement Ppt PowerPoint Presentation Slides Background
This is a innovative talent acquisition strategy performance and engagement ppt powerpoint presentation slides background. This is a six stage process. The stages in this process are talent strategy, talent plan, talent approach.

Availability Key Performance Indicator Inventory Turnover Ratio Ppt Powerpoint Presentation Layouts Graphics Download
This is a availability key performance indicator inventory turnover ratio ppt powerpoint presentation layouts graphics download. This is a two stage process. The stages in this process are availability kpi, availability dashboard, availability metrics.
 Home
Home