Performance Management System

One Pager Weekly Conference Agenda For Executives Performance Evaluation PDF Document PPT Template
Presenting you a fantastic One Pager Weekly Conference Agenda For Executives Performance Evaluation PDF Document PPT Template. This one-pager document is crafted on hours of research and professional design efforts to ensure you have the best resource. It is completely editable and its design allow you to rehash its elements to suit your needs. Get this One Pager Weekly Conference Agenda For Executives Performance Evaluation PDF Document PPT Template Download now.

Effective Staff Performance Optimization Techniques Employee Current Skills Gap Assessment Professional PDF
The following slide showcases the gap in employees current and desired skill level to boost learning and development. It includes elements such as negotiation skills, time management, decision making, problem solving, data analytics etc. Get a simple yet stunning designed Effective Staff Performance Optimization Techniques Employee Current Skills Gap Assessment Professional PDF. It is the best one to establish the tone in your meetings. It is an excellent way to make your presentations highly effective. So, download this PPT today from Slidegeeks and see the positive impacts. Our easy to edit Effective Staff Performance Optimization Techniques Employee Current Skills Gap Assessment Professional PDF can be your go to option for all upcoming conferences and meetings. So, what are you waiting for Grab this template today.
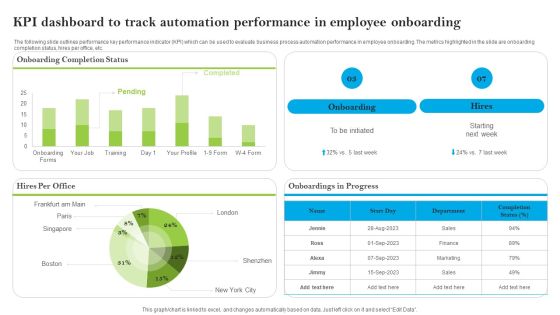
Introducing AI Tools KPI Dashboard To Track Automation Performance In Employee Formats PDF
The following slide outlines performance key performance indicator KPI which can be used to evaluate business process automation performance in employee onboarding. The metrics highlighted in the slide are onboarding completion status, hires per office, etc. This modern and well-arranged Introducing AI Tools KPI Dashboard To Track Automation Performance In Employee Formats PDF provides lots of creative possibilities. It is very simple to customize and edit with the Powerpoint Software. Just drag and drop your pictures into the shapes. All facets of this template can be edited with Powerpoint, no extra software is necessary. Add your own material, put your images in the places assigned for them, adjust the colors, and then you can show your slides to the world, with an animated slide included.
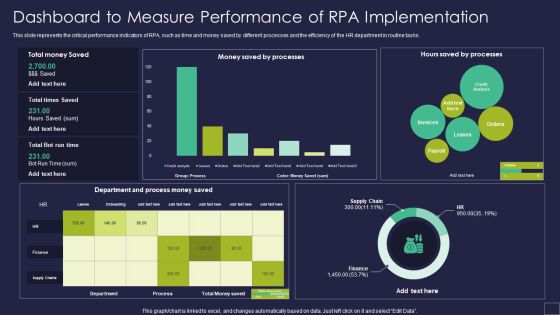
Dashboard To Measure Performance Of RPA Implementation Robotic Process Automation Technology Slides PDF
This slide represents the critical performance indicators of RPA, such as time and money saved by different processes and the efficiency of the HR department in routine tasks. Deliver an awe inspiring pitch with this creative Dashboard To Measure Performance Of RPA Implementation Robotic Process Automation Technology Slides PDF bundle. Topics like Department Process, Saved Processes, Hours Saved can be discussed with this completely editable template. It is available for immediate download depending on the needs and requirements of the user.

Customer Support Kpi Dashboard For Evaluating Sales Business Process Outsourcing Performance Slides PDF
Pitch your topic with ease and precision using this customer support kpi dashboard for evaluating sales business process outsourcing performance slides pdf. This layout presents information on customer support kpi dashboard for evaluating sales business process outsourcing performance. It is also available for immediate download and adjustment. So, changes can be made in the color, design, graphics or any other component to create a unique layout.

Website Performance Review Template 1 Ppt PowerPoint Presentation Portfolio Master Slide
This is a website performance review template 1 ppt powerpoint presentation portfolio master slide. This is a five stage process. The stages in this process are traffic sources, site consumption trend, online transaction, average visit time, organic branded.

Product Performance And Profitability Report Unit Costs Sales And Revenues Analysis Ppt PowerPoint Presentation Model Show
This is a product performance and profitability report unit costs sales and revenues analysis ppt powerpoint presentation model show. This is a five stage process. The stages in this process are business unit profitability, profitable organization, corporate unit profitability.
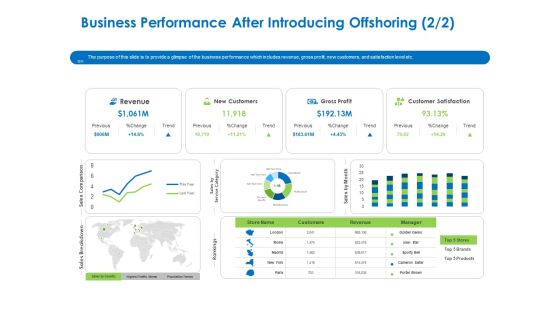
Relocation Of Business Process Offshoring Business Performance After Introducing Offshoring Revenue Download PDF
The purpose of this slide is to provide a glimpse of the business performance which includes revenue, gross profit, new customers, and satisfaction level etc. Deliver an awe-inspiring pitch with this creative relocation of business process offshoring business performance after introducing offshoring revenue download pdf bundle. Topics like revenue, new customers, gross profit, customer satisfaction can be discussed with this completely editable template. It is available for immediate download depending on the needs and requirements of the user.
Steps In M And A Process Manda Performance Tracker Icon Pictures PDF
Presenting steps in m and a process manda performance tracker icon pictures pdf to provide visual cues and insights. Share and navigate important information on five stages that need your due attention. This template can be used to pitch topics like m and a performance tracker. In addtion, this PPT design contains high resolution images, graphics, etc, that are easily editable and available for immediate download.

Purchase Assessment Process Impact Of Procurement Analysis On Company Performance Background PDF
This template covers impact of procurement audit on company performance showcasing reduction in shipping time, transportation cost and inventory turnover.Deliver an awe inspiring pitch with this creative Purchase Assessment Process Impact Of Procurement Analysis On Company Performance Background PDF bundle. Topics like Impact Of Logistics, Implementing Transportation, Transportation Costs can be discussed with this completely editable template. It is available for immediate download depending on the needs and requirements of the user.

Sales Process Automation For Revenue Growth Comparative Assessment Of Sales Performance With Competitors Rules PDF
This slide shows the comparative assessment of sales performance with competitors based on certain metrics such as lead qualification rate, marketing effectiveness, sales forecast accuracy, pipeline thickness, etc.Deliver an awe inspiring pitch with this creative Sales Process Automation For Revenue Growth Comparative Assessment Of Sales Performance With Competitors Rules PDF bundle. Topics like Multiple Channel, Accessibility, Inventory Tracking can be discussed with this completely editable template. It is available for immediate download depending on the needs and requirements of the user.

Effective Digital Marketing Audit Process Digital Media Marketing Performance Assessment Structure PDF
This slide highlights the digital media marketing performance assessment which highlights the different social media channels with visits, new users acquisition, avg session duration and bounce rate.Deliver an awe inspiring pitch with this creative Effective Digital Marketing Audit Process Digital Media Marketing Performance Assessment Structure PDF bundle. Topics like Average Session, Conversion Rate, Duration can be discussed with this completely editable template. It is available for immediate download depending on the needs and requirements of the user.

Sales Automation Procedure Impact Of Automation On Sales Performance Mockup PDF
This slide shows the impact of automation on sales performance such as increase in lead qualification rate, pipeline thickness, sales forecast accuracy and response rate after sales process automation. Deliver an awe inspiring pitch with this creative Sales Automation Procedure Impact Of Automation On Sales Performance Mockup PDF bundle. Topics like Before Automation, After Automation, Response Rate, Marketing Automation can be discussed with this completely editable template. It is available for immediate download depending on the needs and requirements of the user.
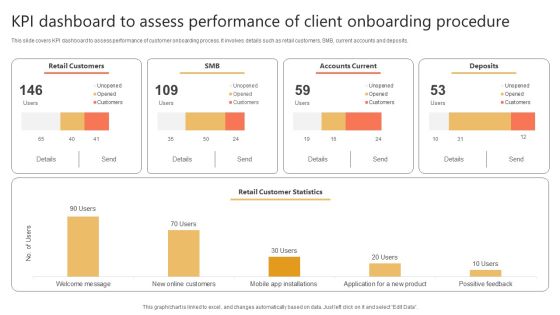
Kpi Dashboard To Assess Performance Of Client Onboarding Procedure Designs PDF
This slide covers KPI dashboard to assess performance of customer onboarding process. It involves details such as retail customers, SMB, current accounts and deposits. Showcasing this set of slides titled Kpi Dashboard To Assess Performance Of Client Onboarding Procedure Designs PDF. The topics addressed in these templates are Retail Customers, Accounts Current, Deposits. All the content presented in this PPT design is completely editable. Download it and make adjustments in color, background, font etc. as per your unique business setting.
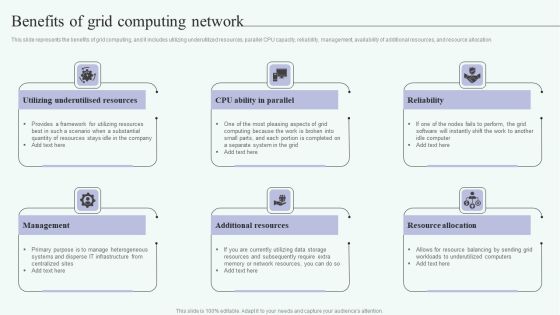
Grid Computing For High Performance Solutions Benefits Of Grid Computing Network Formats PDF
This slide represents the benefits of grid computing, and it includes utilizing underutilized resources, parallel CPU capacity, reliability, management, availability of additional resources, and resource allocation. Slidegeeks is one of the best resources for PowerPoint templates. You can download easily and regulate Grid Computing For High Performance Solutions Benefits Of Grid Computing Network Formats PDF for your personal presentations from our wonderful collection. A few clicks is all it takes to discover and get the most relevant and appropriate templates. Use our Templates to add a unique zing and appeal to your presentation and meetings. All the slides are easy to edit and you can use them even for advertisement purposes.

Analyzing Impact Of Performance Marketing Campaigns Ppt PowerPoint Presentation Diagram Images PDF
This slide showcases impact of performance marketing campaigns which can help organization to evaluate the effectiveness of executed plan. Its key elements are website traffic and product sales There are so many reasons you need a Analyzing Impact Of Performance Marketing Campaigns Ppt PowerPoint Presentation Diagram Images PDF. The first reason is you cannot spend time making everything from scratch, Thus, Slidegeeks has made presentation templates for you too. You can easily download these templates from our website easily.
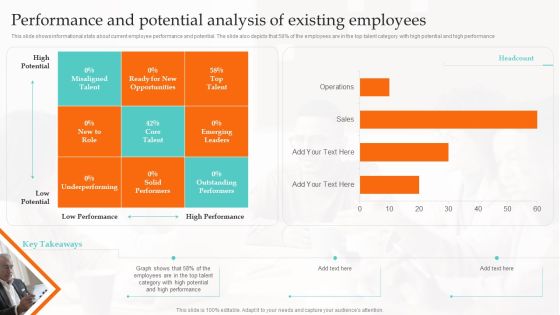
Performance And Potential Analysis Of Existing Ultimate Guide To Employee Succession Planning Designs PDF
This slide shows informational stats about current employee performance and potential. The slide also depicts that 58 precent of the employees are in the top talent category with high potential and high performance Do you have an important presentation coming up Are you looking for something that will make your presentation stand out from the rest Look no further than Performance And Potential Analysis Of Existing Ultimate Guide To Employee Succession Planning Designs PDF. With our professional designs, you can trust that your presentation will pop and make delivering it a smooth process. And with Slidegeeks, you can trust that your presentation will be unique and memorable. So why wait Grab Performance And Potential Analysis Of Existing Ultimate Guide To Employee Succession Planning Designs PDF today and make your presentation stand out from the rest.
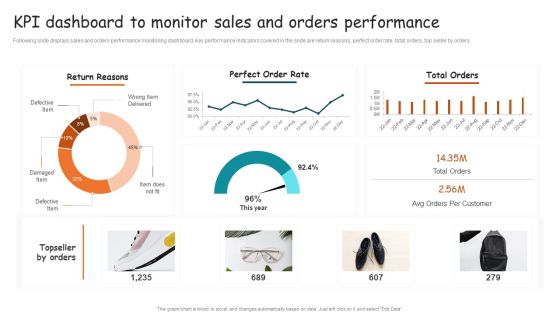
Guide For Brand Kpi Dashboard To Monitor Sales And Orders Performance Brochure PDF
Following slide displays sales and orders performance monitoring dashboard. Key performance indicators covered in the slide are return reasons, perfect order rate, total orders, top seller by orders. Do you have an important presentation coming up Are you looking for something that will make your presentation stand out from the rest Look no further than Guide For Brand Kpi Dashboard To Monitor Sales And Orders Performance Brochure PDF. With our professional designs, you can trust that your presentation will pop and make delivering it a smooth process. And with Slidegeeks, you can trust that your presentation will be unique and memorable. So why wait Grab Guide For Brand Kpi Dashboard To Monitor Sales And Orders Performance Brochure PDF today and make your presentation stand out from the rest.

Key Methods To Enhance Project Performance Ppt PowerPoint Presentation Gallery Portrait PDF
Presenting key methods to enhance project performance ppt powerpoint presentation gallery portrait pdf to dispense important information. This template comprises four stages. It also presents valuable insights into the topics including project performance, set clear objectives, plan and prioritize, communicate better, conquer first difficult tasks. This is a completely customizable PowerPoint theme that can be put to use immediately. So, download it and address the topic impactfully.
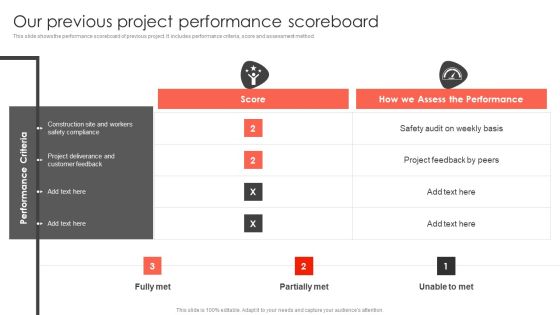
Our Previous Project Performance Scoreboard Construct Project Feasibility Analysis Report Sample PDF
This slide shows the performance scoreboard of previous project. It includes performance criteria, score and assessment method. Do you have an important presentation coming up Are you looking for something that will make your presentation stand out from the rest Look no further than Our Previous Project Performance Scoreboard Construct Project Feasibility Analysis Report Sample PDF. With our professional designs, you can trust that your presentation will pop and make delivering it a smooth process. And with Slidegeeks, you can trust that your presentation will be unique and memorable. So why wait Grab Our Previous Project Performance Scoreboard Construct Project Feasibility Analysis Report Sample PDF today and make your presentation stand out from the rest.

KPI Dashboard To Analyze In Store Merchandising Strategy Performance Introduction PDF
The following slide outlines a performance key performance indicator KPI dashboard used to evaluate the effectiveness of in-store merchandising strategy. The KPIs covered in the slide are total sales, average inventory, active stores, distinct products sold, etc. Formulating a presentation can take up a lot of effort and time, so the content and message should always be the primary focus. The visuals of the PowerPoint can enhance the presenters message, so our KPI Dashboard To Analyze In Store Merchandising Strategy Performance Introduction PDF was created to help save time. Instead of worrying about the design, the presenter can concentrate on the message while our designers work on creating the ideal templates for whatever situation is needed. Slidegeeks has experts for everything from amazing designs to valuable content, we have put everything into KPI Dashboard To Analyze In Store Merchandising Strategy Performance Introduction PDF.
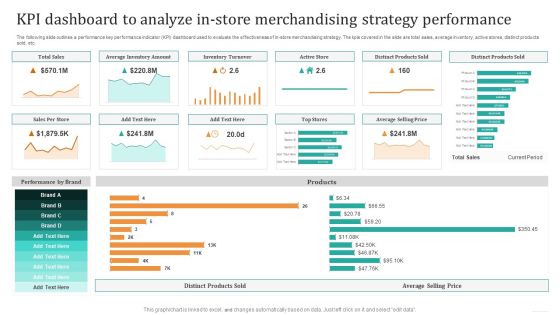
KPI Dashboard To Analyze In Store Merchandising Strategy Performance Pictures PDF
The following slide outlines a performance key performance indicator KPI dashboard used to evaluate the effectiveness of in-store merchandising strategy. The KPIs covered in the slide are total sales, average inventory, active stores, distinct products sold, etc. Formulating a presentation can take up a lot of effort and time, so the content and message should always be the primary focus. The visuals of the PowerPoint can enhance the presenters message, so our KPI Dashboard To Analyze In Store Merchandising Strategy Performance Pictures PDF was created to help save time. Instead of worrying about the design, the presenter can concentrate on the message while our designers work on creating the ideal templates for whatever situation is needed. Slidegeeks has experts for everything from amazing designs to valuable content, we have put everything into KPI Dashboard To Analyze In Store Merchandising Strategy Performance Pictures PDF.

Content Marketing Performance Template 1 Ppt PowerPoint Presentation Infographics Graphics Example
This is a content marketing performance template 1 ppt powerpoint presentation infographics graphics example. This is a eight stage process. The stages in this process are brand awareness, engagement, sales, lead generation, customer retention lead nurturing, upsell.
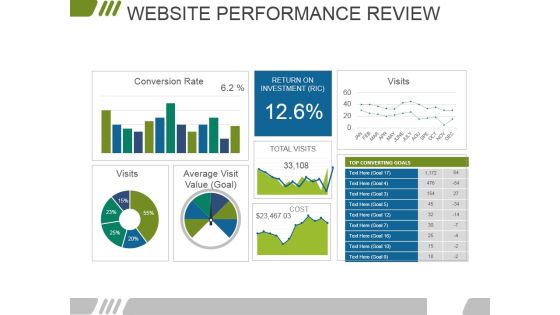
Website Performance Review Template 2 Ppt PowerPoint Presentation Infographics Background Designs
This is a website performance review template 2 ppt powerpoint presentation infographics background designs. This is a three stage process. The stages in this process are conversion rate, visits, return on investment, average visit value.
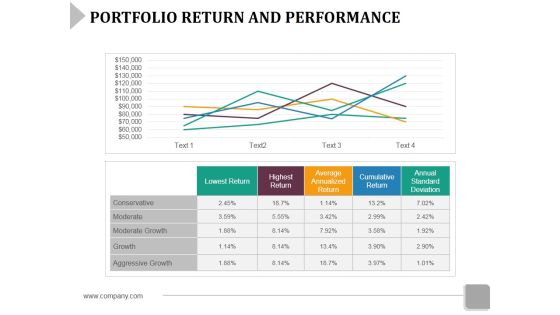
Portfolio Return And Performance Template 1 Ppt PowerPoint Presentation Layouts Mockup
This is a portfolio return and performance template 1 ppt powerpoint presentation layouts mockup. This is a five stage process. The stages in this process are conservative, moderate, moderate growth, lowest return.
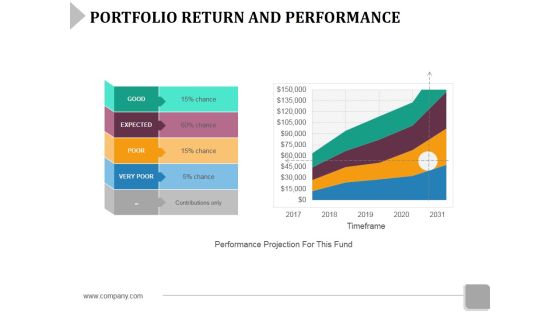
Portfolio Return And Performance Template 2 Ppt PowerPoint Presentation Summary Influencers
This is a portfolio return and performance template 2 ppt powerpoint presentation summary influencers. This is a four stage process. The stages in this process are good, expected, poor, very poor.
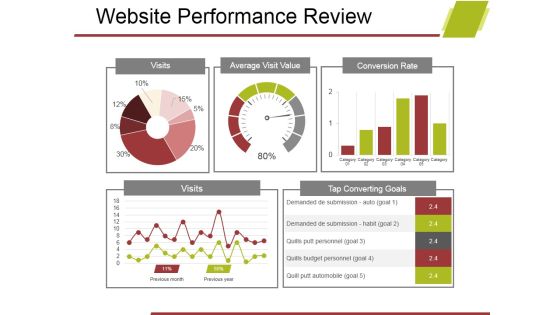
Website Performance Review Template 2 Ppt PowerPoint Presentation Model File Formats
This is a website performance review template 2 ppt powerpoint presentation model file formats. This is a five stage process. The stages in this process are visits, average visit value, conversion rate, visits, tap converting goals.

Portfolio Return And Performance Template 1 Ppt PowerPoint Presentation Pictures Show
This is a portfolio return and performance template 1 ppt powerpoint presentation pictures show. This is a four stage process. The stages in this process are good, expected, poor, very poor, chance.

Portfolio Return And Performance Template 2 Ppt PowerPoint Presentation Summary Example
This is a portfolio return and performance template 2 ppt powerpoint presentation summary example. This is a four stage process. The stages in this process are good, expected, poor, very poor, chance.

Portfolio Return And Performance Template 2 Ppt PowerPoint Presentation File Mockup
This is a portfolio return and performance template 2 ppt powerpoint presentation file mockup. This is a four stage process. The stages in this process are business, finance, marketing, strategy, analysis.

Content Marketing Performance Template 1 Ppt PowerPoint Presentation Infographic Template Brochure
This is a content marketing performance template 1 ppt powerpoint presentation infographic template brochure. This is a eight stage process. The stages in this process are business, finance, marketing, strategy, analysis.
Website Performance Review Template 2 Ppt PowerPoint Presentation Icon Master Slide
This is a website performance review template 2 ppt powerpoint presentation icon master slide. This is a three stage process. The stages in this process are cost, visits, conversion rate.

Brand Performance Dashboard Template 1 Ppt PowerPoint Presentation Infographic Template Vector
This is a brand performance dashboard template 1 ppt powerpoint presentation infographic template vector. This is a five stage process. The stages in this process are dashboard, measurement, analysis, strategy, business.

Brand Performance Dashboard Template 2 Ppt PowerPoint Presentation Show Designs Download
This is a brand performance dashboard template 2 ppt powerpoint presentation show designs download. This is a two stage process. The stages in this process are business, location, geography, information, strategy.

Customer Satisfaction And Performance Metrics Ppt PowerPoint Presentation Complete Deck With Slides
This is a customer satisfaction and performance metrics ppt powerpoint presentation complete deck with slides. This is a one stage process. The stages in this process are customer, service, marketing, planning, strategy.

Project Conclusion Report Performance Analysis Ppt PowerPoint Presentation Slides Design Templates
This is a project conclusion report performance analysis ppt powerpoint presentation slides design templates. This is a three stage process. The stages in this process are business, marketing, table, compare, analysis.
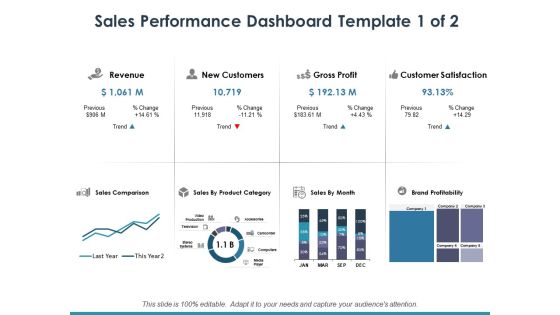
Sales Performance Dashboard Template 1 Ppt PowerPoint Presentation Infographic Template Maker
This is a sales performance dashboard template 1 ppt powerpoint presentation infographic template maker. This is a eight stage process. The stages in this process are dollar, business, finance, marketing.

Measuring Sales Performance And Productivity Ppt PowerPoint Presentation Infographic Template Sample
This is a measuring sales performance and productivity ppt powerpoint presentation infographic template sample. This is a eight stage process. The stages in this process are sales objectives, sales goal, achieving sales target.

Reaching Business Goals Performance Indicator Ppt PowerPoint Presentation Pictures Infographic Template
This is a reaching business goals performance indicator ppt powerpoint presentation pictures infographic template. This is a one stage process. The stages in this process are sales objectives, sales goal, achieving sales target.

Performance Gap Analysis Current And Future State Ppt PowerPoint Presentation Layouts Slide Download

Bar Chart For Business Performance Evaluation Ppt PowerPoint Presentation Infographics Professional
This is a bar chart for business performance evaluation ppt powerpoint presentation infographics professional. This is a five stage process. The stages in this process are metrics icon, kpis icon, statistics icon.

Recognize Great Employee Performance With A Handwritten Note Ppt PowerPoint Presentation Gallery Backgrounds
This is a recognize great employee performance with a handwritten note ppt powerpoint presentation gallery backgrounds. This is a two stage process. The stages in this process are recognize, encourage, innovation, planning, marketing, strategy.

Key Performance Indicator Analytics Dashboard Ppt PowerPoint Presentation Model Example Topics
This is a key performance indicator analytics dashboard ppt powerpoint presentation model example topics. This is a five stage process. The stages in this process are kpi proposal, kpi plan, kpi scheme.

Sales Goals And Performance Kpis Influence Position And Protection Ppt PowerPoint Presentation Styles Inspiration
This is a sales goals and performance kpis influence position and protection ppt powerpoint presentation styles inspiration. This is a three stage process. The stages in this process are kpi proposal, kpi plan, kpi scheme.

Bar Charts For Business Performance Analysis Ppt PowerPoint Presentation Show Slideshow
This is a bar charts for business performance analysis ppt powerpoint presentation show slideshow. This is a two stage process. The stages in this process are compare, comparison of two, competitive analysis.

Comparing Performance Of Two Business Sectors Ppt PowerPoint Presentation Layouts Design Templates
This is a comparing performance of two business sectors ppt powerpoint presentation layouts design templates. This is a five stage process. The stages in this process are compare, comparison of two, competitive analysis.
Four Points Performance Comparison Of Two Business Sectors Ppt PowerPoint Presentation Layouts Icons
This is a four points performance comparison of two business sectors ppt powerpoint presentation layouts icons. This is a four stage process. The stages in this process are compare, comparison of two, competitive analysis.
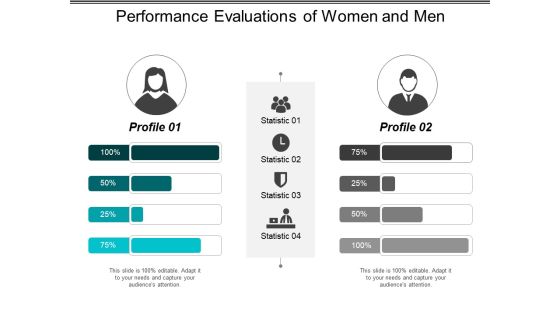
Performance Evaluations Of Women And Men Ppt PowerPoint Presentation File Design Ideas
This is a performance evaluations of women and men ppt powerpoint presentation file design ideas. This is a two stage process. The stages in this process are compare, comparison of two, competitive analysis.
Three Points Performance Comparison Of Two Business Sectors Ppt PowerPoint Presentation Icon Graphic Tips
This is a three points performance comparison of two business sectors ppt powerpoint presentation icon graphic tips. This is a three stage process. The stages in this process are compare, comparison of two, competitive analysis.
Pie Chart For Measuring Marketing Performance Ppt PowerPoint Presentation Icon Format
This is a pie chart for measuring marketing performance ppt powerpoint presentation icon format. This is a eight stage process. The stages in this process are b2b marketing strategy, b2b marketing plan, b2b marketing approach.
Financial Performance Report Vector Icon Ppt Powerpoint Presentation Pictures Background Image
This is a financial performance report vector icon ppt powerpoint presentation pictures background image. This is a four stage process. The stages in this process are financial statements icon, accounting ratio icon, balance sheet icon.

Product Competitive Analysis Feature And Performance Ppt Powerpoint Presentation Show Graphics Design
This is a product competitive analysis feature and performance ppt powerpoint presentation show graphics design. This is a five stage process. The stages in this process are competitive analysis, product differentiation, product competition.
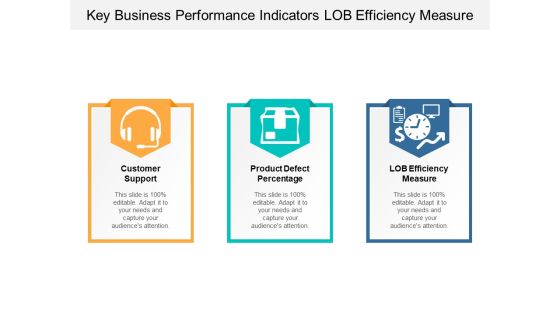
Key Business Performance Indicators Lob Efficiency Measure Ppt Powerpoint Presentation Infographics File Formats
This is a key business performance indicators lob efficiency measure ppt powerpoint presentation infographics file formats. This is a three stage process. The stages in this process are dashboard, kpi, metrics.
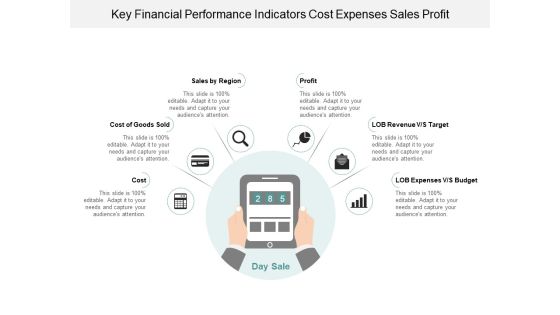
Key Financial Performance Indicators Cost Expenses Sales Profit Ppt Powerpoint Presentation Infographic Template Graphic Images
This is a key financial performance indicators cost expenses sales profit ppt powerpoint presentation infographic template graphic images. This is a six stage process. The stages in this process are dashboard, kpi, metrics.
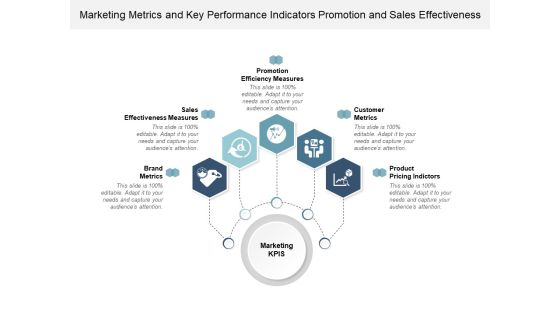
Marketing Metrics And Key Performance Indicators Promotion And Sales Effectiveness Ppt Powerpoint Presentation Infographics Graphics Example
This is a marketing metrics and key performance indicators promotion and sales effectiveness ppt powerpoint presentation infographics graphics example. This is a five stage process. The stages in this process are dashboard, kpi, metrics.
Performance Indicators Of Business Icons Ppt Powerpoint Presentation Infographics Graphics Template
This is a performance indicators of business icons ppt powerpoint presentation infographics graphics template. This is a four stage process. The stages in this process are dashboard, kpi, metrics.

Profitability Key Performance Indicators Financial Activities Cash Flow Ppt Powerpoint Presentation Portfolio Clipart Images
This is a profitability key performance indicators financial activities cash flow ppt powerpoint presentation portfolio clipart images. This is a five stage process. The stages in this process are dashboard, kpi, metrics.
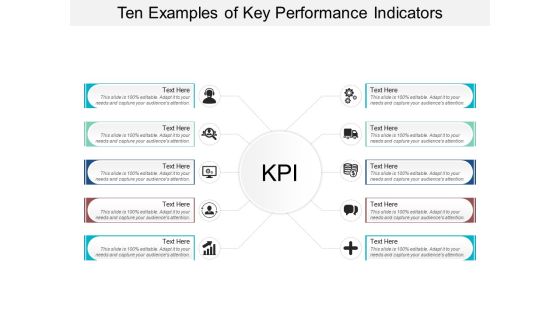
Ten Examples Of Key Performance Indicators Ppt Powerpoint Presentation Layouts Professional
This is a ten examples of key performance indicators ppt powerpoint presentation layouts professional. This is a ten stage process. The stages in this process are dashboard, kpi, metrics.

Online Business Strategy Market Research And Performance Analytics Ppt Powerpoint Presentation Infographics Images
This is a online business strategy market research and performance analytics ppt powerpoint presentation infographics images. This is a five stage process. The stages in this process are ecommerce, mercantilism, commercialism.
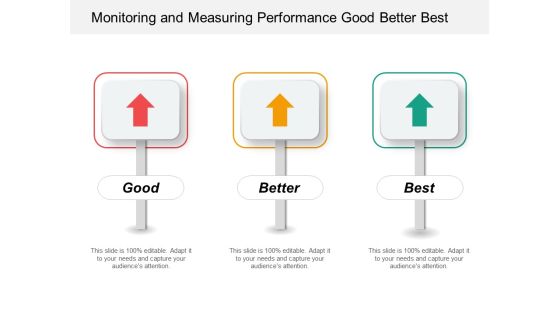
Monitoring And Measuring Performance Good Better Best Ppt Powerpoint Presentation Gallery Graphics
This is a monitoring and measuring performance good better best ppt powerpoint presentation gallery graphics. This is a three stage process. The stages in this process are good better best, good great superb, good great excellent.
 Home
Home