Performance Management Framework

Corporate Training Program Dashboard To Track Employee Performance Portrait PDF
This slide showcases dashboard that can help organization to track on job training program. Its key components are absenteeism rate, overtime hours, training duration and cost and overall labor effectiveness rate. Crafting an eye catching presentation has never been more straightforward. Let your presentation shine with this tasteful yet straightforward Corporate Training Program Dashboard To Track Employee Performance Portrait PDF template. It offers a minimalistic and classy look that is great for making a statement. The colors have been employed intelligently to add a bit of playfulness while still remaining professional. Construct the ideal Corporate Training Program Dashboard To Track Employee Performance Portrait PDF that effortlessly grabs the attention of your audience. Begin now and be certain to wow your customers.

Personnel Performance Kpis Scorecard To Identify Improvement Areas Diagrams PDF
Persuade your audience using this Personnel Performance Kpis Scorecard To Identify Improvement Areas Diagrams PDF. This PPT design covers five stages, thus making it a great tool to use. It also caters to a variety of topics including Employee Skills, Communication Skills, Leadership Skills. Download this PPT design now to present a convincing pitch that not only emphasizes the topic but also showcases your presentation skills.
Five Years Workforce Engagement Roadmap With Performance And Recognition Icons
Presenting our innovatively structured five years workforce engagement roadmap with performance and recognition icons Template. Showcase your roadmap process in different formats like PDF, PNG, and JPG by clicking the download button below. This PPT design is available in both Standard Screen and Widescreen aspect ratios. It can also be easily personalized and presented with modified font size, font type, color, and shapes to measure your progress in a clear way.

Five Years Product Performance Optimization Roadmap For Companies Professional
Presenting our innovatively structured five years product performance optimization roadmap for companies professional Template. Showcase your roadmap process in different formats like PDF, PNG, and JPG by clicking the download button below. This PPT design is available in both Standard Screen and Widescreen aspect ratios. It can also be easily personalized and presented with modified font size, font type, color, and shapes to measure your progress in a clear way.

Half Yearly Product Performance Optimization Roadmap For Companies Infographics
Presenting our innovatively structured half yearly product performance optimization roadmap for companies infographics Template. Showcase your roadmap process in different formats like PDF, PNG, and JPG by clicking the download button below. This PPT design is available in both Standard Screen and Widescreen aspect ratios. It can also be easily personalized and presented with modified font size, font type, color, and shapes to measure your progress in a clear way.

Quarterly Product Performance Optimization Roadmap For Companies Sample
Presenting our innovatively structured quarterly product performance optimization roadmap for companies sample Template. Showcase your roadmap process in different formats like PDF, PNG, and JPG by clicking the download button below. This PPT design is available in both Standard Screen and Widescreen aspect ratios. It can also be easily personalized and presented with modified font size, font type, color, and shapes to measure your progress in a clear way.
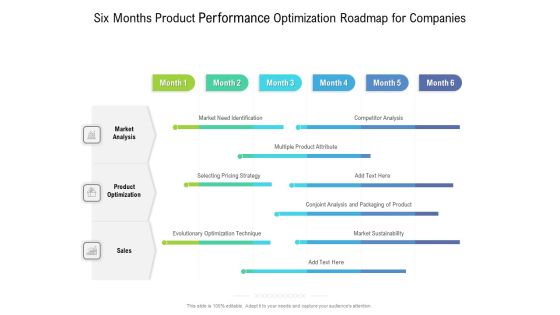
Six Months Product Performance Optimization Roadmap For Companies Sample
Presenting our innovatively structured six months product performance optimization roadmap for companies sample Template. Showcase your roadmap process in different formats like PDF, PNG, and JPG by clicking the download button below. This PPT design is available in both Standard Screen and Widescreen aspect ratios. It can also be easily personalized and presented with modified font size, font type, color, and shapes to measure your progress in a clear way.
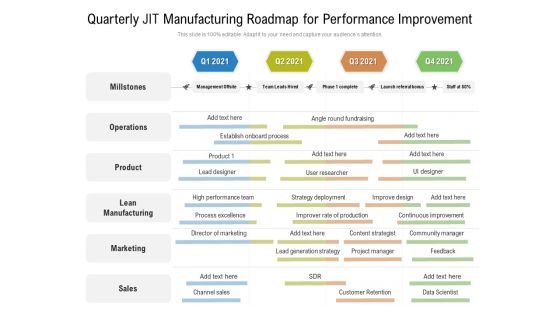
Quarterly JIT Manufacturing Roadmap For Performance Improvement Download
Presenting our innovatively-structured quarterly jit manufacturing roadmap for performance improvement download Template. Showcase your roadmap process in different formats like PDF, PNG, and JPG by clicking the download button below. This PPT design is available in both Standard Screen and Widescreen aspect ratios. It can also be easily personalized and presented with modified font size, font type, color, and shapes to measure your progress in a clear way.

Six Months JIT Manufacturing Roadmap For Performance Improvement Infographics
Presenting our innovatively-structured six months jit manufacturing roadmap for performance improvement infographics Template. Showcase your roadmap process in different formats like PDF, PNG, and JPG by clicking the download button below. This PPT design is available in both Standard Screen and Widescreen aspect ratios. It can also be easily personalized and presented with modified font size, font type, color, and shapes to measure your progress in a clear way.

Software Development Project Issues Performance Monitoring Dashboard Structure PDF
This slide represents the dashboard showing software development project issues faced by the clients for the purpose of its monitoring and controlling by the IT department. It shows downtime issues, count and percentage of unsolved tickets etc. related to the project.Showcasing this set of slides titled Software Development Project Issues Performance Monitoring Dashboard Structure PDF. The topics addressed in these templates are Downtime Issues, Count Percentage, Unsolved Percentage. All the content presented in this PPT design is completely editable. Download it and make adjustments in color, background, font etc. as per your unique business setting.

Estimated Campaign Performance Result Summary Ppt Slide PDF
The following slide depicts the forecasted campaign outcomes to assess potential earnings and spending. It includes key performance indicators such as monthly budget, cost per click, website traffic, conversion rate, average conversion value etc. Coming up with a presentation necessitates that the majority of the effort goes into the content and the message you intend to convey. The visuals of a PowerPoint presentation can only be effective if it supplements and supports the story that is being told. Keeping this in mind our experts created Estimated Campaign Performance Result Summary Ppt Slide PDF to reduce the time that goes into designing the presentation. This way, you can concentrate on the message while our designers take care of providing you with the right template for the situation.
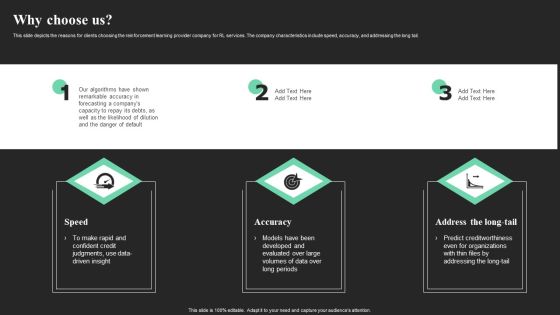
Why Choose Us Performance Optimization Through Reinforcement Learning Background PDF
This slide depicts the reasons for clients choosing the reinforcement learning provider company for RL services. The company characteristics include speed, accuracy, and addressing the long tail. Do you have an important presentation coming up Are you looking for something that will make your presentation stand out from the rest Look no further than Why Choose Us Performance Optimization Through Reinforcement Learning Background PDF. With our professional designs, you can trust that your presentation will pop and make delivering it a smooth process. And with Slidegeeks, you can trust that your presentation will be unique and memorable. So why wait Grab Why Choose Us Performance Optimization Through Reinforcement Learning Background PDF today and make your presentation stand out from the rest.

Procurement Dashboard To Measure Suppliers Performance Infographics PDF
This slide provides an overview of the procurement dashboard to determine vendors capacity for providing the right goods and services. The KPIs covered are defect rate, on-time supplies, supplier availability, delivery and lead time. This Procurement Dashboard To Measure Suppliers Performance Infographics PDF from Slidegeeks makes it easy to present information on your topic with precision. It provides customization options, so you can make changes to the colors, design, graphics, or any other component to create a unique layout. It is also available for immediate download, so you can begin using it right away. Slidegeeks has done good research to ensure that you have everything you need to make your presentation stand out. Make a name out there for a brilliant performance.

Distributor Risk And Performance Assessment Matrix Diagrams PDF
This slide showcases risk assessment matrix which helps business personnel to analyze credibility of various vendors. It provides information regarding order completeness, quality, compliance, cost and assessment.Showcasing this set of slides titled Distributor Risk And Performance Assessment Matrix Diagrams PDF. The topics addressed in these templates are Order Completeness, Quality Problems, Assessment. All the content presented in this PPT design is completely editable. Download it and make adjustments in color, background, font etc. as per your unique business setting.

Dashboard To Track Ecommerce Website Performance Summary PDF
This slide showcases dashboard that can help organization to track the performance of ecommerce website. Its key components are users by region, traffic sources, audience metrics over time, mobile users etc. Do you know about Slidesgeeks Dashboard To Track Ecommerce Website Performance Summary PDF These are perfect for delivering any kind od presentation. Using it, create PowerPoint presentations that communicate your ideas and engage audiences. Save time and effort by using our pre designed presentation templates that are perfect for a wide range of topic. Our vast selection of designs covers a range of styles, from creative to business, and are all highly customizable and easy to edit. Download as a PowerPoint template or use them as Google Slides themes.

Product Engineering Performance And Development Metrics Dashboard Topics PDF
This slide covers product engineering and development KPI dashboard to improve effectiveness. It involves data such as product development team, average result area scores and key result areas. Showcasing this set of slides titled Product Engineering Performance And Development Metrics Dashboard Topics PDF. The topics addressed in these templates are Product Development Team, Average, Cost. All the content presented in this PPT design is completely editable. Download it and make adjustments in color, background, font etc. as per your unique business setting.
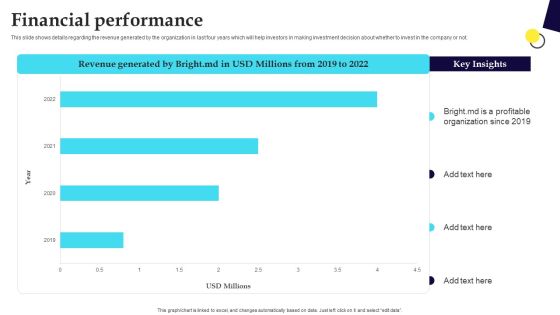
Digital Healthcare Platform Fundraising Pitch Deck Financial Performance Clipart PDF
This slide shows details regarding the revenue generated by the organization in last four years which will help investors in making investment decision about whether to invest in the company or not. Explore a selection of the finest Digital Healthcare Platform Fundraising Pitch Deck Financial Performance Clipart PDF here. With a plethora of professionally designed and pre made slide templates, you can quickly and easily find the right one for your upcoming presentation. You can use our Digital Healthcare Platform Fundraising Pitch Deck Financial Performance Clipart PDF to effectively convey your message to a wider audience. Slidegeeks has done a lot of research before preparing these presentation templates. The content can be personalized and the slides are highly editable. Grab templates today from Slidegeeks.

Performance Impact Of Providing Training To Sales Representatives Download PDF
The following slide analyze sales representatives performance after providing training to measure productivity. It includes KPIs such as Voicemail and email, Call , touch frequency over time, prospecting, follow ups, appointment set, qualified leads and proposal send. This Performance Impact Of Providing Training To Sales Representatives Download PDF is perfect for any presentation, be it in front of clients or colleagues. It is a versatile and stylish solution for organizing your meetings. The product features a modern design for your presentation meetings. The adjustable and customizable slides provide unlimited possibilities for acing up your presentation. Slidegeeks has done all the homework before launching the product for you. So, do not wait, grab the presentation templates today
Performance Impact Of Providing Training To Sales Representatives Microsoft PDF
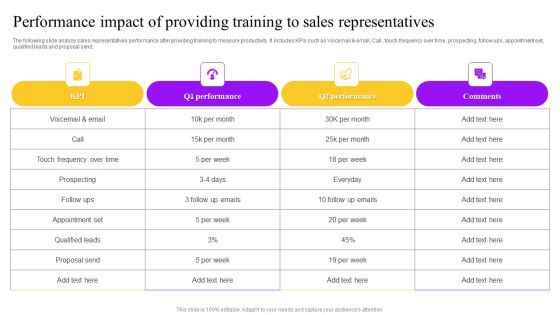
The following slide analyze sales representatives performance after providing training to measure productivity. It includes KPIs such as Voicemail and email, Call , touch frequency over time, prospecting, follow ups, appointment set, qualified leads and proposal send. This Performance Impact Of Providing Training To Sales Representatives Microsoft PDF is perfect for any presentation, be it in front of clients or colleagues. It is a versatile and stylish solution for organizing your meetings. The product features a modern design for your presentation meetings. The adjustable and customizable slides provide unlimited possibilities for acing up your presentation. Slidegeeks has done all the homework before launching the product for you. So, do not wait, grab the presentation templates today

Annual Financial Key Performance Indicators After RPA Guidelines PDF
This slide covers annual financial indicators of organization after the implementation of automation. It includes gross margin, return on sales, equity ratio, dynamic gearing, changes in unit sales, operating profit, inventory turnover, return on equity before tax, etc. Create an editable Annual Financial Key Performance Indicators After RPA Guidelines PDF that communicates your idea and engages your audience. Whether you are presenting a business or an educational presentation, pre-designed presentation templates help save time. Annual Financial Key Performance Indicators After RPA Guidelines PDF is highly customizable and very easy to edit, covering many different styles from creative to business presentations. Slidegeeks has creative team members who have crafted amazing templates. So, go and get them without any delay.
Improving Corporate Performance Percent Change In Workplace Productivity Inspiration PDF
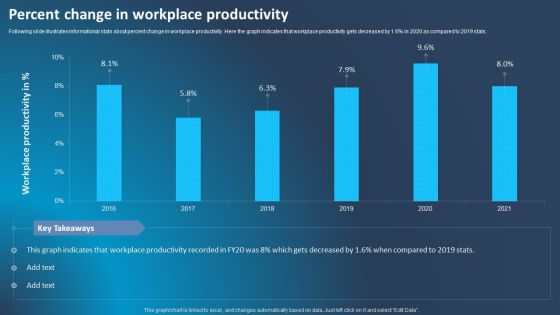
Following slide illustrates informational stats about percent change in workplace productivity. Here the graph indicates that workplace productivity gets decreased by 1.6 percent in 2020 as compared to 2019 stats. Formulating a presentation can take up a lot of effort and time, so the content and message should always be the primary focus. The visuals of the PowerPoint can enhance the presenters message, so our Improving Corporate Performance Percent Change In Workplace Productivity Inspiration PDF was created to help save time. Instead of worrying about the design, the presenter can concentrate on the message while our designers work on creating the ideal templates for whatever situation is needed. Slidegeeks has experts for everything from amazing designs to valuable content, we have put everything into Improving Corporate Performance Percent Change In Workplace Productivity Inspiration PDF.
Quarterly Workforce Engagement Roadmap With Performance And Recognition Formats
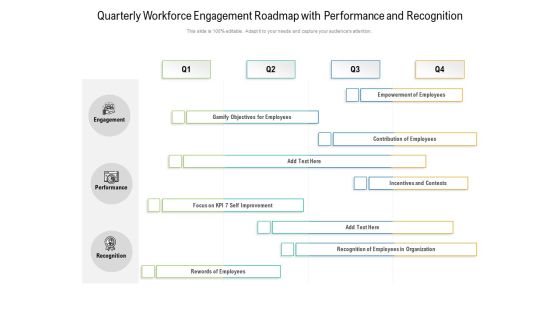
Presenting our jaw dropping quarterly workforce engagement roadmap with performance and recognition formats. You can alternate the color, font size, font type, and shapes of this PPT layout according to your strategic process. This PPT presentation is compatible with Google Slides and is available in both standard screen and widescreen aspect ratios. You can also download this well researched PowerPoint template design in different formats like PDF, JPG, and PNG. So utilize this visually appealing design by clicking the download button given below.

Five Years Timeline Roadmap For Product Performance Optimization Download
Presenting our jaw dropping five years timeline roadmap for product performance optimization download. You can alternate the color, font size, font type, and shapes of this PPT layout according to your strategic process. This PPT presentation is compatible with Google Slides and is available in both standard screen and widescreen aspect ratios. You can also download this well researched PowerPoint template design in different formats like PDF, JPG, and PNG. So utilize this visually appealing design by clicking the download button given below.
Half Yearly Timeline Roadmap For Product Performance Optimization Mockup
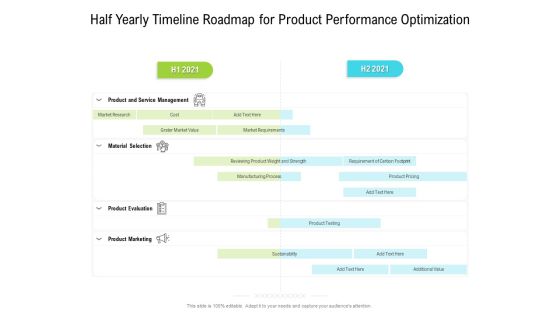
Presenting our jaw dropping half yearly timeline roadmap for product performance optimization mockup. You can alternate the color, font size, font type, and shapes of this PPT layout according to your strategic process. This PPT presentation is compatible with Google Slides and is available in both standard screen and widescreen aspect ratios. You can also download this well researched PowerPoint template design in different formats like PDF, JPG, and PNG. So utilize this visually appealing design by clicking the download button given below.
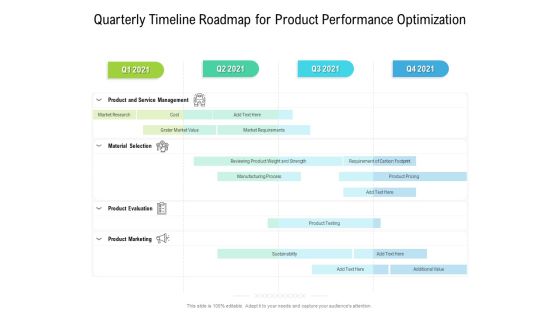
Quarterly Timeline Roadmap For Product Performance Optimization Portrait
Presenting our jaw dropping quarterly timeline roadmap for product performance optimization portrait. You can alternate the color, font size, font type, and shapes of this PPT layout according to your strategic process. This PPT presentation is compatible with Google Slides and is available in both standard screen and widescreen aspect ratios. You can also download this well researched PowerPoint template design in different formats like PDF, JPG, and PNG. So utilize this visually appealing design by clicking the download button given below.
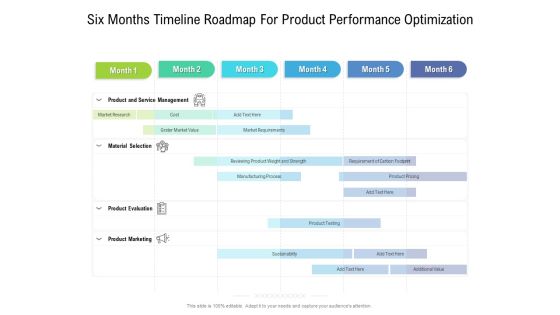
Six Months Timeline Roadmap For Product Performance Optimization Portrait
Presenting our jaw dropping six months timeline roadmap for product performance optimization portrait. You can alternate the color, font size, font type, and shapes of this PPT layout according to your strategic process. This PPT presentation is compatible with Google Slides and is available in both standard screen and widescreen aspect ratios. You can also download this well researched PowerPoint template design in different formats like PDF, JPG, and PNG. So utilize this visually appealing design by clicking the download button given below.

Three Months Timeline Roadmap For Product Performance Optimization Download
Presenting our jaw dropping three months timeline roadmap for product performance optimization download. You can alternate the color, font size, font type, and shapes of this PPT layout according to your strategic process. This PPT presentation is compatible with Google Slides and is available in both standard screen and widescreen aspect ratios. You can also download this well researched PowerPoint template design in different formats like PDF, JPG, and PNG. So utilize this visually appealing design by clicking the download button given below.
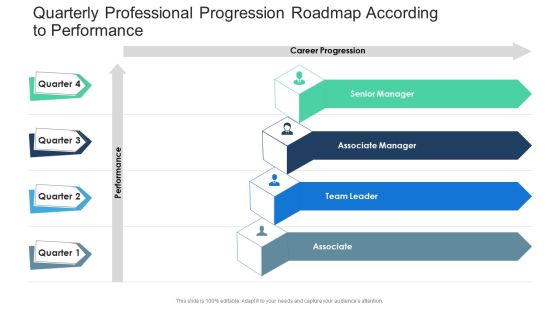
Quarterly Professional Progression Roadmap According To Performance Formats
Presenting our jaw dropping quarterly professional progression roadmap according to performance formats. You can alternate the color, font size, font type, and shapes of this PPT layout according to your strategic process. This PPT presentation is compatible with Google Slides and is available in both standard screen and widescreen aspect ratios. You can also download this well researched PowerPoint template design in different formats like PDF, JPG, and PNG. So utilize this visually appealing design by clicking the download button given below.

Six Months Professional Progression Roadmap According To Performance Rules
Presenting our jaw dropping six months professional progression roadmap according to performance rules. You can alternate the color, font size, font type, and shapes of this PPT layout according to your strategic process. This PPT presentation is compatible with Google Slides and is available in both standard screen and widescreen aspect ratios. You can also download this well researched PowerPoint template design in different formats like PDF, JPG, and PNG. So utilize this visually appealing design by clicking the download button given below.
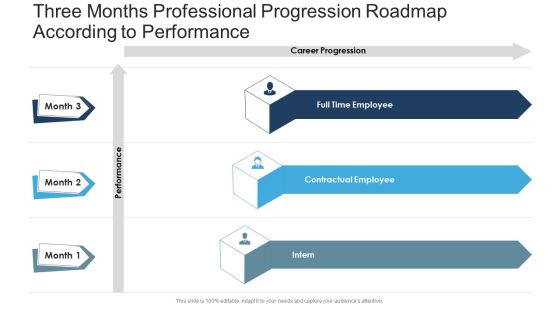
Three Months Professional Progression Roadmap According To Performance Portrait
Presenting our jaw dropping three months professional progression roadmap according to performance portrait. You can alternate the color, font size, font type, and shapes of this PPT layout according to your strategic process. This PPT presentation is compatible with Google Slides and is available in both standard screen and widescreen aspect ratios. You can also download this well researched PowerPoint template design in different formats like PDF, JPG, and PNG. So utilize this visually appealing design by clicking the download button given below.
Technology Improvement Project Performance Tracking Dashboard Ppt Icon Backgrounds PDF
This slide shows the dashboard of technology advancement project. It includes overview, status, budget, risks, working days etc. Showcasing this set of slides titled Technology Improvement Project Performance Tracking Dashboard Ppt Icon Backgrounds PDF. The topics addressed in these templates are Overall Progress, Planning, Design. All the content presented in this PPT design is completely editable. Download it and make adjustments in color, background, font etc. as per your unique business setting.

KPI Dashboard To Track Brand Performance Information PDF
Mentioned slide showcases KPI dashboard that can be used to check the financial performance of a brand. Metrics covered in the dashboard are return on assets, working capital ratio, return on equity etc. Do you know about Slidesgeeks KPI Dashboard To Track Brand Performance Information PDF These are perfect for delivering any kind od presentation. Using it, create PowerPoint presentations that communicate your ideas and engage audiences. Save time and effort by using our pre designed presentation templates that are perfect for a wide range of topic. Our vast selection of designs covers a range of styles, from creative to business, and are all highly customizable and easy to edit. Download as a PowerPoint template or use them as Google Slides themes.

Company Financials Performance Comparison Of Company Financials Formats PDF
This slide shows the comparison of revenue generated by an organization on company basis in two financial years. Pitch your topic with ease and precision using this Company Financials Performance Comparison Of Company Financials Formats PDF. This layout presents information on Manufacturing Cost, Introduction Customer, Loyalty Programs. It is also available for immediate download and adjustment. So, changes can be made in the color, design, graphics or any other component to create a unique layout.

Three Months Workforce Engagement Roadmap With Performance And Recognition Information
Introducing our three months workforce engagement roadmap with performance and recognition information. This PPT presentation is Google Slides compatible, therefore, you can share it easily with the collaborators for measuring the progress. Also, the presentation is available in both standard screen and widescreen aspect ratios. So edit the template design by modifying the font size, font type, color, and shapes as per your requirements. As this PPT design is fully editable it can be presented in PDF, JPG and PNG formats.

Five Yearly Continuous Performance Measurement And Enhancement Roadmap Summary
Introducing our five yearly continuous performance measurement and enhancement roadmap summary. This PPT presentation is Google Slides compatible, therefore, you can share it easily with the collaborators for measuring the progress. Also, the presentation is available in both standard screen and widescreen aspect ratios. So edit the template design by modifying the font size, font type, color, and shapes as per your requirements. As this PPT design is fully editable it can be presented in PDF, JPG and PNG formats.
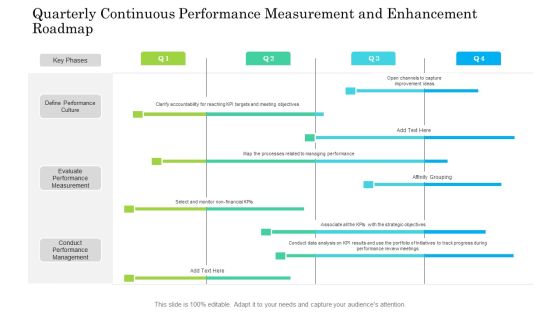
Quarterly Continuous Performance Measurement And Enhancement Roadmap Professional
Introducing our quarterly continuous performance measurement and enhancement roadmap professional. This PPT presentation is Google Slides compatible, therefore, you can share it easily with the collaborators for measuring the progress. Also, the presentation is available in both standard screen and widescreen aspect ratios. So edit the template design by modifying the font size, font type, color, and shapes as per your requirements. As this PPT design is fully editable it can be presented in PDF, JPG and PNG formats.

Six Months Continuous Performance Measurement And Enhancement Roadmap Slides
Introducing our six months continuous performance measurement and enhancement roadmap slides. This PPT presentation is Google Slides compatible, therefore, you can share it easily with the collaborators for measuring the progress. Also, the presentation is available in both standard screen and widescreen aspect ratios. So edit the template design by modifying the font size, font type, color, and shapes as per your requirements. As this PPT design is fully editable it can be presented in PDF, JPG and PNG formats.

Three Months Continuous Performance Measurement And Enhancement Roadmap Brochure
Introducing our three months continuous performance measurement and enhancement roadmap brochure. This PPT presentation is Google Slides compatible, therefore, you can share it easily with the collaborators for measuring the progress. Also, the presentation is available in both standard screen and widescreen aspect ratios. So edit the template design by modifying the font size, font type, color, and shapes as per your requirements. As this PPT design is fully editable it can be presented in PDF, JPG and PNG formats.

Five Year Professional Progression Roadmap According To Performance Portrait
Introducing our five year professional progression roadmap according to performance portrait. This PPT presentation is Google Slides compatible, therefore, you can share it easily with the collaborators for measuring the progress. Also, the presentation is available in both standard screen and widescreen aspect ratios. So edit the template design by modifying the font size, font type, color, and shapes as per your requirements. As this PPT design is fully editable it can be presented in PDF, JPG and PNG formats.

Employee Productivity Performance Increment Rating Factors Slides PDF
The slide shows various rating factors and assessments of employee productivity. These factors includes developing realistic goals, meet targets, work efficiency, etc. Pitch your topic with ease and precision using this Employee Productivity Performance Increment Rating Factors Slides PDF. This layout presents information on Develop Realistic Goals, Meets Targets, Works Efficiently. It is also available for immediate download and adjustment. So, changes can be made in the color, design, graphics or any other component to create a unique layout.

3 Major Areas Influencing Employee Performance Sample PDF
This slide presents a table discussing key factors that influence employee performances that can assist organizations in identifying potential flaws in employee training program and advising on how to improve. It includes training and development, employee engagement and company culture. Showcasing this set of slides titled 3 Major Areas Influencing Employee Performance Sample PDF. The topics addressed in these templates are Training Development, Employee Engagement, Company Culture. All the content presented in this PPT design is completely editable. Download it and make adjustments in color, background, font etc. as per your unique business setting.

Dashboard To Track Several Projects Performance By Firm Template PDF
This slide provides information regarding the dashboard which will help team in tracking different activities associated to multiple projects by monitoring resources, tasks status, bugs and features closed, etc. Do you have an important presentation coming up Are you looking for something that will make your presentation stand out from the rest Look no further than Dashboard To Track Several Projects Performance By Firm Template PDF. With our professional designs, you can trust that your presentation will pop and make delivering it a smooth process. And with Slidegeeks, you can trust that your presentation will be unique and memorable. So why wait Grab Dashboard To Track Several Projects Performance By Firm Template PDF today and make your presentation stand out from the rest.

Set Goals And Performance Evaluation Metrics Ppt Professional Master Slide
The following slide showcases key goals and assessment metrics for influencer marketing campaign to streamline efforts and ensure success. It includes elements such as number of sales generated, followers, engagement rate, number of shares, reach etc. Do you have an important presentation coming up Are you looking for something that will make your presentation stand out from the rest Look no further than Set Goals And Performance Evaluation Metrics Ppt Professional Master Slide. With our professional designs, you can trust that your presentation will pop and make delivering it a smooth process. And with Slidegeeks, you can trust that your presentation will be unique and memorable. So why wait Grab Set Goals And Performance Evaluation Metrics Ppt Professional Master Slide today and make your presentation stand out from the rest
Cash Performance Highlights With Turnover Rate Ppt Ideas Icon PDF
This graph or chart is linked to excel, and changes automatically based on data. Just left click on it and select Edit Data. Pitch your topic with ease and precision using this Cash Performance Highlights With Turnover Rate Ppt Ideas Icon PDF. This layout presents information on Working Capital, Cash Balance, Current Ratio. It is also available for immediate download and adjustment. So, changes can be made in the color, design, graphics or any other component to create a unique layout.

Current Scenario Highlighting Financial Performance Insights Demonstration PDF
This slide showcases overview of current financial scenario to give brief idea about unfavorable KPIs. It provides details about net profit margins, debt to equity ratio, financial process efficiency, etc. Want to ace your presentation in front of a live audience Our Current Scenario Highlighting Financial Performance Insights Demonstration PDF can help you do that by engaging all the users towards you.. Slidegeeks experts have put their efforts and expertise into creating these impeccable powerpoint presentations so that you can communicate your ideas clearly. Moreover, all the templates are customizable, and easy-to-edit and downloadable. Use these for both personal and commercial use.
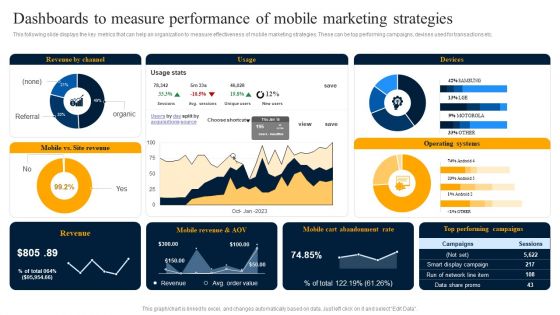
Dashboards To Measure Performance Of Mobile Marketing Strategies Rules PDF
This following slide displays the key metrics that can help an organization to measure effectiveness of mobile marketing strategies. These can be top performing campaigns, devises used for transactions etc. If your project calls for a presentation, then Slidegeeks is your go to partner because we have professionally designed, easy to edit templates that are perfect for any presentation. After downloading, you can easily edit Dashboards To Measure Performance Of Mobile Marketing Strategies Rules PDF and make the changes accordingly. You can rearrange slides or fill them with different images. Check out all the handy templates.

Cyber Security Key Performance Indicators Metrics Dashboard Mockup PDF
This slide covers cyber security health status dashboard . It also includes audit and compliance, controls health, project status, incident response process, vulnerability patching schedule, investigation process and training compliance. Pitch your topic with ease and precision using this Cyber Security Key Performance Indicators Metrics Dashboard Mockup PDF. This layout presents information on Cyber Security, Vulnerability Patching Schedule, Compliance Investigation Process. It is also available for immediate download and adjustment. So, changes can be made in the color, design, graphics or any other component to create a unique layout.

Infrastructure Visibility Into Application Server Performance Dashboard Structure PDF
This slide covers the dashboard which can be used to monitor server applications and business transactions of the organization. Coming up with a presentation necessitates that the majority of the effort goes into the content and the message you intend to convey. The visuals of a PowerPoint presentation can only be effective if it supplements and supports the story that is being told. Keeping this in mind our experts created Infrastructure Visibility Into Application Server Performance Dashboard Structure PDF to reduce the time that goes into designing the presentation. This way, you can concentrate on the message while our designers take care of providing you with the right template for the situation.

Business Turnabout Strategy Structuring For Performance Analysis Brochure PDF
This slide covers plan for understanding business situation to gain competitive edge. It also includes drafting rehabilitation plan, coordination of related parties, execution, monitoring turnaround plan.Persuade your audience using this Business Turnabout Strategy Structuring For Performance Analysis Brochure PDF. This PPT design covers six stages, thus making it a great tool to use. It also caters to a variety of topics including Business Situation, Drafting The Turnaround, Execution And Monitoring. Download this PPT design now to present a convincing pitch that not only emphasizes the topic but also showcases your presentation skills.
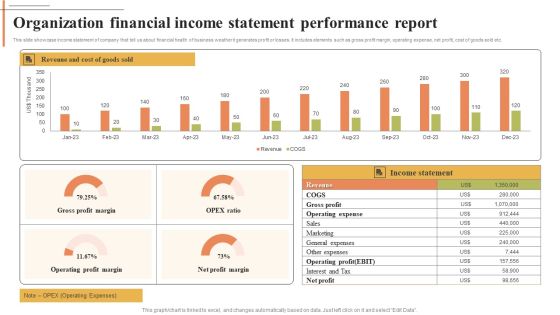
Organization Financial Income Statement Performance Report Structure PDF
This slide showcase income statement of company that tell us about financial health of business weather it generates profit or losses. It includes elements such as gross profit margin, operating expense, net profit, cost of goods sold etc. Showcasing this set of slides titled Organization Financial Income Statement Performance Report Structure PDF. The topics addressed in these templates are Gross Profit Margin, OPEX Ratio, Net Profit Margin. All the content presented in this PPT design is completely editable. Download it and make adjustments in color, background, font etc. as per your unique business setting.
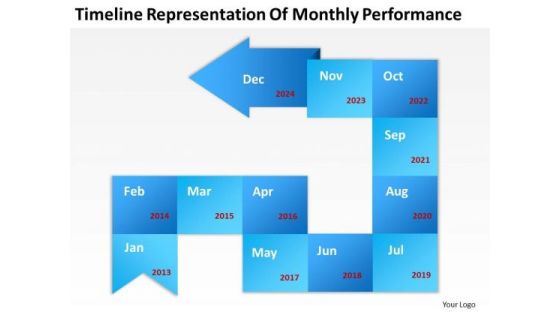
Business Strategy Diagram Timeline Representation Of Monthly Performance PowerPoint Slides
We present our business strategy diagram timeline representation of monthly performance PowerPoint Slides.Use our Arrows PowerPoint Templates because It can Leverage your style with our PowerPoint Templates and Slides. Charm your audience with your ability. Download our Flow Charts PowerPoint Templates because Our PowerPoint Templates and Slides are created by a hardworking bunch of busybees. Always flitting around with solutions gauranteed to please. Download and present our Business PowerPoint Templates because Our PowerPoint Templates and Slides help you pinpoint your timelines. Highlight the reasons for your deadlines with their use. Download and present our Boxes PowerPoint Templates because You can Be the star of the show with our PowerPoint Templates and Slides. Rock the stage with your ideas. Present our Process and Flows PowerPoint Templates because Our PowerPoint Templates and Slides will provide you a launch platform. Give a lift off to your ideas and send them into orbit.Use these PowerPoint slides for presentations relating to Abstract, background, blank, box, bright, business, chart, color, colorful, company, creative, design, diagram, element, fire, form, forum, graph, graphic, illustration, management, marketing, network, option, organization, plan, presentation, process, round, segment, shape, sphere, steps, template, text, top list, variations, web . The prominent colors used in the PowerPoint template are Blue, Red, White.

Measuring Training And Development Program Key Performance Indicators Template PDF
The purpose of this slide is to showcase certain KPIs to measure the effectiveness of a training and development program. The specific measuring criteria include training skill assessment, recognizing change, employee engagement and training feedback. Persuade your audience using this Measuring Training And Development Program Key Performance Indicators Template PDF. This PPT design covers five stages, thus making it a great tool to use. It also caters to a variety of topics including Training Skill Assessment, Recognizing Change, Employee Engagement. Download this PPT design now to present a convincing pitch that not only emphasizes the topic but also showcases your presentation skills.

Table Of Contents For Staff Performance Evaluation Process Topics PDF
Slidegeeks has constructed Table Of Contents For Staff Performance Evaluation Process Topics PDF after conducting extensive research and examination. These presentation templates are constantly being generated and modified based on user preferences and critiques from editors. Here, you will find the most attractive templates for a range of purposes while taking into account ratings and remarks from users regarding the content. This is an excellent jumping off point to explore our content and will give new users an insight into our top notch PowerPoint Templates.
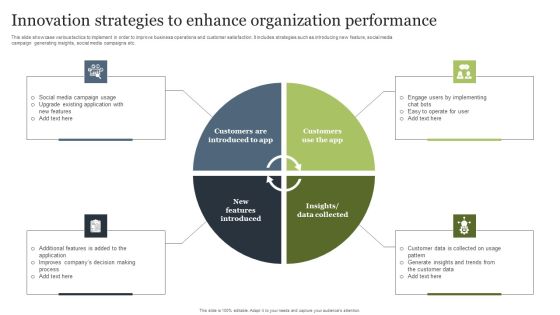
Innovation Strategies To Enhance Organization Performance Diagrams PDF
This slide showcase various tactics to implement in order to improve business operations and customer satisfaction. It includes strategies such as introducing new feature, social media campaign generating insights, social media campaigns etc. Presenting Innovation Strategies To Enhance Organization Performance Diagrams PDF to dispense important information. This template comprises four stages. It also presents valuable insights into the topics including Social Media Campaign, Additional Features, Customer Data. This is a completely customizable PowerPoint theme that can be put to use immediately. So, download it and address the topic impactfully.

Responsive Web Design Audit With Performance Scores Template PDF
This slide highlights the responsive web design audit which includes the flexible layouts, image and videos, media queries and touchscreen screen elements for audit.Presenting Responsive Web Design Audit With Performance Scores Template PDF to provide visual cues and insights. Share and navigate important information on one stage that need your due attention. This template can be used to pitch topics like Flexible Layouts, Images And Videos, Media Queries. In addtion, this PPT design contains high resolution images, graphics, etc, that are easily editable and available for immediate download.
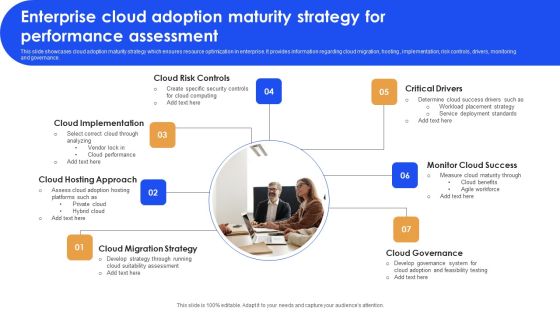
Enterprise Cloud Adoption Maturity Strategy For Performance Assessment Portrait PDF
This slide showcases cloud adoption maturity strategy which ensures resource optimization in enterprise. It provides information regarding cloud migration, hosting , implementation, risk controls, drivers, monitoring and governance. Presenting Enterprise Cloud Adoption Maturity Strategy For Performance Assessment Portrait PDF to dispense important information. This template comprises seven stages. It also presents valuable insights into the topics including Cloud Hosting Approach, Critical Drivers, Cloud Governance. This is a completely customizable PowerPoint theme that can be put to use immediately. So, download it and address the topic impactfully.
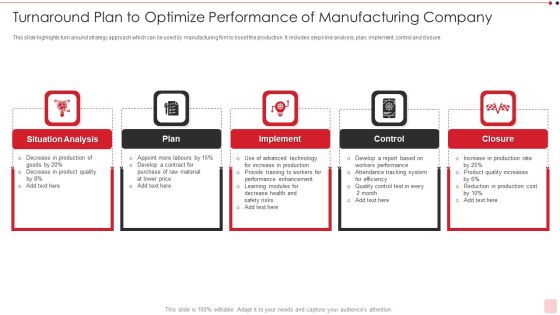
Turnaround Plan To Optimize Performance Of Manufacturing Company Ideas PDF
This slide highlights turn around strategy approach which can be used by manufacturing firm to boost the production. It includes steps like analysis, plan, implement, control and closure Persuade your audience using this turnaround plan to optimize performance of manufacturing company ideas pdf This PPT design covers five stages, thus making it a great tool to use. It also caters to a variety of topics including situation analysis, implement, attendance tracking system Download this PPT design now to present a convincing pitch that not only emphasizes the topic but also showcases your presentation skills.

Impact Of Poor Risk Analysis On Sales Performance Template PDF
The following slide depicts the influence of inappropriate risk assessment on annual sales to review and control threats within the organization. It includes monthly sales amount along with key insights etc. If your project calls for a presentation, then Slidegeeks is your go to partner because we have professionally designed, easy to edit templates that are perfect for any presentation. After downloading, you can easily edit Impact Of Poor Risk Analysis On Sales Performance Template PDF and make the changes accordingly. You can rearrange slides or fill them with different images. Check out all the handy templates.
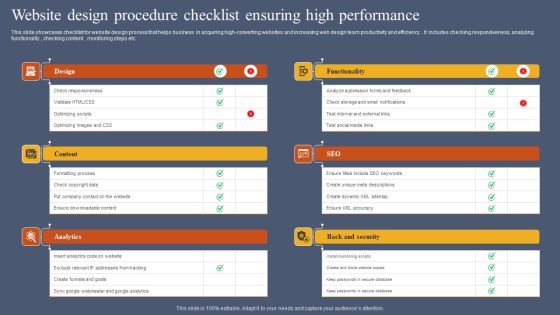
Website Design Procedure Checklist Ensuring High Performance Slides PDF
This slide showcases checklist for website design process that helps business in acquiring high-converting websites and increasing web design team productivity and efficiency . It includes checking responsiveness, analyzing functionality , checking content , monitoring steps etc. Persuade your audience using this Website Design Procedure Checklist Ensuring High Performance Slides PDF. This PPT design covers six stages, thus making it a great tool to use. It also caters to a variety of topics including Design, Content, Analytics. Download this PPT design now to present a convincing pitch that not only emphasizes the topic but also showcases your presentation skills.

Construction Project Engineering Performance Metrics Dashboard Ideas PDF
This slide covers construction project engineering KPI dashboard to analyse work status. It involves KPIs such as work status, projects by stage, completion percentage of projects, utilized duration, budget variance and workload. Showcasing this set of slides titled Construction Project Engineering Performance Metrics Dashboard Ideas PDF. The topics addressed in these templates are Budget Variance, Resource, Project. All the content presented in this PPT design is completely editable. Download it and make adjustments in color, background, font etc. as per your unique business setting.

 Home
Home