Performance Goals
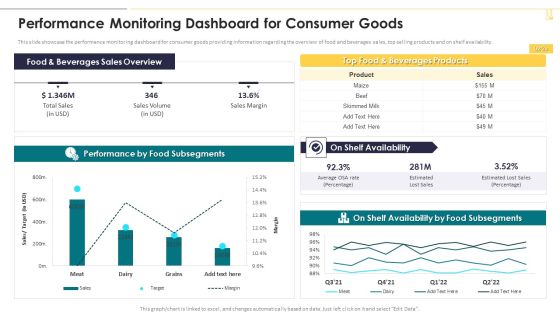
Performance Monitoring Dashboard For Consumer Goods Themes PDF
This slide showcase the performance monitoring dashboard for consumer goods providing information regarding the overview of food and beverages sales, top selling products and on shelf availability. Deliver an awe inspiring pitch with this creative Performance Monitoring Dashboard For Consumer Goods Themes PDF bundle. Topics like Beverages Sales Overview, Beverages Products, Availability can be discussed with this completely editable template. It is available for immediate download depending on the needs and requirements of the user.

Inculcating Supplier Operation Improvement Plan Business Performance Analysis Rules PDF
Following slide illustrate current performance analysis of the firm. It illustrates the target score and actual score achieved by the firm in various parameters. Deliver an awe inspiring pitch with this creative inculcating supplier operation improvement plan business performance analysis rules pdf bundle. Topics like analysis, management, software systems can be discussed with this completely editable template. It is available for immediate download depending on the needs and requirements of the user.
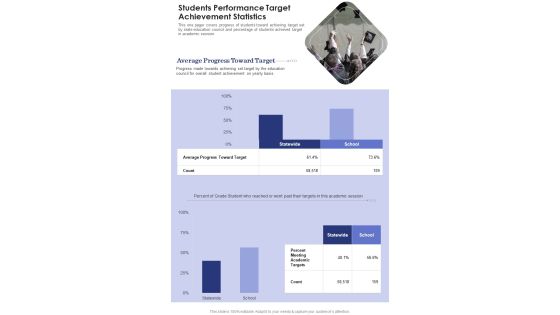
Students Performance Target Achievement Statistics One Pager Documents
This one pager covers progress of students toward achieving target set by state education council and percentage of students achieved target in academic session. Presenting you an exemplary Students Performance Target Achievement Statistics One Pager Documents. Our one-pager comprises all the must-have essentials of an inclusive document. You can edit it with ease, as its layout is completely editable. With such freedom, you can tweak its design and other elements to your requirements. Download this Students Performance Target Achievement Statistics One Pager Documents brilliant piece now.

Structure For Product Performance Through Feedback Formats PDF
This slide illustrates the product performance structure through feedback. It includes stages such as the concept stage, development stage, production stage, etc. Presenting Structure For Product Performance Through Feedback Formats PDF to dispense important information. This template comprises five stages. It also presents valuable insights into the topics including Production Stage, Development Stage, Retirement Stage. This is a completely customizable PowerPoint theme that can be put to use immediately. So, download it and address the topic impactfully.

Checklist For Auditing Employee Productivity Performance Enhancement Plan Infographics PDF
This slide delineates checklist for monitoring employee productivity improvement plan . It includes information about rating elements, performance standards, amount of work, time management, multitasking and work organization. Showcasing this set of slides titled Checklist For Auditing Employee Productivity Performance Enhancement Plan Infographics PDF. The topics addressed in these templates are Productivity, Management, Team. All the content presented in this PPT design is completely editable. Download it and make adjustments in color, background, font etc. as per your unique business setting.
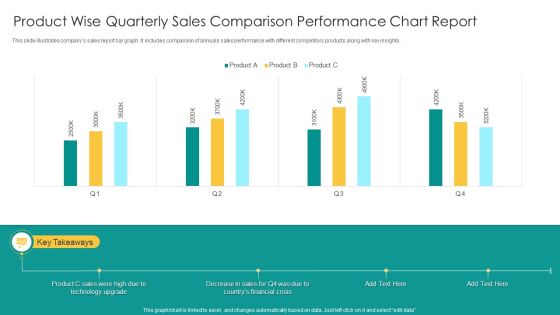
Product Wise Quarterly Sales Comparison Performance Chart Report Infographics PDF
This slide illustrates companys sales report bar graph. It includes comparison of annuals sales performance with different competitors products along with key insights. Showcasing this set of slides titled Product Wise Quarterly Sales Comparison Performance Chart Report Infographics PDF. The topics addressed in these templates are Product C Sales, Technology Upgrade, Financial Crisis. All the content presented in this PPT design is completely editable. Download it and make adjustments in color, background, font etc. as per your unique business setting.
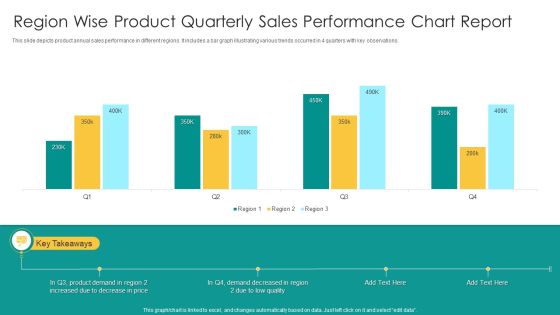
Region Wise Product Quarterly Sales Performance Chart Report Topics PDF
This slide depicts product annual sales performance in different regions. It includes a bar graph illustrating various trends occurred in 4 quarters with key observations. Showcasing this set of slides titled Region Wise Product Quarterly Sales Performance Chart Report Topics PDF. The topics addressed in these templates are Product Demand, Price, Low Quality. All the content presented in this PPT design is completely editable. Download it and make adjustments in color, background, font etc. as per your unique business setting.
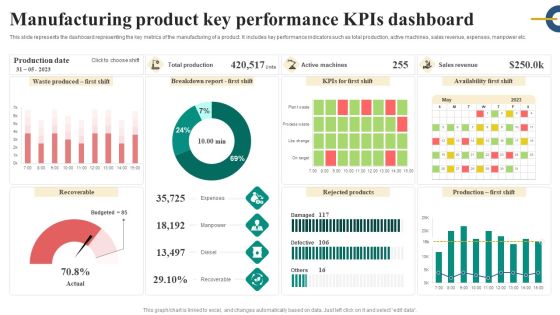
Manufacturing Product Key Performance Kpis Dashboard Inspiration PDF
This slide represents the dashboard representing the key metrics of the manufacturing of a product. It includes key performance indicators such as total production, active machines, sales revenue, expenses, manpower etc. Showcasing this set of slides titled Manufacturing Product Key Performance Kpis Dashboard Inspiration PDF. The topics addressed in these templates are Expenses, Manpower, Diesel, Recoverable. All the content presented in this PPT design is completely editable. Download it and make adjustments in color, background, font etc. as per your unique business setting.
New Product Performance Evaluation Dashboard Icon Ppt Infographics Sample PDF
Persuade your audience using this New Product Performance Evaluation Dashboard Icon Ppt Infographics Sample PDF. This PPT design covers three stages, thus making it a great tool to use. It also caters to a variety of topics including New Product, Performance Evaluation, Dashboard Icon. Download this PPT design now to present a convincing pitch that not only emphasizes the topic but also showcases your presentation skills.

Dashboard For Innovative Product Concept Performance In Market Formats PDF
This slide represents dashboard for innovative product performance in market. It includes usage intention, willingness to pay, purchase intention etc. Pitch your topic with ease and precision using this Dashboard For Innovative Product Concept Performance In Market Formats PDF This layout presents information on Usage Intention, Willingess To Pay, Purchase Intention . It is also available for immediate download and adjustment. So, changes can be made in the color, design, graphics or any other component to create a unique layout.

Employee Performance Management Cycle To Enhance Productivity Guidelines PDF
This slide covers employee performance management cycle to improve processes and enhancing staff productivity. It highlights three stages such as planning, monitoring, reviewing and rewarding. There are so many reasons you need a Employee Performance Management Cycle To Enhance Productivity Guidelines PDF. The first reason is you can not spend time making everything from scratch, Thus, Slidegeeks has made presentation templates for you too. You can easily download these templates from our website easily.
Measuring Product Performance Using Client Health Score Icon Graphics PDF
Persuade your audience using this Measuring Product Performance Using Client Health Score Icon Graphics PDF. This PPT design covers four stages, thus making it a great tool to use. It also caters to a variety of topics including Measuring Product Performance, Using Client Health, Score Icon. Download this PPT design now to present a convincing pitch that not only emphasizes the topic but also showcases your presentation skills.

Business Framework Key Performance Indicators Of A Company PowerPoint Presentation
Our above diagram provides framework of key performance indicators for a company. This slide contains human hand drawing some objects for terms like innovation strategy, research, solution, management and leadership. Download this diagram to make professional presentations.
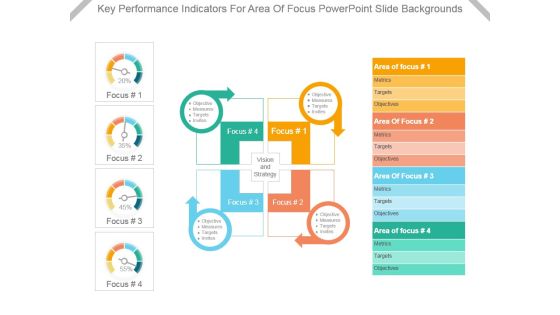
Key Performance Indicators For Area Of Focus Powerpoint Slide Backgrounds
This is a key performance indicators for area of focus powerpoint slide backgrounds. This is a four stage process. The stages in this process are area of focus, metrics, targets, objectives, focus, measures, invites, vision and strategy.

Key Performance Indicators Pie Chart Powerpoint Slide Ideas
This is a key performance indicators pie chart powerpoint slide ideas. This is a four stage process. The stages in this process are focus, objectives, measures, targets, invites, vision and strategy, area of focus.
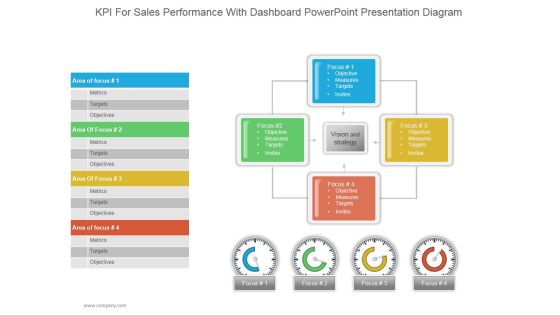
Kpi For Sales Performance With Dashboard Ppt PowerPoint Presentation Information
This is a kpi kpi for sales performance with dashboard ppt powerpoint presentation information. This is a four stage process. The stages in this process are metrics, targets, objectives, measures, targets, invites.

Key Performance Indicators Template 3 Ppt PowerPoint Presentation Graphics
This is a key performance indicators template 3 ppt powerpoint presentation graphics. This is a four stage process. The stages in this process are objective, measures, targets, invites, vision and strategy.

Key Performance Indicators Template 2 Ppt PowerPoint Presentation Model Example
This is a key performance indicators template 2 ppt powerpoint presentation model example. This is a four stage process. The stages in this process are objective, measures, targets, invites, indicators.

Key Performance Indicators Template 2 Ppt PowerPoint Presentation Layouts Portfolio
This is a key performance indicators template 2 ppt powerpoint presentation layouts portfolio. This is a four stage process. The stages in this process are objective, measures, targets, invites.

Key Performance Indicators Template 1 Ppt PowerPoint Presentation Pictures Templates
This is a key performance indicators template 1 ppt powerpoint presentation pictures templates. This is a four stage process. The stages in this process are objective, area of focus, measures, targets, invites.

Cargo Logistics Company Profile Our Delivery Performance Themes PDF
This slide highlights the logistics company delivery performance which includes order value for low value items and high value items with on time delivery statistics. Deliver an awe inspiring pitch with this creative Cargo Logistics Company Profile Our Delivery Performance Themes PDF bundle. Topics like Order Value, On Time Delivery can be discussed with this completely editable template. It is available for immediate download depending on the needs and requirements of the user.

Evaluating Projected Vs Actual Sales Performance Microsoft PDF
The following slide depicts the evaluation of existing sales performance to set future standards and determine opportunities for improvement. It mainly includes key performance indicators KPIs such as pipeline, forecast, attainment, gap etc. Get a simple yet stunning designed Evaluating Projected Vs Actual Sales Performance Microsoft PDF. It is the best one to establish the tone in your meetings. It is an excellent way to make your presentations highly effective. So, download this PPT today from Slidegeeks and see the positive impacts. Our easy to edit Evaluating Projected Vs Actual Sales Performance Microsoft PDF can be your go to option for all upcoming conferences and meetings. So, what are you waiting for Grab this template today.

Media Performance Indicator Evaluation Process Ppt Background Designs
This is a media performance indicator evaluation process ppt background designs. This is a three stage process. The stages in this process are traffic, engagement, conversion, website visitors, high value actions, video views, purchases, installs, sign ups.

Media Kpis Performance Evaluation Process Powerpoint Slide Backgrounds
This is a media kpis performance evaluation process powerpoint slide backgrounds. This is a three stage process. The stages in this process are traffic, engagement, conversion, purchases, installs, sign ups, video views, high value actions, website visitors.
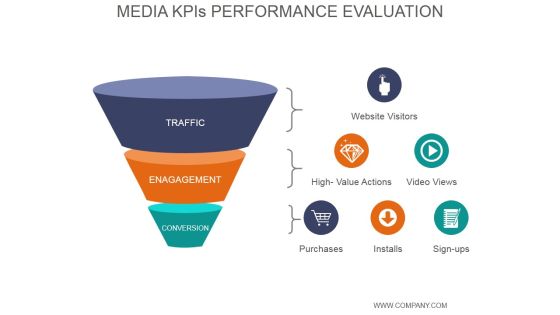
Media Kpis Performance Evaluation Ppt PowerPoint Presentation Tips
This is a media kpis performance evaluation ppt powerpoint presentation tips. This is a three stage process. The stages in this process are traffic, engagement, conversion, purchases, installs, sign ups, high value actions, video views, website visitors.

Media Kpis Performance Evaluation Ppt PowerPoint Presentation Topics
This is a media kpis performance evaluation ppt powerpoint presentation topics. This is a three stage process. The stages in this process are traffic, engagement, conversion, website, visitors, high value actions, video views, purchases, installs, sign ups.

Website Performance Review Template 2 Ppt PowerPoint Presentation Infographics Vector
This is a website performance review template 2 ppt powerpoint presentation infographics vector. This is a three stage process. The stages in this process are conversion rate, return on investment, visits, average visit value, total visits.
Media Kpis Performance Evaluation Ppt PowerPoint Presentation Professional Demonstration
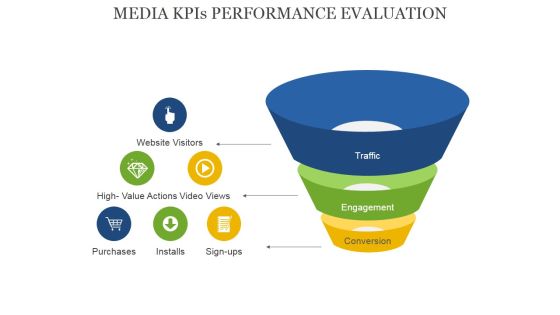
This is a media kpis performance evaluation ppt powerpoint presentation professional demonstration. This is a three stage process. The stages in this process are website visitors, high value actions, purchases, installs, sign ups, conversion.

Performance Sales Report For Apparel Industry Portrait PDF
The slide highlights a status report of apparel industry to summarize sales activities of different products. Different products included are jeans, tops, jackets, sportswear, pants and sweaters. Pitch your topic with ease and precision using this Performance Sales Report For Apparel Industry Portrait PDF. This layout presents information on Performance Sales Report, Apparel Industry. It is also available for immediate download and adjustment. So, changes can be made in the color, design, graphics or any other component to create a unique layout.

Corporate Bonus Payouts And Performance Incentives Dashboard Mockup PDF
This slide illustrates facts and figures related to performance bonus in a corporation. It includes total monthly payouts, eligible employee payout, target achievement analysis etc. Pitch your topic with ease and precision using this Corporate Bonus Payouts And Performance Incentives Dashboard Mockup PDF. This layout presents information on Monthly Payouts, Employee Payout, Average Employee. It is also available for immediate download and adjustment. So, changes can be made in the color, design, graphics or any other component to create a unique layout.
Impact Analysis Of Vendors Performance Improvement Contd Rules PDF
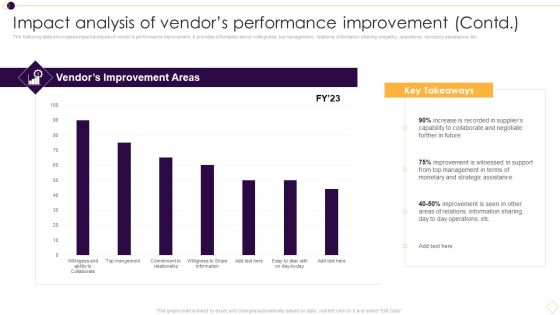
The following slide showcases impact analysis of vendors performance improvement. It provides information about willingness, top management, relations, information sharing, empathy, operations, monetary assistance, etc. Deliver and pitch your topic in the best possible manner with this Impact Analysis Of Vendors Performance Improvement Contd Rules PDF. Use them to share invaluable insights on Improvement Witnessed, Strategic Assistance Areas Relations and impress your audience. This template can be altered and modified as per your expectations. So, grab it now.
Metric Dashboard For Portfolio Evaluation And Performance Monitoring Themes PDF
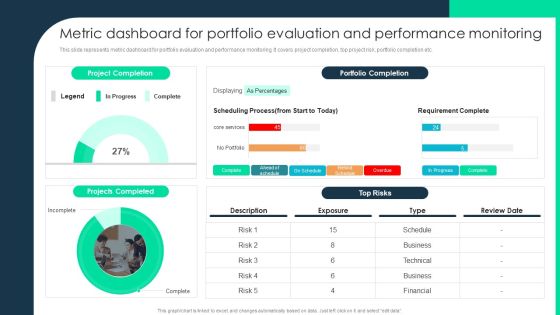
This slide represents metric dashboard for portfolio evaluation and performance monitoring. It covers project completion, top project risk, portfolio completion etc. Deliver an awe inspiring pitch with this creative Metric Dashboard For Portfolio Evaluation And Performance Monitoring Themes PDF bundle. Topics like Projects Completed, Portfolio Completion, Requirement Complete can be discussed with this completely editable template. It is available for immediate download depending on the needs and requirements of the user.

Metric Dashboard For Portfolio Evaluation And Performance Monitoring Introduction PDF
This slide represents metric dashboard for portfolio evaluation and performance monitoring. It covers project completion, top project risk, portfolio completion etc. Deliver and pitch your topic in the best possible manner with this Metric Dashboard For Portfolio Evaluation And Performance Monitoring Introduction PDF. Use them to share invaluable insights on Portfolio Completion, Requirement Complete, Business and impress your audience. This template can be altered and modified as per your expectations. So, grab it now.

Comparative Assessment Of Sales Team Performance Ppt Pictures Portrait PDF
This slide showcases comparative assessment of sales team performance of our business and competitors. It analyze performance on the basis of elements such as lead conversion rate, monthly sales growth, customer lifetime value, average conversion time , monthly calls and emails per representative, etc. Here you can discover an assortment of the finest PowerPoint and Google Slides templates. With these templates, you can create presentations for a variety of purposes while simultaneously providing your audience with an eye catching visual experience. Download Comparative Assessment Of Sales Team Performance Ppt Pictures Portrait PDF to deliver an impeccable presentation. These templates will make your job of preparing presentations much quicker, yet still, maintain a high level of quality. Slidegeeks has experienced researchers who prepare these templates and write high quality content for you. Later on, you can personalize the content by editing the Comparative Assessment Of Sales Team Performance Ppt Pictures Portrait PDF.

YASHBIZ Marketing Business Profile Team Performance Incentive Plan Rules PDF
This slide highlights the royalty income incentive plan of Yashbiz marketing which includes team performance incentive layout with level 1 to 20 incentive slab. Deliver an awe inspiring pitch with this creative YASHBIZ Marketing Business Profile Team Performance Incentive Plan Rules PDF bundle. Topics like Point Value, Customers, Products can be discussed with this completely editable template. It is available for immediate download depending on the needs and requirements of the user.
Work From Home Performance Management Dashboard Icons PDF
The following slide outlines a comprehensive key performance indicator KPI dashboard that can be used to showcase employees performance during work from home WFH. Information covered in this slide is related to average result area scores etc. Do you have to make sure that everyone on your team knows about any specific topic. I yes, then you should give Work From Home Performance Management Dashboard Icons PDF a try. Our experts have put a lot of knowledge and effort into creating this impeccable Work From Home Performance Management Dashboard Icons PDF. You can use this template for your upcoming presentations, as the slides are perfect to represent even the tiniest detail. You can download these templates from the Slidegeeks website and these are easy to edit. So grab these today.
Successful Account Oriented Marketing Techniques Overall Performance Improvement Pictures PDF
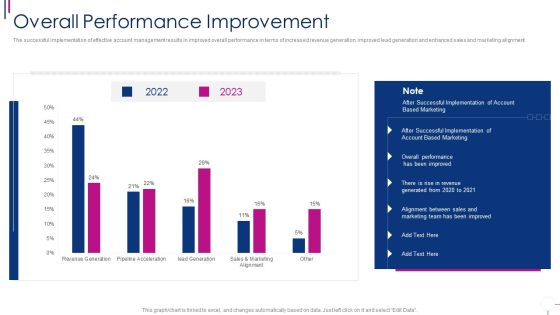
The successful implementation of effective account management results in improved overall performance in terms of increased revenue generation, improved lead generation and enhanced sales and marketing alignment. Deliver and pitch your topic in the best possible manner with this successful account oriented marketing techniques overall performance improvement pictures pdf. Use them to share invaluable insights on revenue, marketing, sales, implementation and impress your audience. This template can be altered and modified as per your expectations. So, grab it now.
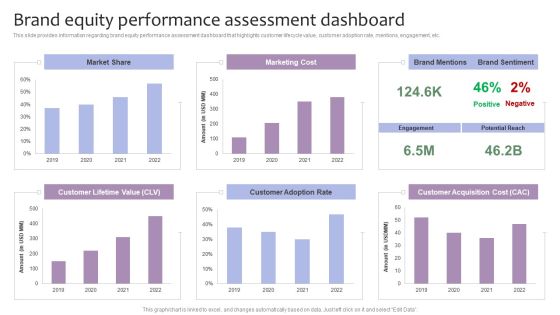
Strategic Brand Management Brand Equity Performance Assessment Dashboard Infographics PDF
This slide provides information regarding brand equity performance assessment dashboard that highlights customer lifecycle value, customer adoption rate, mentions, engagement, etc. Deliver and pitch your topic in the best possible manner with this Strategic Brand Management Brand Equity Performance Assessment Dashboard Infographics PDF. Use them to share invaluable insights on Market Share, Marketing Cost, Customer Lifetime Value, Customer Adoption Rate and impress your audience. This template can be altered and modified as per your expectations. So, grab it now.

Sales Kpi Performance Summary Ppt PowerPoint Presentation Infographic Template Elements
This is a sales kpi performance summary ppt powerpoint presentation infographic template elements. This is a seven stage process. The stages in this process are revenue comparison, quantity comparison, product sales mix, regional sales mix, budget.
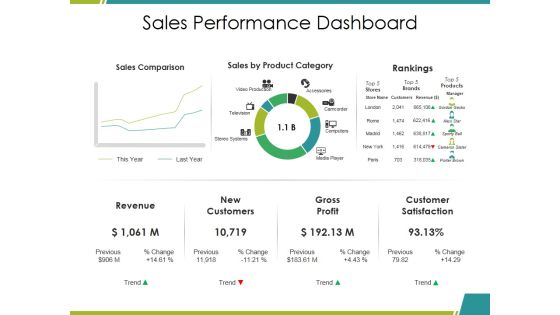
Sales Performance Dashboard Ppt PowerPoint Presentation Infographics Mockup
This is a sales performance dashboard ppt powerpoint presentation infographics mockup. This is a three stage process. The stages in this process are sales comparison, sales by product category, rankings, revenue, gross profit.

Sales Performance Dashboard Ppt PowerPoint Presentation Gallery Background
This is a sales performance dashboard ppt powerpoint presentation gallery backgroun. This is a six stage process. The stages in this process are sales comparison, sales by product category, rankings, revenue, new customers.
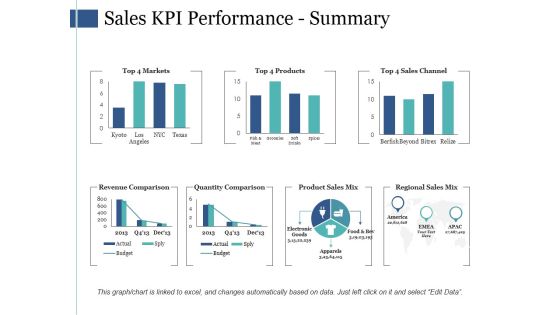
Sales Kpi Performance Summary Ppt PowerPoint Presentation Infographic Template Infographics
This is a sales kpi performance summary ppt powerpoint presentation infographic template infographics. This is a seven stage process. The stages in this process are revenue comparison, quantity comparison, product sales mix, regional sales mix.

Sales Kpi Performance Summary Ppt PowerPoint Presentation Ideas Graphics Template
This is a sales kpi performance summary ppt powerpoint presentation ideas graphics template. This is a seven stage process. The stages in this process are revenue comparison, quantity comparison, product sales mix, regional sales mix.

Sales Kpi Performance Summary Ppt PowerPoint Presentation Show Inspiration
This is a sales kpi performance summary ppt powerpoint presentation show inspiration. This is a two stage process. The stages in this process are revenue comparison, quantity comparison, product sales mix, regional sales mix, budget.

Business Performance Ppt PowerPoint Presentation Professional Visual Aids
This is a business performance ppt powerpoint presentation professional visual aids. This is a four stage process. The stages in this process are business, business highlights, financial summary, revenue split by geography, revenue split by products segment.
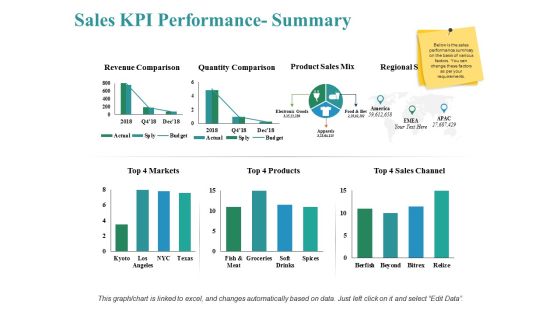
Sales Kpi Performance Summary Ppt PowerPoint Presentation Show Themes
This is a sales kpi performance summary ppt powerpoint presentation show themes. This is a three stage process. The stages in this process are revenue comparison, quantity comparison, product sales mix, markets, sales channel.
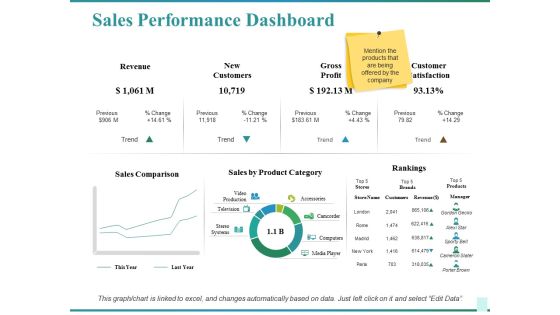
Sales Performance Dashboard Ppt PowerPoint Presentation Show Graphics Design
This is a sales performance dashboard ppt powerpoint presentation show graphics design. This is a two stage process. The stages in this process are sales comparison, sales by product category, rankings, customer satisfaction, revenue.

Performance Evaluation Parameters Ppt PowerPoint Presentation Ideas Inspiration
This is a performance evaluation parameters ppt powerpoint presentation ideas inspiration. This is a two stage process. The stages in this process are dependability, productivity, service rating, evaluation item, personality.
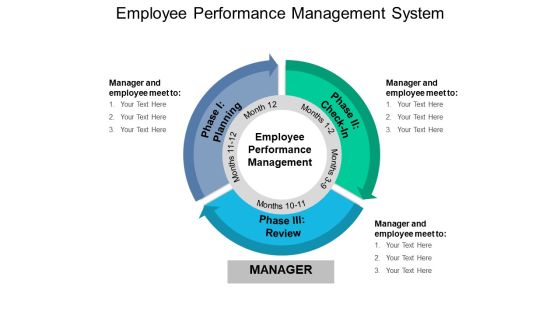
Employee Performance Management System Ppt PowerPoint Presentation Slides Images
This is a employee performance management system ppt powerpoint presentation slides images. This is a three stage process. The stages in this process are product lifecycle, management cycle, project cycle.
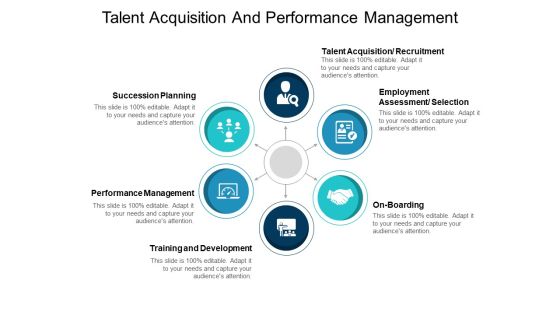
Talent Acquisition And Performance Management Ppt PowerPoint Presentation Introduction
This is a talent acquisition and performance management ppt powerpoint presentation introduction. This is a six stage process. The stages in this process are product lifecycle, management cycle, project cycle.

Sales Performance Dashboard Template Ppt PowerPoint Presentation Professional Elements
This is a sales performance dashboard template ppt powerpoint presentation professional elements. This is a eight stage process. The stages in this process are sales comparison, sales by product category, sales by month, brand profitability, revenue.

Company Sales And Performance Dashboard Ppt PowerPoint Presentation Show Structure
This is a company sales and performance dashboard ppt powerpoint presentation show structure. This is a four stage process. The stages in this process are year product sales, month growth in revenue, profit margins graph, year profits.
Operational Performance Metrics Days Ppt PowerPoint Presentation Icon Maker
This is a operational performance metrics days ppt powerpoint presentation icon maker. This is a four stage process. The stages in this process are customer support tickets, lob efficiency measure, process downtime level, percentage of product defects.

Cost Performance Index Ppt PowerPoint Presentation Inspiration Graphics Example
This is a cost performance index ppt powerpoint presentation inspiration graphics example. This is a three stage process. The stages in this process are business, management, marketing, percentage, product.

Retail Performance Measurement Chart Ppt PowerPoint Presentation Ideas Structure
This is a retail performance measurement chart ppt powerpoint presentation ideas structure. This is a four stage process. The stages in this process are product distribution, distribution system, numeric distribution.

Cost Performance Index Ppt PowerPoint Presentation Infographics Mockup
This is a cost performance index ppt powerpoint presentation infographics mockup. This is a three stage process. The stages in this process are finance, marketing, management, investment, product, percentage.
Impact Of Customer Churn On Organization Performance Icons PDF
Mentioned slide outlines the impact of a higher attrition rate on the companys financial performance. It contains information about major financial key performance indicators KPIs such as monthly recurring revenue MRR, customer lifetime value CLV, and customer acquisition cost CAC. If you are looking for a format to display your unique thoughts, then the professionally designed Impact Of Customer Churn On Organization Performance Icons PDF is the one for you. You can use it as a Google Slides template or a PowerPoint template. Incorporate impressive visuals, symbols, images, and other charts. Modify or reorganize the text boxes as you desire. Experiment with shade schemes and font pairings. Alter, share or cooperate with other people on your work. Download Impact Of Customer Churn On Organization Performance Icons PDF and find out how to give a successful presentation. Present a perfect display to your team and make your presentation unforgettable.

Comparative Assessment Of Sales Performance Post Process Improvement Inspiration PDF
This slide showcases comparative assessment of sales team performance of our business and competitors. It analyze performance on the basis of elements such as lead conversion rate, monthly sales growth, customer lifetime value, average conversion time , monthly calls and emails per representative, etc. If you are looking for a format to display your unique thoughts, then the professionally designed Comparative Assessment Of Sales Performance Post Process Improvement Inspiration PDF is the one for you. You can use it as a Google Slides template or a PowerPoint template. Incorporate impressive visuals, symbols, images, and other charts. Modify or reorganize the text boxes as you desire. Experiment with shade schemes and font pairings. Alter, share or cooperate with other people on your work. Download Comparative Assessment Of Sales Performance Post Process Improvement Inspiration PDF and find out how to give a successful presentation. Present a perfect display to your team and make your presentation unforgettable.

Comparative Assessment Of Sales Performance Post Process Improvement Portrait PDF
This slide showcases comparative assessment of sales team performance of our business and competitors. It analyze performance on the basis of elements such as lead conversion rate, monthly sales growth, customer lifetime value, average conversion time , monthly calls and emails per representative, etc. Crafting an eye catching presentation has never been more straightforward. Let your presentation shine with this tasteful yet straightforward Comparative Assessment Of Sales Performance Post Process Improvement Portrait PDF template. It offers a minimalistic and classy look that is great for making a statement. The colors have been employed intelligently to add a bit of playfulness while still remaining professional. Construct the ideal Comparative Assessment Of Sales Performance Post Process Improvement Portrait PDF that effortlessly grabs the attention of your audience Begin now and be certain to wow your customers.

Employee Performance Improvement Employees Coaching Program Background PDF
This slide defines the coaching program requirements for employees performance improvement. It includes information related to reasons, objectives , actions and assessment criteria. Showcasing this set of slides titled Employee Performance Improvement Employees Coaching Program Background PDF. The topics addressed in these templates are Productivity Improvement, Unsatisfactory Quality, Quality Service. All the content presented in this PPT design is completely editable. Download it and make adjustments in color, background, font etc. as per your unique business setting.

 Home
Home