Performance Comparison

Various Social Media Analytical Techniques For Marketers Summary PDF
Mentioned slide outlines analytics tools which can be used by marketer to analyze brand performance on social media. Sprout social, buzz sump, tap influence and snaplytics are some of the major tools which will assist organization to increase ROI from social media. Pitch your topic with ease and precision using this various social media analytical techniques for marketers summary pdf. This layout presents information on marketing, industry, analyze. It is also available for immediate download and adjustment. So, changes can be made in the color, design, graphics or any other component to create a unique layout.

Six Weeks Project Plan For Event Management Infographics PDF
In this slide we have showcased 6 weeks project plan for effectively and efficiently managing project. It includes activities such as develop budget sheet, performance reservations, social media advertisements and final requirement checking. Pitch your topic with ease and precision using this Six Weeks Project Plan For Event Management Infographics PDF. This layout presents information on Advertising, Budget, Develop. It is also available for immediate download and adjustment. So, changes can be made in the color, design, graphics or any other component to create a unique layout.

Continuous Enhancement Strategy What Is Operational Excellence Guidelines PDF
The following slide provides an overview of operational excellence as it displays a model that highlights key components essential for organization such as employee engagement, strategy, process management and continues improvement etc. Presenting Continuous Enhancement Strategy What Is Operational Excellence Guidelines PDF to provide visual cues and insights. Share and navigate important information on six stages that need your due attention. This template can be used to pitch topics like Employee Engagement, Organization, Improvement, Performance Management, Process Management, Strategy. In addtion, this PPT design contains high resolution images, graphics, etc, that are easily editable and available for immediate download.
Playbook For Improving Production Process What Is Operational Excellence Icons PDF
The following slide provides an overview of operational excellence as it displays a model that highlights key components essential for organization such as employee engagement, strategy, process management and continues improvement etc. Presenting Playbook For Improving Production Process What Is Operational Excellence Icons PDF to provide visual cues and insights. Share and navigate important information on six stages that need your due attention. This template can be used to pitch topics like Strategy, Process Management, Performance Management, Employee Engagement, Organization, Improvement. In addtion, this PPT design contains high resolution images, graphics, etc, that are easily editable and available for immediate download.
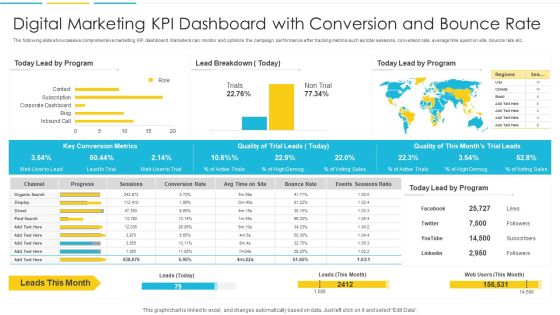
Digital Marketing KPI Dashboard With Conversion And Bounce Rate Introduction PDF
The following slide showcases a comprehensive marketing KPI dashboard. Marketers can monitor and optimize the campaign performance after tracking metrics such as total sessions, conversion rate, average time spent on site, bounce rate etc. Pitch your topic with ease and precision using this Digital Marketing KPI Dashboard With Conversion And Bounce Rate Introduction PDF. This layout presents information on Organic, Progress, Conversion Rate. It is also available for immediate download and adjustment. So, changes can be made in the color, design, graphics or any other component to create a unique layout
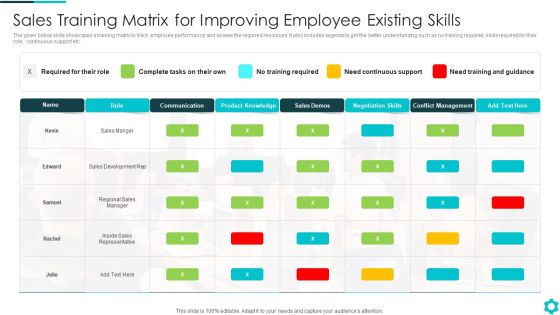
Sales Training Matrix For Improving Employee Existing Skills Infographics PDF
The given below slide showcases a training matrix to track employee performance and assess the required resources. It also includes legends to get the better understanding such as no training required, skills required for their role, continuous support etc.Pitch your topic with ease and precision using this Sales Training Matrix For Improving Employee Existing Skills Infographics PDF This layout presents information on Communication, Conflict Management, Inside Sales Representative It is also available for immediate download and adjustment. So, changes can be made in the color, design, graphics or any other component to create a unique layout.
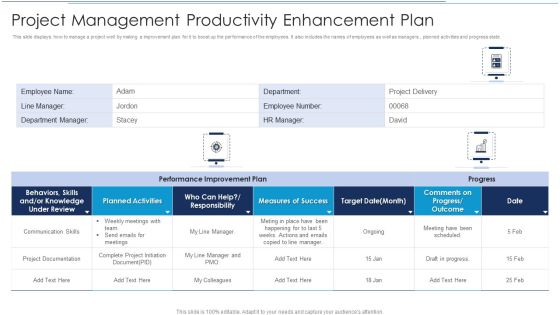
Project Management Productivity Enhancement Plan Sample PDF
This slide displays how to manage a project well by making a improvement plan for it to boost up the performance of the employees. It also includes the names of employees as well as managers , planned activities and progress state.Pitch your topic with ease and precision using this Project Management Productivity Enhancement Plan Sample PDF This layout presents information on Planned Activities, Measures Of Success, Behaviors Skills It is also available for immediate download and adjustment. So, changes can be made in the color, design, graphics or any other component to create a unique layout.

Startup Business Financial Dashboard With Key Metrics Sample PDF
This slide represents the financial dashboard for startup company with key performance indicators. It includes details related to current working capital, cash conversion cycle in days and vendor payment error rate. Pitch your topic with ease and precision using this Startup Business Financial Dashboard With Key Metrics Sample PDF. This layout presents information on Cash Conversion Cycle, Current Working Capital, Current Liabilities Debt. It is also available for immediate download and adjustment. So, changes can be made in the color, design, graphics or any other component to create a unique layout.
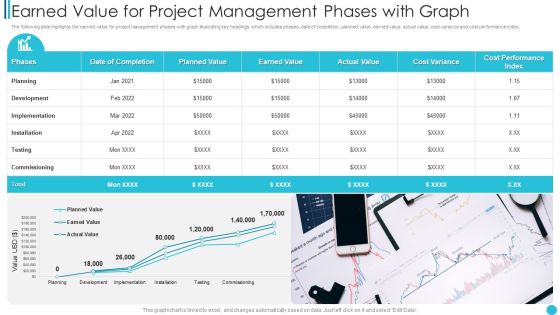
Earned Value For Project Management Phases With Graph Microsoft PDF
The following slide highlights the earned value for project management phases with graph illustrating key headings which includes phases, date of completion, planned value, earned value, actual value, cost variance and cost performance index.Pitch your topic with ease and precision using this Earned Value For Project Management Phases With Graph Microsoft PDF This layout presents information on Implementation, Installation, Commissioning It is also available for immediate download and adjustment. So, changes can be made in the color, design, graphics or any other component to create a unique layout.
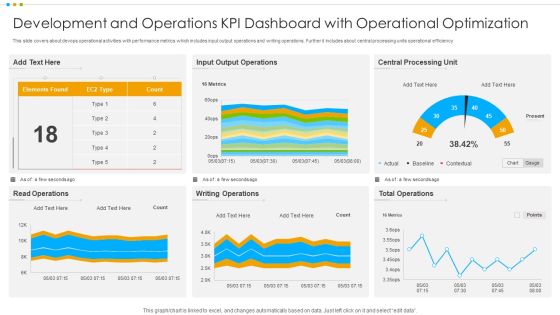
Development And Operations KPI Dashboard With Operational Optimization Pictures PDF
This slide covers about devops operational activities with performance metrics which includes input output operations and writing operations. Further it includes about central processing units operational efficiency.Pitch your topic with ease and precision using this Development And Operations KPI Dashboard With Operational Optimization Pictures PDF This layout presents information on Output Operations, Central Processing, Total Operations It is also available for immediate download and adjustment. So, changes can be made in the color, design, graphics or any other component to create a unique layout.

Case Administration Dashboard With Resolved Cases Graphics PDF
This slide shows dashboard which can be used to monitor the status of case management solved in the organizations. It includes key performance indicators such as active cases by priority, by subject, by age, by branch, etc. Pitch your topic with ease and precision using this Case Administration Dashboard With Resolved Cases Graphics PDF. This layout presents information on Case Administration Dashboard, Resolved Cases. It is also available for immediate download and adjustment. So, changes can be made in the color, design, graphics or any other component to create a unique layout.

Skill Development Training Program For Sales Growth Rules PDF
This slide presents a skill development training program for improving sales performance and lead generation. It includes various skills like effective communication, digital sales, relationship building and the art of persuasion.Pitch your topic with ease and precision using this Skill Development Training Program For Sales Growth Rules PDF This layout presents information on Effective Communication, Sales Improvement, Content Creation It is also available for immediate download and adjustment. So, changes can be made in the color, design, graphics or any other component to create a unique layout.

Sales Incentive Compensation Programs Plan Chart Template PDF
This slide represents sales incentive compensation policy plan chart illustrating on target earning, mix pay, base salary, annual target incentive etc. for employees of the organization. Pitch your topic with ease and precision using this Sales Incentive Compensation Programs Plan Chart Template PDF. This layout presents information on Sale Commission Cap, Performance Time Frame, Annual Target Incentive. It is also available for immediate download and adjustment. So, changes can be made in the color, design, graphics or any other component to create a unique layout.
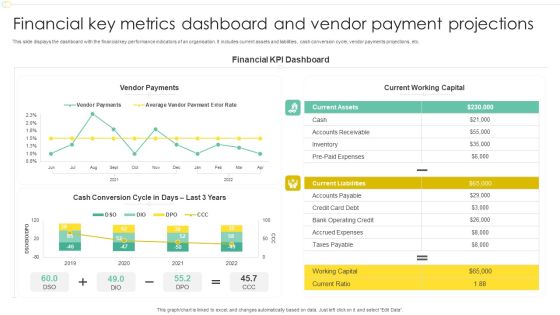
Financial Key Metrics Dashboard And Vendor Payment Projections Professional PDF
This slide displays the dashboard with the financial key performance indicators of an organisation. It includes current assets and liabilities, cash conversion cycle, vendor payments projections, etc. Pitch your topic with ease and precision using this Financial Key Metrics Dashboard And Vendor Payment Projections Professional PDF. This layout presents information on Financial KPI Dashboard, Current Working Capital, Vendor Payments. It is also available for immediate download and adjustment. So, changes can be made in the color, design, graphics or any other component to create a unique layout.

Logistics KPI Status Dashboard With Monthly KPI Ppt Infographic Template Layout PDF
The following slide highlights the transportation status dashboard with monthly KPI illustrating order status with customer, order date and delivery date. It shows financial performance for four quarters as well as todays order, inventory and monthly KPI with Inventory, shipping cost for past 30 days. Pitch your topic with ease and precision using this Logistics KPI Status Dashboard With Monthly KPI Ppt Infographic Template Layout PDF. This layout presents information on Order Status, Today Order, Inventory, Monthly KPI. It is also available for immediate download and adjustment. So, changes can be made in the color, design, graphics or any other component to create a unique layout.

Personnel Engagement Measurement Effective Approaches With Statistics Structure PDF
This slide depicts different approaches to measure engagement in employees. It includes engagement surveys, exit interviews, one on ones with managers, performance ratings, first year employees retention rate, retention rate for experience employees, customer satisfaction rates and employee productivity. Pitch your topic with ease and precision using this Personnel Engagement Measurement Effective Approaches With Statistics Structure PDF. This layout presents information on Employees Increases, Person Discussion, Employee Morale. It is also available for immediate download and adjustment. So, changes can be made in the color, design, graphics or any other component to create a unique layout.

Digital Marketing Guide For B2B Firms Dashboard To Track Social Media Ads Campaign Results Topics PDF
This slide showcases dashboard that can help organization to track performance of social media advertising campaigns. Its key components are cost per conversion, CTR, link clicks, impressions, conversion rate, click through rate and cost per click.Deliver and pitch your topic in the best possible manner with this Digital Marketing Guide For B2B Firms Dashboard To Track Social Media Ads Campaign Results Topics PDF. Use them to share invaluable insights on Website Conversions, Conversions Rate, Cost Per Conversion and impress your audience. This template can be altered and modified as per your expectations. So, grab it now.

Human Resource Strategy House Framework Sample PDF
The following slide showcases strategy house diagram of HR that includes workforce engagement, HR analytics, development and selection. It further includes employee training, performance improvement, problem solving and communication assessment. Pitch your topic with ease and precision using this Human Resource Strategy House Framework Sample PDF. This layout presents information on Workforce Engagement, Development, Succession Planning. It is also available for immediate download and adjustment. So, changes can be made in the color, design, graphics or any other component to create a unique layout.

Organizational Project Management Governance Framework Structure PDF
This slide showcase organizational project management governance framework which can be beneficial for governing the performance of a project team. It contains information about business intelligence, risk, managing tactics, quality management system, outcomes, etc. Pitch your topic with ease and precision using this Organizational Project Management Governance Framework Structure PDF. This layout presents information on Business Intelligence, Business Risk, Quality Management System. It is also available for immediate download and adjustment. So, changes can be made in the color, design, graphics or any other component to create a unique layout.
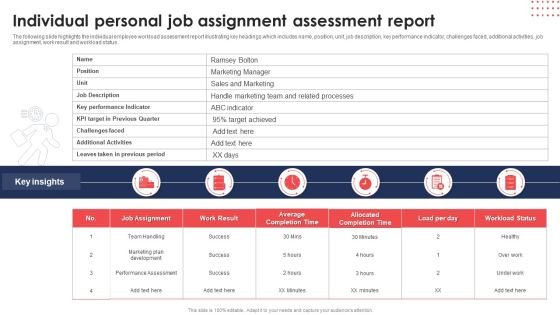
Individual Personal Job Assignment Assessment Report Ppt Model Brochure PDF
The following slide highlights the individual employee workload assessment report illustrating key headings which includes name, position, unit, job description, key performance indicator, challenges faced, additional activities, job assignment, work result and workload status. Pitch your topic with ease and precision using this Individual Personal Job Assignment Assessment Report Ppt Model Brochure PDF. This layout presents information on Job Assignment, Average Completion Time, Load Per Day. It is also available for immediate download and adjustment. So, changes can be made in the color, design, graphics or any other component to create a unique layout.
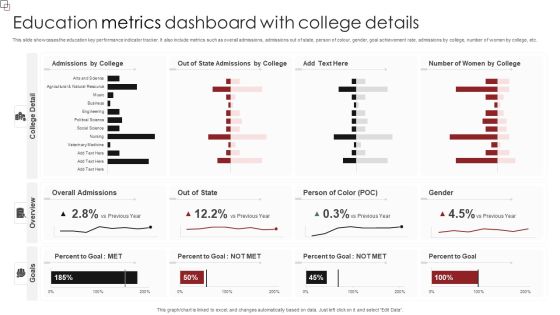
Education Metrics Dashboard With College Details Formats PDF
This slide showcases the education key performance indicator tracker. It also include metrics such as overall admissions, admissions out of state, person of colour, gender, goal achievement rate, admissions by college, number of women by college, etc. Pitch your topic with ease and precision using this Education Metrics Dashboard With College Details Formats PDF. This layout presents information on Overall Admissions, Person Of Color, Percent To Goal. It is also available for immediate download and adjustment. So, changes can be made in the color, design, graphics or any other component to create a unique layout.

Parallel Computing Processing Symmetrical Multi Processor SMP Architecture Download PDF
This slide represents the symmetrical multiprocessing technique of parallel processing, where a single shared main memory is coupled to several identical CPUs. It also covers components such as main memory, bus, cache, input and output, and the number of processors. Deliver an awe inspiring pitch with this creative Parallel Computing Processing Symmetrical Multi Processor SMP Architecture Download PDF bundle. Topics like System, Information, Performance can be discussed with this completely editable template. It is available for immediate download depending on the needs and requirements of the user.

Investment Summary Snapshot With Funds Strategy And Actions Mockup PDF
This slide showcases portfolio of investor that provide information on holdings and performance of portfolio. It includes fund name, initial allocation, investment amount, weighted average, latest price , market value and profit or loss. Pitch your topic with ease and precision using this Investment Summary Snapshot With Funds Strategy And Actions Mockup PDF. This layout presents information on Portfolio Funds, Risk Debt Fund, Growth Fund. It is also available for immediate download and adjustment. So, changes can be made in the color, design, graphics or any other component to create a unique layout.

Project Metrics Dashboard With Responsibilities Graphics PDF
This slide focuses on project management dashboard which shows the number of projects, types of objects, key performance indicators, viewpoints, overall project status with actions and progress, responsibilities with linked object types and actions, etc. Pitch your topic with ease and precision using this Project Metrics Dashboard With Responsibilities Graphics PDF. This layout presents information on Project Metrics, Dashboard With Responsibilities. It is also available for immediate download and adjustment. So, changes can be made in the color, design, graphics or any other component to create a unique layout.

Retail Merchandising Kpis To Measure Marketing Plan Ideas PDF
Mentioned slide showcases retail merchandising KPIs of different months such as sales per square feet, average transaction value, loss of inventory, foot traffic etc. Store manager can use such KPIs to effectively measure the performance of marketing strategies.Pitch your topic with ease and precision using this Retail Merchandising Kpis To Measure Marketing Plan Ideas PDF. This layout presents information on Average Transaction, Customer Retention, Foot Traffic. It is also available for immediate download and adjustment. So, changes can be made in the color, design, graphics or any other component to create a unique layout.
Tracking Channel Campaign Metrics To Measure Web Traffic Sample PDF
This slide covers measuring campaign key performance indicators through tracking channel web traffic which includes total visit, cost per click, engagement rate and total impressions. Pitch your topic with ease and precision using this Tracking Channel Campaign Metrics To Measure Web Traffic Sample PDF. This layout presents information on Revenue By Channel, Website Demographics, Product Sales Trend. It is also available for immediate download and adjustment. So, changes can be made in the color, design, graphics or any other component to create a unique layout.

Effective Business Techniques Plan For Suppliers Ppt PowerPoint Presentation Professional Design Ideas PDF
This slide includes an effective business strategic plan for a supplying firm. The elements part of this plan are purpose, key objectives, initiatives and key performance indicators.Pitch your topic with ease and precision using this Effective Business Techniques Plan For Suppliers Ppt PowerPoint Presentation Professional Design Ideas PDF. This layout presents information on People Development, Improving Communication, Revenue Distributor. It is also available for immediate download and adjustment. So, changes can be made in the color, design, graphics or any other component to create a unique layout.

Commodity Marketing KPI Dashboard For International Business Expansion Formats PDF
This slide signifies the product marketing key performance indicator dashboard for international business expansion. It covers information about sales, target, target achievement, gross profit margin, sales by region, growth and inventory outstanding.Pitch your topic with ease and precision using this Commodity Marketing KPI Dashboard For International Business Expansion Formats PDF. This layout presents information on Target Achievement, Receivale Days, Gross Profit. It is also available for immediate download and adjustment. So, changes can be made in the color, design, graphics or any other component to create a unique layout.
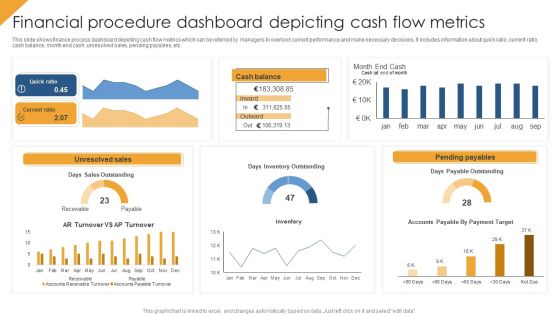
Financial Procedure Dashboard Depicting Cash Flow Metrics Structure PDF
This slide shows finance process dashboard depicting cash flow metrics which can be referred by managers to overlook current performance and make necessary decisions. It includes information about quick ratio, current ratio, cash balance, month end cash, unresolved sales, pending payables, etc. Pitch your topic with ease and precision using this Financial Procedure Dashboard Depicting Cash Flow Metrics Structure PDF. This layout presents information on Quick Ratio, Unresolved Sales, Pending Payables. It is also available for immediate download and adjustment. So, changes can be made in the color, design, graphics or any other component to create a unique layout.

Kpi Dashboard To Track Video Promotion Techniques Ppt Summary Guide PDF
This slide signifies the key performance indicator dashboard to measure video promotion techniques. It covers information regarding to the page visit, post reach, summary, click action on page. Pitch your topic with ease and precision using this Kpi Dashboard To Track Video Promotion Techniques Ppt Summary Guide PDF. This layout presents information on Page Visit, Page Summary, Post Overview. It is also available for immediate download and adjustment. So, changes can be made in the color, design, graphics or any other component to create a unique layout.
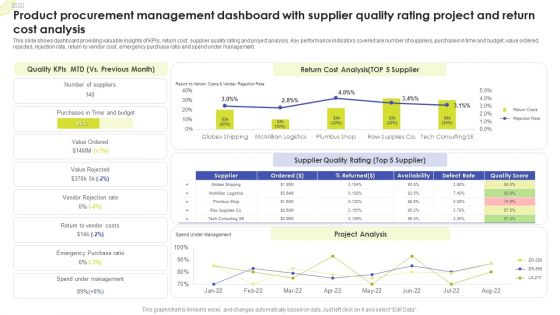
Product Procurement Management Dashboard With Supplier Quality Rating Project And Return Cost Analysis Sample PDF
This slide shows dashboard providing valuable insights of KPIs, return cost, supplier quality rating and project analysis. Key performance indicators covered are number of suppliers, purchases in time and budget, value ordered, rejected, rejection rate, return to vendor cost, emergency purchase ratio and spend under management. Pitch your topic with ease and precision using this Product Procurement Management Dashboard With Supplier Quality Rating Project And Return Cost Analysis Sample PDF. This layout presents information on Quality KPIs, Return Cost Analysis, Supplier Quality Rating. It is also available for immediate download and adjustment. So, changes can be made in the color, design, graphics or any other component to create a unique layout.

Customer Behavior Analytics Dashboard To Improve Satisfaction Ppt File Infographics PDF
The following slide provides an insight of websites performance that includes date parameters. The dashboard includes sessions, users, pageviews, bounce rate and percentage of new sessions. Pitch your topic with ease and precision using this Customer Behavior Analytics Dashboard To Improve Satisfaction Ppt File Infographics PDF. This layout presents information on Session, Avg Session Duration, Bounce Rate. It is also available for immediate download and adjustment. So, changes can be made in the color, design, graphics or any other component to create a unique layout.
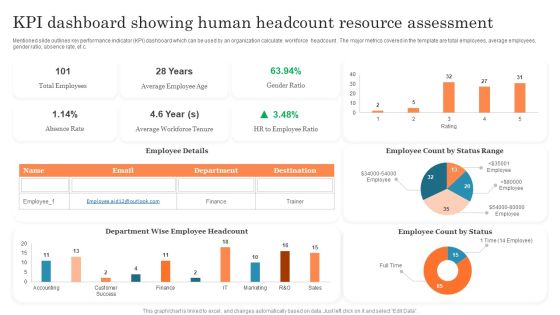
KPI Dashboard Showing Human Headcount Resource Assessment Ppt PowerPoint Presentation Outline PDF
Mentioned slide outlines key performance indicator KPI dashboard which can be used by an organization calculate workforce headcount . The major metrics covered in the template are total employees, average employees, gender ratio, absence rate, etc. Pitch your topic with ease and precision using this KPI Dashboard Showing Human Headcount Resource Assessment Ppt PowerPoint Presentation Outline PDF. This layout presents information on Total Employees, Average Employee, Employee Count. It is also available for immediate download and adjustment. So, changes can be made in the color, design, graphics or any other component to create a unique layout.

Health And Risk KPI Dashboard Ppt Pictures Designs Download PDF
The slide highlights the health and safety key performance indicator dashboard illustrating key headings which includes key objectives, inspections, total reports vs over due reports, injuries by body part and accident trends. Pitch your topic with ease and precision using this Health And Risk KPI Dashboard Ppt Pictures Designs Download PDF. This layout presents information on Key Objectives, Inspections, Accidents Trends. It is also available for immediate download and adjustment. So, changes can be made in the color, design, graphics or any other component to create a unique layout.

Investment Project KPI Dashboard For Construction Analytics Background PDF
This slide illustrates construction dashboard for improving capital project outcomes. It also include KPIs such as projects completion, schedule performance index, consumer price index, project status, cost breakdown, etc. Pitch your topic with ease and precision using this Investment Project KPI Dashboard For Construction Analytics Background PDF. This layout presents information on Cost Breakdown, Completion, Progress. It is also available for immediate download and adjustment. So, changes can be made in the color, design, graphics or any other component to create a unique layout.

Metrics To Manage Company Cash Flow Ppt Model Gridlines PDF
This slide showcases key metrics used by organizations to manage cashflow. The key performance indicators included are days, receivable, inventory and payable outstanding. Pitch your topic with ease and precision using this Metrics To Manage Company Cash Flow Ppt Model Gridlines PDF. This layout presents information on Days Receivable Outstanding, Days Inventory Outstanding, Days Payable Outstanding. It is also available for immediate download and adjustment. So, changes can be made in the color, design, graphics or any other component to create a unique layout.

Employee Satisfaction Survey Form With Ratings By HR Department Ppt Infographic Template Topics PDF
This slide shows the survey form created by by the HR department of the organization in order to receive feedback from employees related to their satisfaction at workplace. It includes providing ratings to organization by the individuals on the basis of employee compensation, training, culture, job security etc. Pitch your topic with ease and precision using this Employee Satisfaction Survey Form With Ratings By HR Department Ppt Infographic Template Topics PDF. This layout presents information on Compensation To Employees, Opportunity For Advancement, Performance Evaluation. It is also available for immediate download and adjustment. So, changes can be made in the color, design, graphics or any other component to create a unique layout.

Project KPI Dashboard To Monitor Financial Evaluation Background PDF
This slide signifies the construction project management projection plan. It covers information regarding to the estimate ID, Task, effort hours, resource quantity, performance factor and duration evaluation. Pitch your topic with ease and precision using this Project KPI Dashboard To Monitor Financial Evaluation Background PDF. This layout presents information on Actual Expenses, Payable Account, Budget Allocated. It is also available for immediate download and adjustment. So, changes can be made in the color, design, graphics or any other component to create a unique layout.

Project Earned Value Analysis Management Report Ppt PowerPoint Presentation Gallery Outline PDF
This slide represents project earned value analysis report showcasing project task, budget cost, planned value, actual cost, earned value, project performance metrics etc. Pitch your topic with ease and precision using this Project Earned Value Analysis Management Report Ppt PowerPoint Presentation Gallery Outline PDF. This layout presents information on Project Software Development, Phase Management, Communication Planning. It is also available for immediate download and adjustment. So, changes can be made in the color, design, graphics or any other component to create a unique layout.
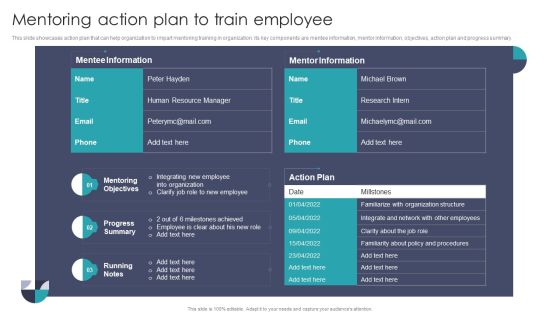
Mentoring Action Plan To Train Employee Summary PDF
This slide showcases action plan that can help organization to impart mentoring training in organization. its key components are mentee information, mentor information, objectives, action plan and progress summary. From laying roadmaps to briefing everything in detail, our templates are perfect for you. You can set the stage with your presentation slides. All you have to do is download these easy to edit and customizable templates. Mentoring Action Plan To Train Employee Summary PDF will help you deliver an outstanding performance that everyone would remember and praise you for. Do download this presentation today.

Applicant Selection Dashboard To Monitor Recruitment Process Sample PDF
This slide shows dashboard which can be used to track recruitment procedure status. It includes key performance indicators such as total open positions, total roles, selected applicant, application sources, etc. Pitch your topic with ease and precision using this Applicant Selection Dashboard To Monitor Recruitment Process Sample PDF. This layout presents information on Selection Rate, Recruitment Funnel, Application Sources. It is also available for immediate download and adjustment. So, changes can be made in the color, design, graphics or any other component to create a unique layout.

Identifying Vacant Positions In Different Departments Icons PDF
This slide showcases vacant position in different departments of organization which can be evaluated before starting recruitment process. Its key components are department, positions to be filled, permanent or contractual and full or part time. From laying roadmaps to briefing everything in detail, our templates are perfect for you. You can set the stage with your presentation slides. All you have to do is download these easy to edit and customizable templates. Identifying Vacant Positions In Different Departments Icons PDF will help you deliver an outstanding performance that everyone would remember and praise you for. Do download this presentation today.

Expectations Of Internal Rate Of Return And ROI For Investors Diagrams PDF
This slide showcases returns that can be expected by investing capital into business. Its key components are year, total investment, returns, internal rate of return and return on investment. From laying roadmaps to briefing everything in detail, our templates are perfect for you. You can set the stage with your presentation slides. All you have to do is download these easy to edit and customizable templates. Expectations Of Internal Rate Of Return And ROI For Investors Diagrams PDF will help you deliver an outstanding performance that everyone would remember and praise you for. Do download this presentation today.

Financial Kpi Dashboard To Evaluate Fundraising Impact Developing Fundraising Techniques Diagrams PDF
This slide showcases dashboard that can help organization to evaluate key changes in financial KPIs post fundraising. Its key components are net profit margin, revenue, gross profit margin, debt to equity and return on equity. From laying roadmaps to briefing everything in detail, our templates are perfect for you. You can set the stage with your presentation slides. All you have to do is download these easy-to-edit and customizable templates. Financial Kpi Dashboard To Evaluate Fundraising Impact Developing Fundraising Techniques Diagrams PDF will help you deliver an outstanding performance that everyone would remember and praise you for. Do download this presentation today.

Database Mining In Human Resource Application Ideas PDF
This slide depicts a table providing a brief overview multiple data mining methods used in human resource management to discover best talent and improve performance respective to each individual. It covers methods such as decision tree, ANN and fuzzy logic and rough set theory. Pitch your topic with ease and precision using this Database Mining In Human Resource Application Ideas PDF. This layout presents information on Decision Tree, Rough Set Theory, Database mining. It is also available for immediate download and adjustment. So, changes can be made in the color, design, graphics or any other component to create a unique layout.
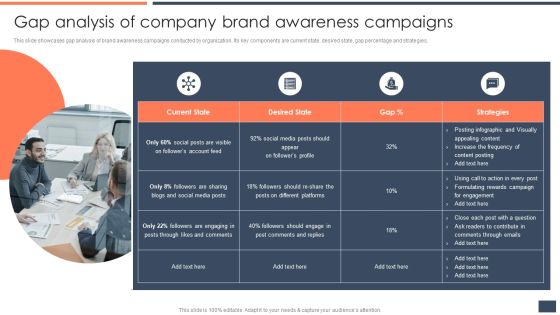
Strategic Promotion Guide To Boost Customer Brand Awareness Gap Analysis Of Company Brand Awareness Campaigns Ideas PDF
This slide showcases gap analysis of brand awareness campaigns conducted by organization. Its key components are current state, desired state, gap percentage and strategies. From laying roadmaps to briefing everything in detail, our templates are perfect for you. You can set the stage with your presentation slides. All you have to do is download these easy to edit and customizable templates. Strategic Promotion Guide To Boost Customer Brand Awareness Gap Analysis Of Company Brand Awareness Campaigns Ideas PDF will help you deliver an outstanding performance that everyone would remember and praise you for. Do download this presentation today.
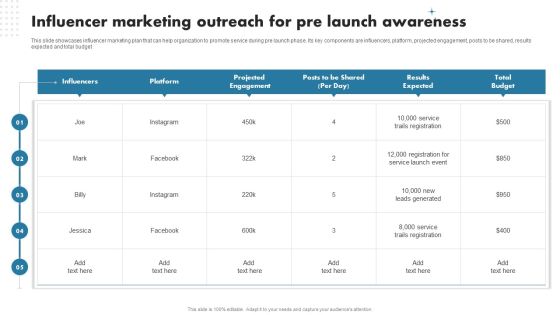
Enhancing Customer Outreach Influencer Marketing Outreach For Pre Launch Structure PDF
This slide showcases influencer marketing plan that can help organization to promote service during pre launch phase. Its key components are influencers, platform, projected engagement, posts to be shared, results expected and total budget. From laying roadmaps to briefing everything in detail, our templates are perfect for you. You can set the stage with your presentation slides. All you have to do is download these easy-to-edit and customizable templates. Enhancing Customer Outreach Influencer Marketing Outreach For Pre Launch Structure PDF will help you deliver an outstanding performance that everyone would remember and praise you for. Do download this presentation today.

Brand Awareness Strategy Dashboard To Track Website Traffic After Brand Awareness Rules PDF
This slide showcases dashboard that can help organization to track the website traffic after running online brand awareness marketing campaigns. Its key components are new visitors, traffic by source, traffic by lead source, customers wins by lead source and bounce rate. From laying roadmaps to briefing everything in detail, our templates are perfect for you. You can set the stage with your presentation slides. All you have to do is download these easy-to-edit and customizable templates. Brand Awareness Strategy Dashboard To Track Website Traffic After Brand Awareness Rules PDF will help you deliver an outstanding performance that everyone would remember and praise you for. Do download this presentation today.
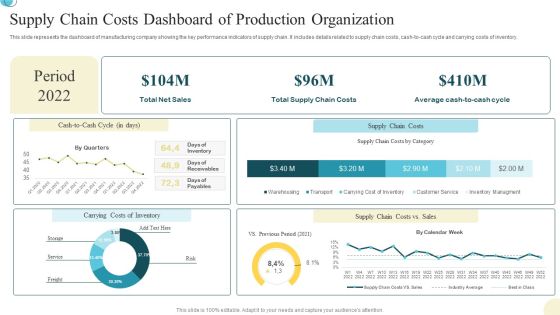
Supply Chain Costs Dashboard Of Production Organization Background PDF
This slide represents the dashboard of manufacturing company showing the key performance indicators of supply chain. It includes details related to supply chain costs, cash to cash cycle and carrying costs of inventory. Pitch your topic with ease and precision using this Supply Chain Costs Dashboard Of Production Organization Background PDF. This layout presents information on Supply Chain Costs, Dashboard Of Production, Organization. It is also available for immediate download and adjustment. So, changes can be made in the color, design, graphics or any other component to create a unique layout.

Business Sales And Revenue Summary Dashboard Brochure PDF
This slide exhibits sales report dashboards that provides information of sales activities and performance in financial year. It includes elements such as average weekly sales revenue, customer acquisition cost, customer lifetime value and sales target. Pitch your topic with ease and precision using this Business Sales And Revenue Summary Dashboard Brochure PDF. This layout presents information on Average Revenue, Customer Lifetime, Customer Acquisition. It is also available for immediate download and adjustment. So, changes can be made in the color, design, graphics or any other component to create a unique layout.
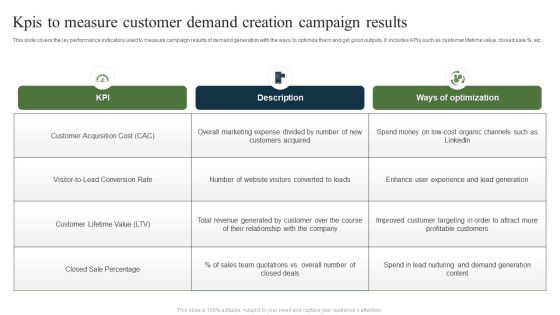
Kpis To Measure Customer Demand Creation Campaign Results Ppt Ideas Portrait PDF
This slide covers the ley performance indicators used to measure campaign results of demand generation with the ways to optimize them and get good outputs. It includes KPIs such as customer lifetime value, closed sale percent, etc. Pitch your topic with ease and precision using this Kpis To Measure Customer Demand Creation Campaign Results Ppt Ideas Portrait PDF. This layout presents information on KPI, Description, Ways Optimization, Customer Acquisition Cost. It is also available for immediate download and adjustment. So, changes can be made in the color, design, graphics or any other component to create a unique layout.

Food Segments Contribution Towards Total Production And Global Export Topics PDF
This slide graphically provides information regarding the contribution of multiple food components such as meats, diary, grains and oil seeds, fruits and vegetables etc. towards total food production and global export. From laying roadmaps to briefing everything in detail, our templates are perfect for you. You can set the stage with your presentation slides. All you have to do is download these easy to edit and customizable templates. Food Segments Contribution Towards Total Production And Global Export Topics PDF will help you deliver an outstanding performance that everyone would remember and praise you for. Do download this presentation today.

Senseable Cities Maturity Model Framework Ideas PDF
This slide illustrate smart cities maturity model that is divided into two component assessment framework and solution framework. It includes elements such as resources and capabilities, smart cities solutions, operating model, technology and process design, degree of stakeholder involvement and performance metrices. Showcasing this set of slides titled Senseable Cities Maturity Model Framework Ideas PDF. The topics addressed in these templates are Resources And Capabilities, Operating Model, Technology And Process. All the content presented in this PPT design is completely editable. Download it and make adjustments in color, background, font etc. as per your unique business setting.

Workforce Compensation And Salary Dashboard Brochure PDF
The following slide showcases compensation dashboard that highlights regular payroll tasks. The dashboard includes number of workforce, departments, average performance and sick days, headcount, salary breakdown and number of employees by salary. Pitch your topic with ease and precision using this Workforce Compensation And Salary Dashboard Brochure PDF. This layout presents information on Workforce Compensation, Salary Dashboard. It is also available for immediate download and adjustment. So, changes can be made in the color, design, graphics or any other component to create a unique layout.
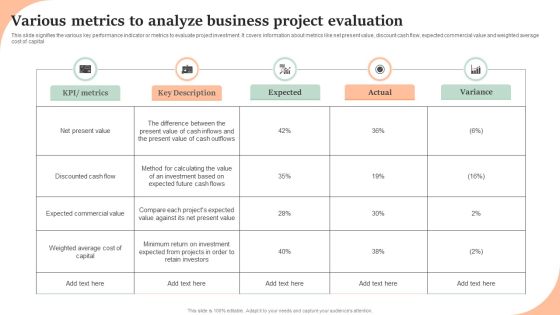
Various Metrics To Analyze Business Project Evaluation Inspiration PDF
This slide signifies the various key performance indicator or metrics to evaluate project investment. It covers information about metrics like net present value, discount cash flow, expected commercial value and weighted average cost of capital. Pitch your topic with ease and precision using this Various Metrics To Analyze Business Project Evaluation Inspiration PDF. This layout presents information on KPI, Metrics, Key Description, Expected, Actual, Variance. It is also available for immediate download and adjustment. So, changes can be made in the color, design, graphics or any other component to create a unique layout.

Parallel Computing System To Enhance Process Efficiency Multiple Instruction And Multiple Data Stream MISD Demonstration PDF
This slide illustrates the multiple instructions and multiple data streams, a type of parallel processing, and their components such as memory, processing elements, control unit, and interconnection network. It also outlines how information travels throughout this system.From laying roadmaps to briefing everything in detail, our templates are perfect for you. You can set the stage with your presentation slides. All you have to do is download these easy-to-edit and customizable templates. Parallel Computing System To Enhance Process Efficiency Multiple Instruction And Multiple Data Stream MISD Demonstration PDF will help you deliver an outstanding performance that everyone would remember and praise you for. Do download this presentation today.
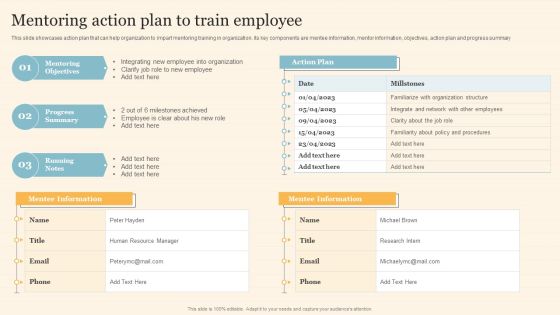
Staff On Job Coaching Program For Skills Enhancement Mentoring Action Plan To Train Employee Slides PDF
This slide showcases action plan that can help organization to impart mentoring training in organization. its key components are mentee information, mentor information, objectives, action plan and progress summary. From laying roadmaps to briefing everything in detail, our templates are perfect for you. You can set the stage with your presentation slides. All you have to do is download these easy to edit and customizable templates. Staff On Job Coaching Program For Skills Enhancement Mentoring Action Plan To Train Employee Slides PDF will help you deliver an outstanding performance that everyone would remember and praise you for. Do download this presentation today.
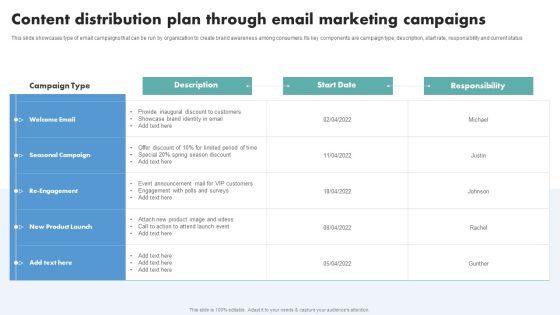
Techniques To Boost Brand Awareness Content Distribution Plan Through Email Marketing Inspiration PDF
This slide showcases type of email campaigns that can be run by organization to create brand awareness among consumers. Its key components are campaign type, description, start rate, responsibility and current status. From laying roadmaps to briefing everything in detail, our templates are perfect for you. You can set the stage with your presentation slides. All you have to do is download these easy-to-edit and customizable templates. Techniques To Boost Brand Awareness Content Distribution Plan Through Email Marketing Inspiration PDF will help you deliver an outstanding performance that everyone would remember and praise you for. Do download this presentation today.

Traditional Marketing Techniques Monthly Roi Calculation For Offline Marketing Plan Microsoft PDF
This slide covers an ROI calculator to help businesses determine the profitable channel of offline marketing and allocate funds accordingly. The key components of the calculator are investment cost, net income, difference, and ROI. From laying roadmaps to briefing everything in detail, our templates are perfect for you. You can set the stage with your presentation slides. All you have to do is download these easy-to-edit and customizable templates. Traditional Marketing Techniques Monthly Roi Calculation For Offline Marketing Plan Microsoft PDF will help you deliver an outstanding performance that everyone would remember and praise you for. Do download this presentation today.

Kpi Dashboard To Measure Personal Banking Customer Relationship Themes PDF
This slide signifies the key performance indicator dashboard to monitor bank relationship with customers. It covers customer satisfaction rate by region, district and includes 12 month trends. Pitch your topic with ease and precision using this Kpi Dashboard To Measure Personal Banking Customer Relationship Themes PDF. This layout presents information on Customer Satisfaction, Best Demonstrated, Worst Demonstrated. It is also available for immediate download and adjustment. So, changes can be made in the color, design, graphics or any other component to create a unique layout.

 Home
Home