Percentage
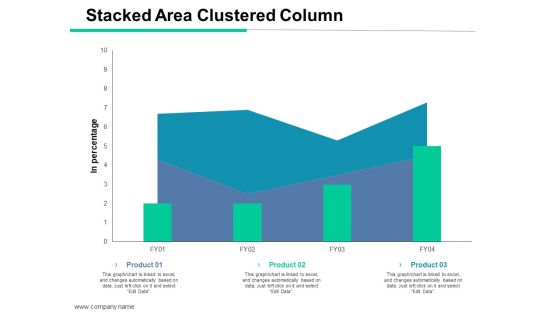
Stacked Area Clustered Column Ppt PowerPoint Presentation File Templates
This is a stacked area clustered column ppt powerpoint presentation file templates. This is a three stage process. The stages in this process are stacked area clustered column, product, financial, sales in percentage, management.

Area Chart Ppt PowerPoint Presentation Icon Show
This is a area chart ppt powerpoint presentation icon show. This is a two stage process. The stages in this process are product, financial year, in percentage, area chart.

Clustered Chart Ppt PowerPoint Presentation Outline Templates
This is a clustered chart ppt powerpoint presentation outline templates. This is a three stage process. The stages in this process are product, in percentage, in years, clustered chart.

Stacked Area Clustered Column Ppt PowerPoint Presentation Summary Slides
This is a stacked area clustered column ppt powerpoint presentation summary slides. This is a three stage process. The stages in this process are product, in percentage, financial year, bar graph.

Column Chart Ppt PowerPoint Presentation Portfolio Example Topics
This is a column chart ppt powerpoint presentation portfolio example topics. This is a two stage process. The stages in this process are product, financial year, sales in percentage, column chart.

Stacked Area Clustered Column Ppt PowerPoint Presentation Professional Influencers
This is a stacked area clustered column ppt powerpoint presentation professional influencers. This is a three stage process. The stages in this process are stacked area clustered column, percentage, product, year.

Hiring Plan Positions By Quarter Ppt PowerPoint Presentation Slides Deck
This is a hiring plan positions by quarter ppt powerpoint presentation slides deck. This is a five stage process. The stages in this process are percentage, product, business, management.

Bar Graph Product Ppt PowerPoint Presentation Model Graphic Tips
This is a bar graph product ppt powerpoint presentation model graphic tips. This is a three stage process. The stages in this process are product, percentage, business, management, marketing.

Competitor Positioning Ppt PowerPoint Presentation Professional Picture
This is a competitor positioning ppt powerpoint presentation professional picture. This is a two stage process. The stages in this process are company growth, percentage, market growth , business.

Monthly Recurring Revenue Churn Template 1 Ppt PowerPoint Presentation Clipart
This is a monthly recurring revenue churn template 1 ppt powerpoint presentation clipart. This is a one stage process. The stages in this process are business, marketing, success, in percentage, growth.

Stacked Area Clustered Column Ppt PowerPoint Presentation Styles Gridlines
This is a stacked area clustered column ppt powerpoint presentation styles gridlines. This is a three stage process. The stages in this process are dollars, in percentage, finance, growth strategy, business, strategy.
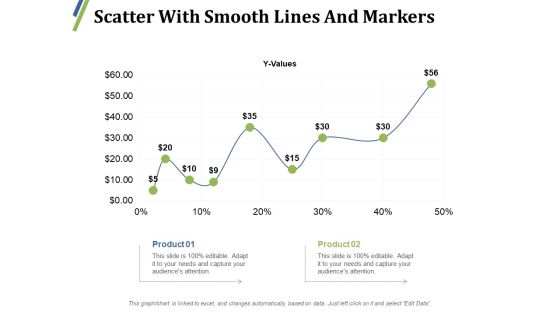
Scatter With Smooth Lines And Markers Ppt PowerPoint Presentation Outline Inspiration
This is a scatter with smooth lines and markers ppt powerpoint presentation outline inspiration. This is a two stage process. The stages in this process are product, percentage, finance, growth, line graph.

Stacked Line Chart Ppt PowerPoint Presentation Model Show
This is a stacked line chart ppt powerpoint presentation model show. This is a two stage process. The stages in this process are stacked line chart, product, profit, percentage, growth.
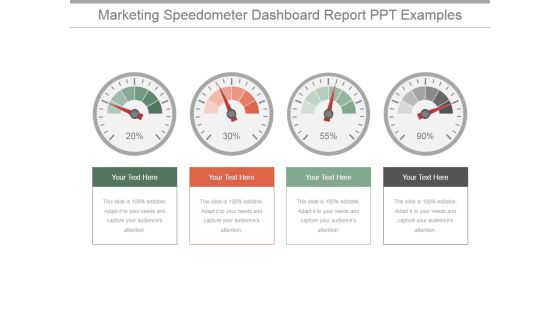
Marketing Speedometer Dashboard Report Ppt PowerPoint Presentation Designs Download
This is a marketing speedometer dashboard report ppt powerpoint presentation designs download. This is a four stage process. The stages in this process are dashboard, measurement, percentage, business, finance.

Comparison Of Prices Ppt PowerPoint Presentation Designs Download
This is a comparison of prices ppt powerpoint presentation designs download. This is a two stage process. The stages in this process are comparison of prices, marketing, in percentage, bar graph, business.

Stacked Line Ppt PowerPoint Presentation Professional Graphics
This is a stacked line ppt powerpoint presentation professional graphics. This is a three stage process. The stages in this process are revenue in percentage, product, business, marketing, success.
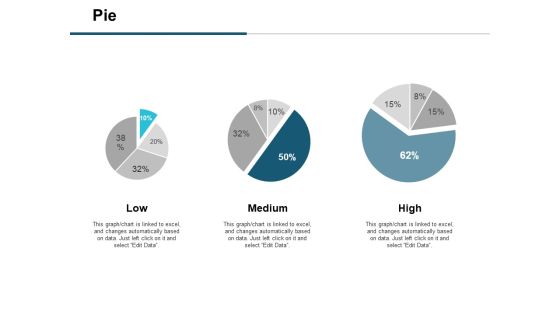
Pie Financial Ppt PowerPoint Presentation Infographics Master Slide
This is a pie financial ppt powerpoint presentation infographics master slide. This is a three stage process. The stages in this process are business strategy, marketing, management, percentage, pie, financial.

Competitor Positioning Ppt PowerPoint Presentation Show Example Introduction
This is a competitor positioning ppt powerpoint presentation show example introduction. This is a two stage process. The stages in this process are market growth, company growth, business, finance, percentage.

Competitor Positioning Ppt PowerPoint Presentation Gallery Portrait
This is a competitor positioning ppt powerpoint presentation gallery portrait. This is a two stage process. The stages in this process are company growth, market growth, business, marketing, percentage.

Big Data Opportunities And Challenges In Construction Ppt PowerPoint Presentation Outline
This is a big data opportunities and challenges in construction ppt powerpoint presentation outline. This is a three stage process. The stages in this process are finance, management, growth, percentage, business.

Resource Capacity Planning Template 2 Ppt PowerPoint Presentation Show
This is a resource capacity planning template 2 ppt powerpoint presentation show. This is a four stage process. The stages in this process are percentage, finance, donut, growth, success.

Portfolio Evaluation Template 2 Ppt PowerPoint Presentation Inspiration Information
This is a portfolio evaluation template 2 ppt powerpoint presentation inspiration information. This is a five stage process. The stages in this process are pie, finance, percentage, business, growth.

Clustered Column Line Ppt PowerPoint Presentation Slide
This is a clustered column line ppt powerpoint presentation slide. This is a three stage process. The stages in this process are bar graph, growth, finance, product, sales in percentage.

Bar Graph Ppt PowerPoint Presentation File Slides
This is a bar graph ppt powerpoint presentation file slides. This is a three stage process. The stages in this process are product, sales in percentage, bar graph, growth, success.

Timeline Analysis Ppt PowerPoint Presentation Pictures Master Slide
This is a timeline analysis ppt powerpoint presentation pictures master slide. This is a six stage process. The stages in this process are process change, timeline, business, management, percentage.
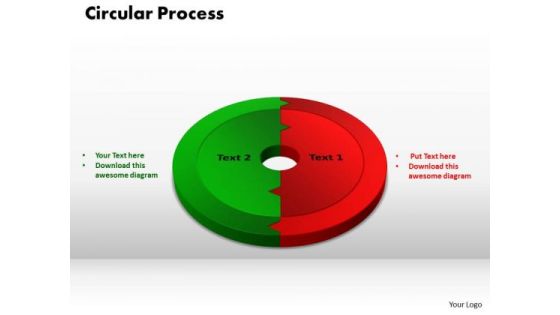
PowerPoint Design Slides Circular Process Business Ppt Backgrounds
PowerPoint Design Slides Circular Process Business PPT Backgrounds-This PowerPoint slide has circular process chart divided two parts that can be used for comparison. You can easily edit the size, percentage, text and color.-PowerPoint Design Slides Circular Process Business PPT Backgrounds
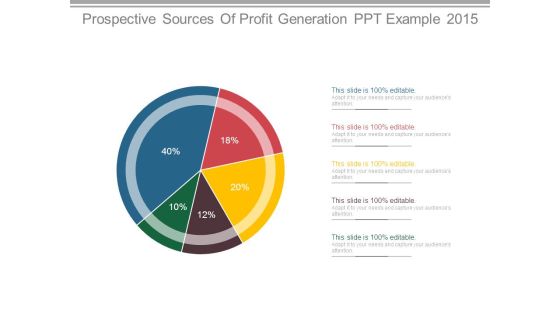
Prospective Sources Of Profit Generation Ppt Example 2015
This is a prospective sources of profit generation ppt example 2015. This is a five stage process. The stages in this process are finance, success, business, marketing, percentage, pie.
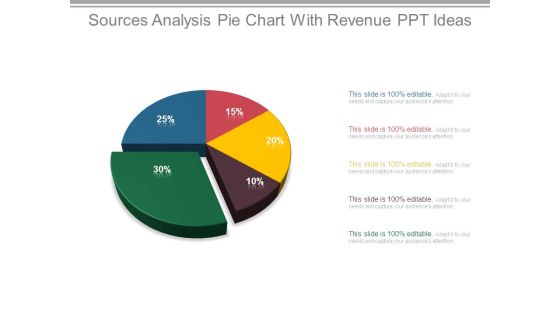
Sources Analysis Pie Chart With Revenue Ppt Ideas
This is a sources analysis pie chart with revenue ppt ideas. This is a five stage process. The stages in this process are finance, success, business, marketing, percentage, pie chart.
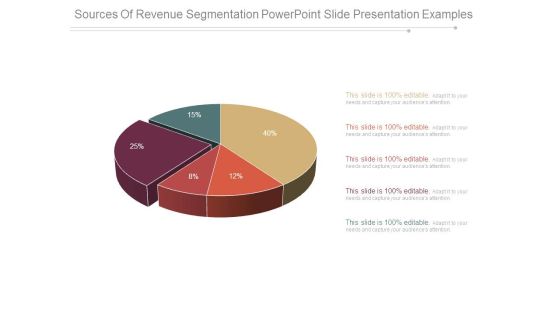
Sources Of Revenue Segmentation Powerpoint Slide Presentation Examples
This is a sources of revenue segmentation powerpoint slide presentation examples. This is a five stage process. The stages in this process are finance, success, business, marketing, percentage, pie chart.

Pie Chart For Current Sources Of Profit Ppt Background Template
This is a pie chart for current sources of profit ppt background template. This is a five stage process. The stages in this process are finance, success, business, marketing, percentage, donut.
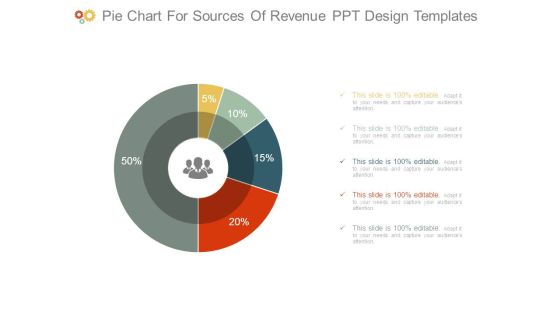
Pie Chart For Sources Of Revenue Ppt Design Templates
This is a pie chart for sources of revenue ppt design templates. This is a five stage process. The stages in this process are finance, success, business, marketing, percentage, donut.
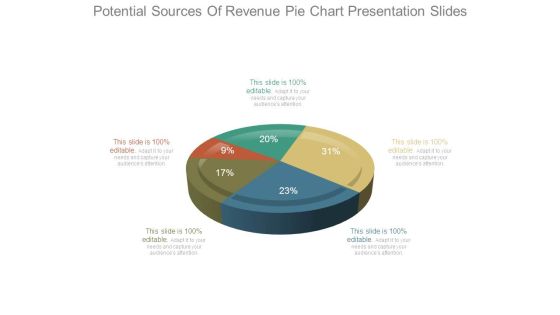
Potential Sources Of Revenue Pie Chart Presentation Slides
This is a potential sources of revenue pie chart presentation slides. This is a five stage process. The stages in this process are finance, success, business, marketing, percentage, pie.

Current Sources Of Profit Analysis Sample Of Ppt Presentation
This is a current sources of profit analysis sample of ppt presentation. This is a four stage process. The stages in this process are business, finance, marketing, percentage, management.
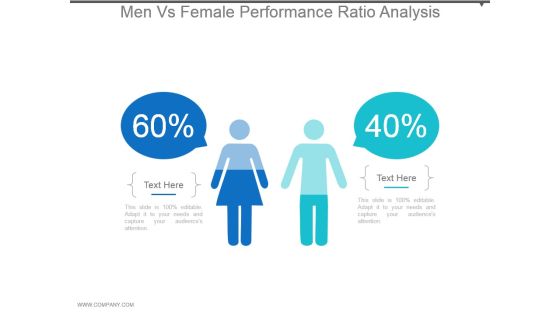
Men Vs Female Performance Ratio Analysis Ppt Background Designs
This is a men vs female performance ratio analysis ppt background designs. This is a two stage process. The stages in this process are percentage, finance, business, compare, performance.

Financial Reporting And Analysis Pie Chart Ppt PowerPoint Presentation Guidelines
This is a financial reporting and analysis pie chart ppt powerpoint presentation guidelines. This is a four stage process. The stages in this process are process, percentage, business, marketing, finance.
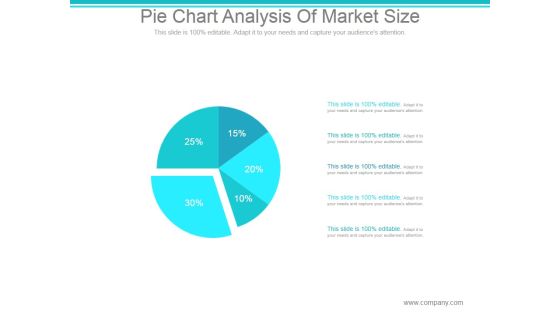
Pie Chart Analysis Of Market Size Ppt PowerPoint Presentation Show
This is a pie chart analysis of market size ppt powerpoint presentation show. This is a five stage process. The stages in this process are chart, graph, pie, percentage, business.
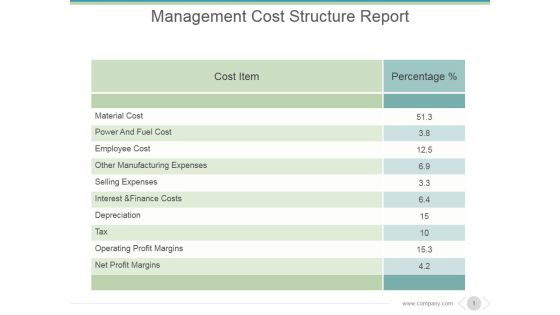
Management Cost Structure Report Ppt PowerPoint Presentation Graphics
This is a management cost structure report ppt powerpoint presentation graphics. This is a two stage process. The stages in this process are cost item, percentage, material cost, power and fuel cost, employee cost, other manufacturing expenses.

Magnifying Glass For Sales Performance Review Ppt PowerPoint Presentation Model
This is a magnifying glass for sales performance review ppt powerpoint presentation model. This is a four stage process. The stage in this process are magnifier glass, pie, finance, percentage, research.

Male Vs Female Work Productivity Comparison Ppt PowerPoint Presentation Slides
This is a male vs female work productivity comparison ppt powerpoint presentation slides. This is a two stage process. The stages in this process are finance, business, percentage, compare, marketing.
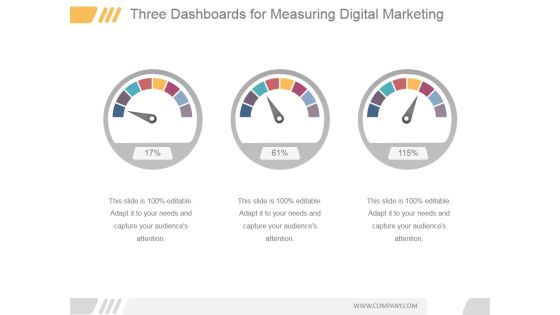
Three Dashboards For Measuring Digital Marketing Ppt PowerPoint Presentation Slide
This is a three dashboards for measuring digital marketing ppt powerpoint presentation slide. This is a three stage process. The stages in this process are dashboard, measuring, business, marketing, percentage.
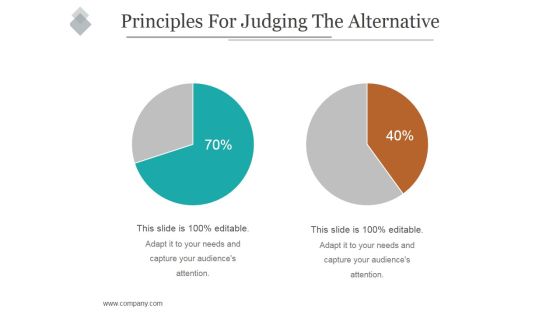
Principles For Judging The Alternative Ppt PowerPoint Presentation Slide
This is a principles for judging the alternative ppt powerpoint presentation slide. This is a two stage process. The stages in this process are business, pie, division, percentage, finance.

Selection Of The Optimal Portfolio Ppt PowerPoint Presentation Files
This is a selection of the optimal portfolio ppt powerpoint presentation files. This is a three stage process. The stages in this process are process, percentage, strategy, marketing, circle.
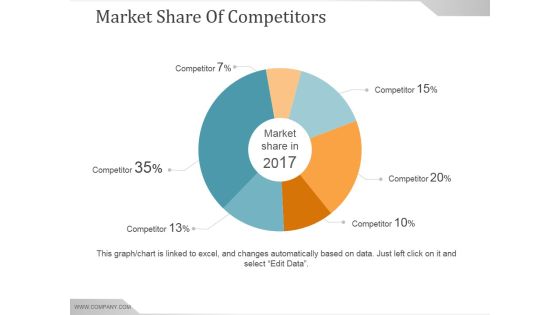
Market Share Of Competitors Ppt PowerPoint Presentation Slides
This is a market share of competitors ppt powerpoint presentation slides. This is a six stage process. The stages in this process are market share in, competitor, pie, finance, percentage.
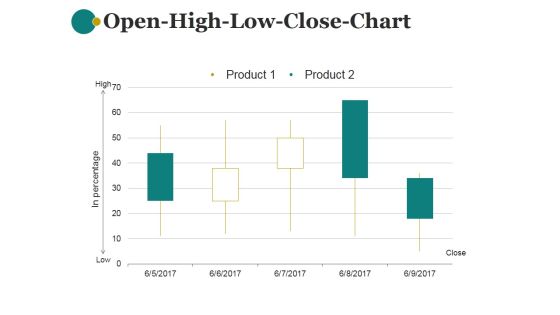
Open High Low Close Chart Ppt PowerPoint Presentation Information
This is a open high low close chart ppt powerpoint presentation information. This is a five stage process. The stages in this process are product, in percentage, close, low, high.

Financial Analysis Module PPT PowerPoint Presentation Complete Deck With Slides
This is a financial analysis module ppt powerpoint presentation complete deck with slides. This is a one stage process. The stages in this process are table, business, finance, analysis, percentage.

Funding Updates Equity Ppt PowerPoint Presentation Outline Gridlines
This is a funding updates equity ppt powerpoint presentation outline gridlines. This is a one stage process. The stages in this process are shareholding pattern, percentage, business, marketing, success.
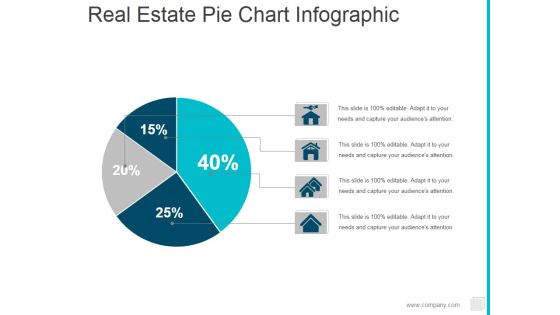
Real Estate Pie Chart Infographic Ppt PowerPoint Presentation Ideas Shapes
This is a real estate pie chart infographic ppt powerpoint presentation ideas shapes. This is a four stage process. The stages in this process are pie, finance, marketing, percentage.

Bar Graph Ppt PowerPoint Presentation Gallery Skills
This is a bar graph ppt powerpoint presentation gallery skills. This is a four stage process. The stages in this process are in percentage, bar graph, business, marketing, product.

Bar Chart Ppt PowerPoint Presentation Pictures Background Image
This is a bar chart ppt powerpoint presentation pictures background image. This is a seven stage process. The stages in this process are financial years, sales in percentage, graph, business.

Funding Updates Equity Ppt PowerPoint Presentation Portfolio Inspiration
This is a funding updates equity ppt powerpoint presentation portfolio inspiration. This is a two stage process. The stages in this process are shareholding pattern, total shares, percentage, shareholder.

Area Chart Ppt Powerpoint Presentation File Show
This is a area chart ppt powerpoint presentation file show. This is a two stage process. The stages in this process are sales in percentage, financial year, product, financial, business.

Resource Capacity Planning Template 1 Ppt PowerPoint Presentation Gallery Vector
This is a resource capacity planning template 1 ppt powerpoint presentation gallery vector. This is a four stage process. The stages in this process are percentage, finance, business, marketing.

Resource Capacity Planning Template 2 Ppt PowerPoint Presentation Show Maker
This is a resource capacity planning template 2 ppt powerpoint presentation show maker. This is a four stage process. The stages in this process are pie, percentage, finance, business, marketing.

Area Chart Ppt PowerPoint Presentation Layouts Graphics Example
This is a area chart ppt powerpoint presentation layouts graphics example. This is a two stage process. The stages in this process are sales in percentage, financial year, business, marketing, presentation.

Bubble Chart Ppt PowerPoint Presentation Layouts Design Ideas
This is a bubble chart ppt powerpoint presentation layouts design ideas. This is a eight stage process. The stages in this process are in percentage, profit, bubble chart, business, marketing.

Clustered Column Ppt PowerPoint Presentation Icon Design Inspiration
This is a clustered column ppt powerpoint presentation icon design inspiration. This is a two stage process. The stages in this process are product, financial year, sales in percentage, clustered column.

Production And Operation Cost Analysis Ppt PowerPoint Presentation Slide
This is a production and operation cost analysis ppt powerpoint presentation slide. This is a three stage process. The stages in this process are cost item, percentage, raw materials, consumables, transportation.
Resource Capacity Planning Template 2 Ppt PowerPoint Presentation Icon Rules
This is a resource capacity planning template 2 ppt powerpoint presentation icon rules. This is a four stage process. The stages in this process are icons, strategy, finance, percentage, business.
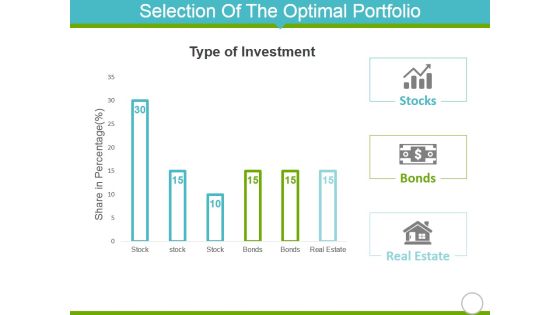
Selection Of The Optimal Portfolio Template 1 Ppt PowerPoint Presentation Model Themes
This is a selection of the optimal portfolio template 1 ppt powerpoint presentation model themes. This is a six stage process. The stages in this process are share in percentage, stock, bonds, real estate, types of investment.
Selection Of The Optimal Portfolio Template 2 Ppt PowerPoint Presentation Icon Introduction
This is a selection of the optimal portfolio template 2 ppt powerpoint presentation icon introduction. This is a three stage process. The stages in this process are real estate, stocks, bonds, percentage, finance.

 Home
Home