Percentage Progress

Area Chart Ppt PowerPoint Presentation Icon Brochure
This is a area chart ppt powerpoint presentation icon brochure. This is a two stage process. The stages in this process are product, sales in percentage, growth, success.
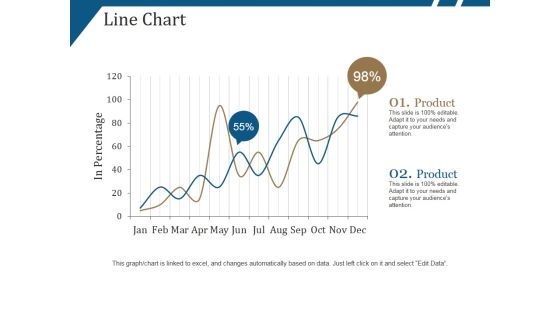
Line Chart Ppt PowerPoint Presentation Portfolio Show
This is a line chart ppt powerpoint presentation portfolio show. This is a two stage process. The stages in this process are product, in percentage, growth, success.
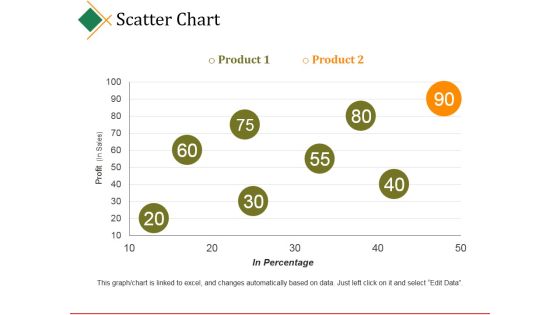
Scatter Chart Ppt PowerPoint Presentation Model
This is a scatter chart ppt powerpoint presentation model. This is a two stage process. The stages in this process are business, product, profit, in percentage, business.

Overall Revenue Analysis Bar Chart Powerpoint Slide Information
This is a overall revenue analysis bar chart powerpoint slide information. This is a nine stage process. The stages in this process are finance, success, business, marketing, percentage.
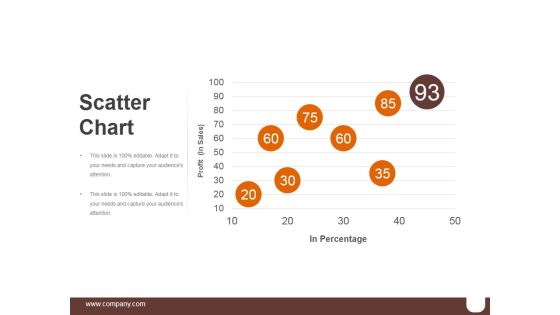
Scatter Chart Ppt PowerPoint Presentation Graphics
This is a scatter chart ppt powerpoint presentation graphics. This is a five stage process. The stages in this process are business, marketing, percentage, success, finance.
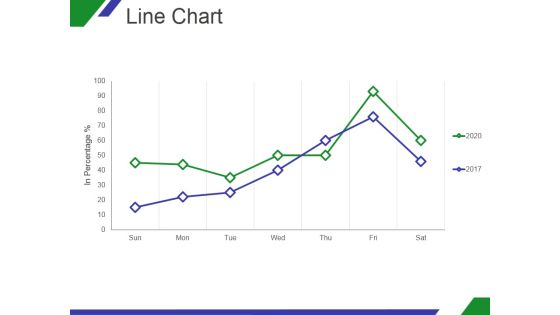
Line Chart Ppt PowerPoint Presentation Shapes
This is a line chart ppt powerpoint presentation shapes. This is a two stage process. The stages in this process are growth, in percentage, sun, mon, tue, wed.

Line Chart Ppt PowerPoint Presentation Pictures Ideas
This is a line chart ppt powerpoint presentation pictures ideas. This is a two stage process. The stages in this process are in millions, percentage, finance, product, growth.

Column Chart Ppt PowerPoint Presentation Infographics Model
This is a column chart ppt powerpoint presentation infographics model. This is a two stage process. The stages in this process are bar graph, growth, product, percentage, year.
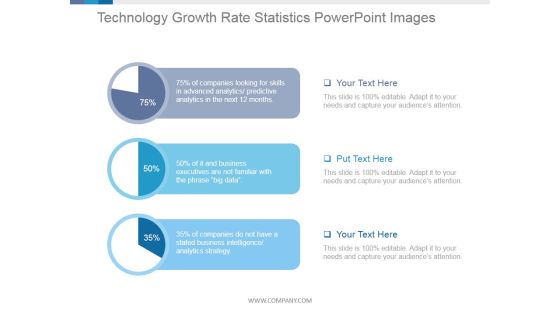
Technology Growth Rate Statistics Ppt PowerPoint Presentation Deck
This is a technology growth rate statistics ppt powerpoint presentation deck. This is a three stage process. The stages in this process are percentage, finance, marketing, business, marketing.

Clustered Bar Ppt PowerPoint Presentation Inspiration
This is a clustered bar ppt powerpoint presentation inspiration. This is a five stage process. The stages in this process are bar graph, business, marketing, finance, percentage.

Clustered Column Ppt PowerPoint Presentation Infographic Template
This is a clustered column ppt powerpoint presentation infographic template. This is a two stage process. The stages in this process are finance, percentage, bar graph, business, marketing.
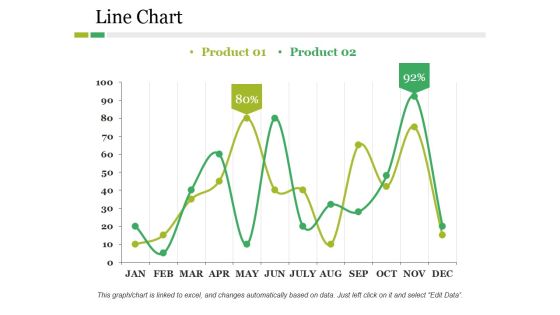
Line Chart Ppt PowerPoint Presentation Pictures Structure
This is a line chart ppt powerpoint presentation pictures structure. This is a two stage process. The stages in this process are product, business, line chart, finance, percentage.

Clustered Column Line Ppt PowerPoint Presentation Layout
This is a clustered column line ppt powerpoint presentation layout. This is a three stage process. The stages in this process are percentage, product, business, management.
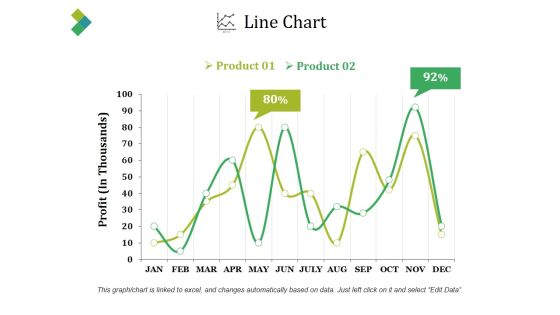
Line Chart Ppt PowerPoint Presentation Slides
This is a line chart ppt powerpoint presentation slides. This is a two stage process. The stages in this process are product, profit, percentage, finance, line chart.
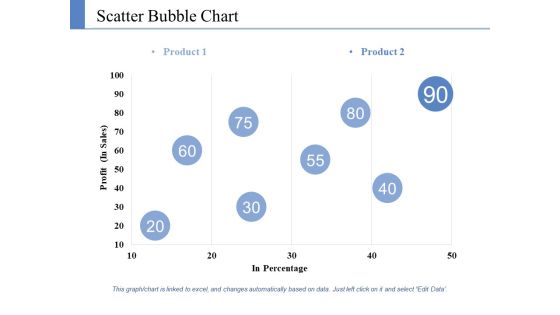
Scatter Bubble Chart Ppt PowerPoint Presentation Styles Information
This is a scatter bubble chart ppt powerpoint presentation styles information. This is a two stage process. The stages in this process are product, profit, in percentage.

Line Chart Ppt PowerPoint Presentation Layouts Templates
This is a line chart ppt powerpoint presentation layouts templates. This is a two stage process. The stages in this process are product, in percentage, in years.

Area Chart Ppt PowerPoint Presentation Layouts Gridlines
This is a area chart ppt powerpoint presentation layouts gridlines. This is a two stage process. The stages in this process are area chart, product, percentage, analysis, capture.
Line Chart Ppt PowerPoint Presentation Icon Inspiration
This is a line chart ppt powerpoint presentation icon inspiration. This is a two stage process. The stages in this process are product, financial years, sales in percentage.

Combo Chart Ppt PowerPoint Presentation Styles Format Ideas
This is a combo chart ppt powerpoint presentation styles format ideas. This is a three stage process. The stages in this process are percentage, product, marketing.

Scatter Chart Ppt PowerPoint Presentation Styles Show
This is a scatter chart ppt powerpoint presentation styles show. This is a nine stage process. The stages in this process are dollars, in percentage, finance, growth strategy.
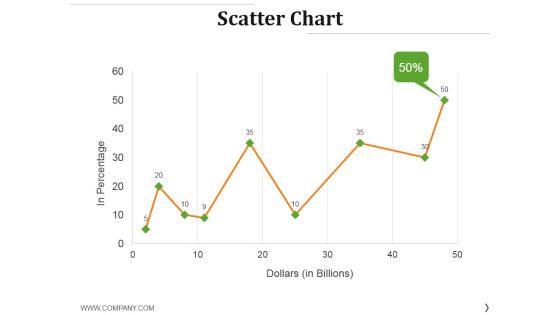
Scatter Chart Ppt PowerPoint Presentation Layouts Gridlines
This is a scatter chart ppt powerpoint presentation layouts gridlines. This is a nine stage process. The stages in this process are in percentage, dollars, growth, success, finance.

Scatter Chart Ppt PowerPoint Presentation Summary Deck
This is a scatter chart ppt powerpoint presentation summary deck. This is a nine stage process. The stages in this process are product, sales in percentage, growth, success.

Area Chart Ppt PowerPoint Presentation Pictures Designs
This is a area chart ppt powerpoint presentation pictures designs. This is a two stage process. The stages in this process are product, sales in percentage, growth, success.

Area Chart Ppt PowerPoint Presentation Model Guidelines
This is a area chart ppt powerpoint presentation model guidelines. This is a two stage process. The stages in this process are product, area chart, sales in percentage.
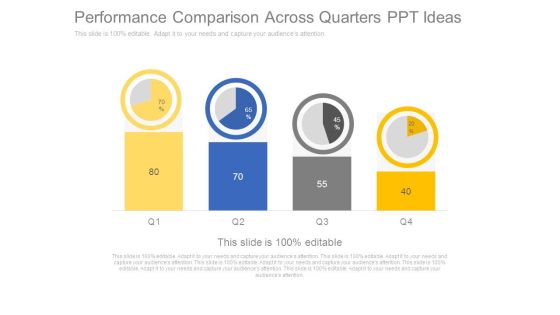
Performance Comparison Across Quarters Ppt Ideas
This is a performance comparison across quarters ppt ideas. This is a four stage process. The stages in this process are pie, growth, percentage, finance, business, marketing.

Clustered Column Line Ppt PowerPoint Presentation Backgrounds
This is a clustered column line ppt powerpoint presentation backgrounds. This is a four stage process. The stages in this process are fire, earthquake, axis title, in percentage.

Staked Line Chart Ppt PowerPoint Presentation Topics
This is a staked line chart ppt powerpoint presentation topics. This is a two stage process. The stages in this process are in percentage, product.

Area Chart Ppt PowerPoint Presentation Professional
This is a area chart ppt powerpoint presentation professional. This is a one stage process. The stages in this process are product, in percentage, jan, feb, mar, apr.
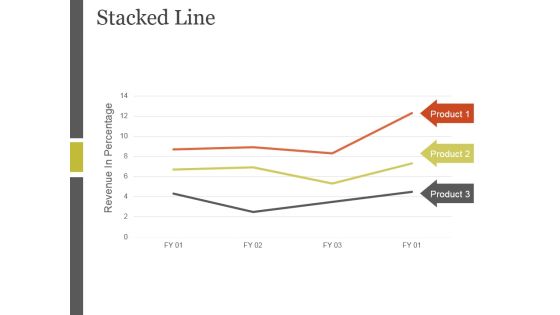
Stacked Line Ppt PowerPoint Presentation Inspiration
This is a stacked line ppt powerpoint presentation inspiration. This is a three stage process. The stages in this process are revenue in percentage, stacked line, product.

Area Chart Ppt PowerPoint Presentation Samples
This is a area chart ppt powerpoint presentation samples. This is a two stage process. The stages in this process are financial year, sales in percentage, jan, feb.

Area Chart Ppt PowerPoint Presentation Diagrams
This is a area chart ppt powerpoint presentation diagrams.This is a two stage process. The stages in this process are in percentage, area chart, product.

Area Chart Ppt PowerPoint Presentation Slides Graphics Design
This is a area chart ppt powerpoint presentation slides graphics design. This is a two stage process. The stages in this process are area chart, in percentage, product.

Line Chart Ppt PowerPoint Presentation Ideas Portfolio
This is a line chart ppt powerpoint presentation ideas portfolio. This is a two stage process. The stages in this process are line chart, in years, in percentage.
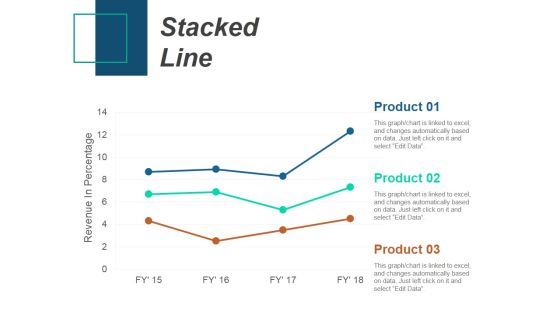
Stacked Line Ppt PowerPoint Presentation Infographics Slideshow
This is a stacked line ppt powerpoint presentation infographics slideshow. This is a three stage process. The stages in this process are stacked line, revenue in percentage, product.

Bar Chart Ppt PowerPoint Presentation Microsoft
This is a bar chart ppt powerpoint presentation microsoft. This is a eleven stage process. The stages in this process are sales in percentage, fy, graph, success, business.

Area Chart Ppt PowerPoint Presentation Picture
This is a area chart ppt powerpoint presentation picture. This is a two stage process. The stages in this process are product, in percentage, graph, management, business.
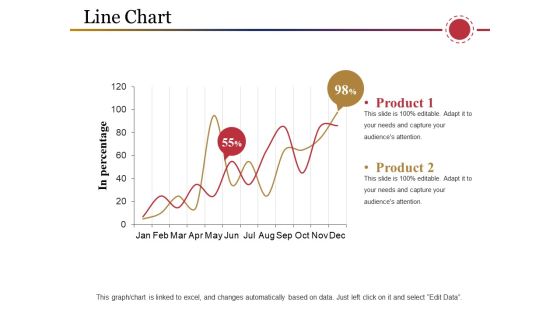
Line Chart Ppt PowerPoint Presentation Inspiration Samples
This is a line chart ppt powerpoint presentation inspiration samples. This is a two stage process. The stages in this process are product, in percentage, business, marketing, graph.

Marketing Roadmap Planner Ppt Ideas
This is a marketing roadmap planner ppt ideas. This is a eight stage process. The stages in this process are finance, percentage, planning, year, growth.

Combo Chart Ppt PowerPoint Presentation Information
This is a combo chart ppt powerpoint presentation information. This is a four stage process. The stages in this process are growth, product, in percentage.

Area Chart Ppt PowerPoint Presentation Designs
This is a area chart ppt powerpoint presentation designs. This is a two stage process. The stages in this process are product, graph, in percentage, growth, business.

Bar Chart Ppt PowerPoint Presentation Ideas
This is a bar chart ppt powerpoint presentation ideas. This is a nine stage process. The stages in this process are graph, in percentage, growth, business, marketing.

Scatter Chart Ppt PowerPoint Presentation Gallery Guide
This is a scatter chart ppt powerpoint presentation gallery guide. This is a one stage process. The stages in this process are profit, product, in percentage, growth, success.

Scatter Chart Ppt PowerPoint Presentation Ideas Professional
This is a scatter chart ppt powerpoint presentation ideas professional. This is a one stage process. The stages in this process are product, percentage, growth, success, line graph.

Column Chart Ppt PowerPoint Presentation Professional Template
This is a column chart ppt powerpoint presentation professional template. This is a two stage process. The stages in this process are product, percentage, finance, bar graph, growth.

Stacked Line Chart Ppt PowerPoint Presentation Styles Graphics
This is a stacked line chart ppt powerpoint presentation styles graphics. This is a two stage process. The stages in this process are product, year, profit, percentage, growth.

Comparison Ppt PowerPoint Presentation Show
This is a comparison ppt powerpoint presentation show. This is a five stage process. The stages in this process are compare, percentage, finance, people, ratio.

Dashboard Ppt PowerPoint Presentation Rules
This is a dashboard ppt powerpoint presentation rules. This is a three stage process. The stages in this process are dashboard, measurement, percentage, analysis, business.
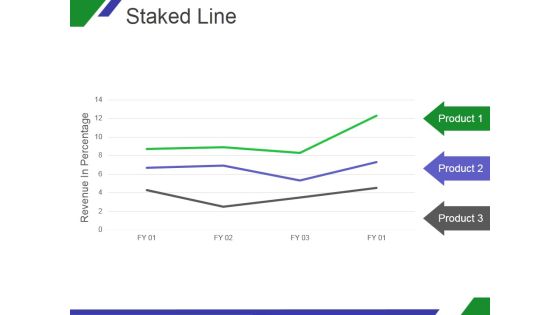
Staked Line Ppt PowerPoint Presentation Slide
This is a staked line ppt powerpoint presentation slide. This is a three stage process. The stages in this process are revenue in percentage, product, business.

Line Chart Ppt PowerPoint Presentation Model
This is a line chart ppt powerpoint presentation model. This is a two stage process. The stages in this process are in percentage, product, business.

Stacked Line Ppt PowerPoint Presentation Guide
This is a stacked line ppt powerpoint presentation guide. This is a three stage process. The stages in this process are revenue in percentage, product.

Line Chart Ppt PowerPoint Presentation Ideas
This is a line chart ppt powerpoint presentation ideas. This is a two stage process. The stages in this process are marketing, in percentage, sun, mon, tue, wed.

Scatter Chart Ppt PowerPoint Presentation Outline
This is a scatter chart ppt powerpoint presentation outline. This is a five stage process. The stages in this process are business, marketing, graph, percentage, finance.

Key Evaluation Metrics Ppt PowerPoint Presentation Influencers
This is a key evaluation metrics ppt powerpoint presentation influencers. This is a five stage process. The stages in this process are icons, percentage, marketing, management.
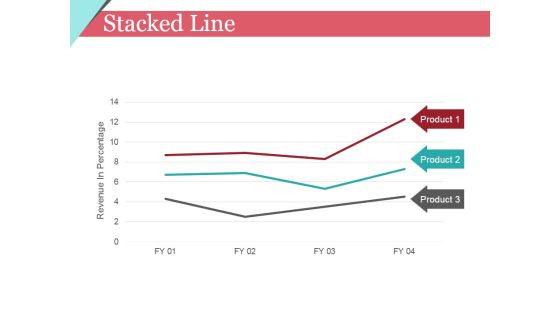
Stacked Line Ppt PowerPoint Presentation Gallery Display
This is a stacked line ppt powerpoint presentation gallery display. This is a three stage process. The stages in this process are revenue in percentage, product, graph, finance.

Area Chart Ppt PowerPoint Presentation Summary Deck
This is a area chart ppt powerpoint presentation summary deck. This is a two stage process. The stages in this process are sales in percentage, financial year.
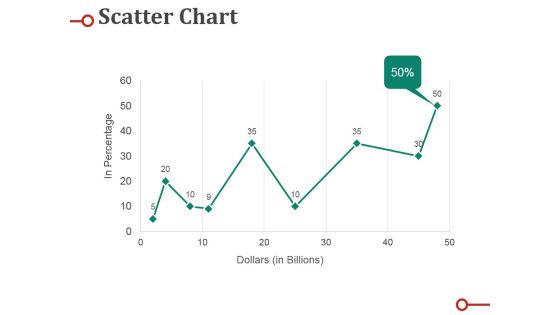
Scatter Chart Ppt PowerPoint Presentation Professional Deck
This is a scatter chart ppt powerpoint presentation professional deck. This is a nine stage process. The stages in this process are percentage, business, marketing, graph, line.

Stacked Column Ppt PowerPoint Presentation Model Good
This is a stacked column ppt powerpoint presentation model good. This is a nine stage process. The stages in this process are finance, percentage, business, product.

Bar Graph Ppt PowerPoint Presentation Layouts Gridlines
This is a bar graph ppt powerpoint presentation layouts gridlines. this is a three stage process. The stages in this process are product, percentage, business, marketing, management.

Area Chart Ppt PowerPoint Presentation Inspiration Slides
This is a area chart ppt powerpoint presentation inspiration slides. This is a two stage process. The stages in this process are area chart, product, in percentage.

Clustered Column Ppt PowerPoint Presentation Outline Slide Portrait
This is a clustered column ppt powerpoint presentation outline slide portrait. This is a two stage process. The stages in this process are product, finance, business, marketing, percentage.

Comparison Ppt PowerPoint Presentation Gallery Outfit
This is a comparison ppt powerpoint presentation gallery outfit. This is a two stage process. The stages in this process are comparison, finance, business, percentage, marketing.

Financial Ppt PowerPoint Presentation Gallery Templates
This is a financial ppt powerpoint presentation gallery templates. This is a three stage process. The stages in this process are circular, percentage, strategy, business, finance.
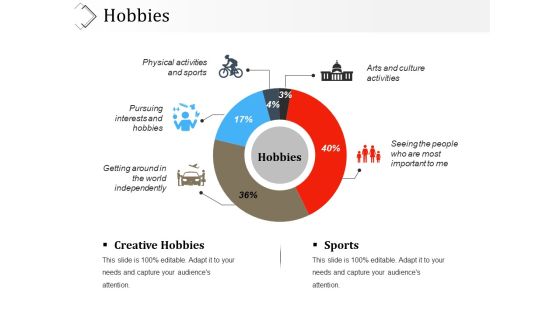
Hobbies Ppt PowerPoint Presentation Visual Aids Styles
This is a hobbies ppt powerpoint presentation visual aids styles. This is a five stage process. The stages in this process are icons, business, percentage, process, marketing.
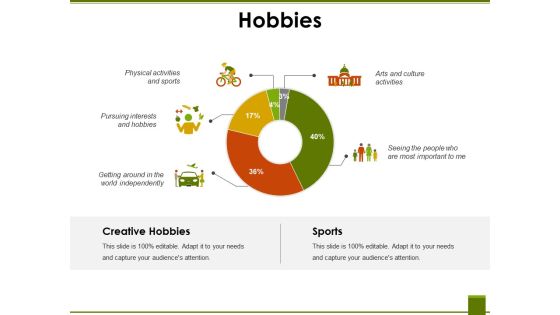
Hobbies Ppt PowerPoint Presentation Show Templates
This is a hobbies ppt powerpoint presentation show templates. This is a five stage process. The stages in this process are creative hobbies, sports, icons, business, percentage.
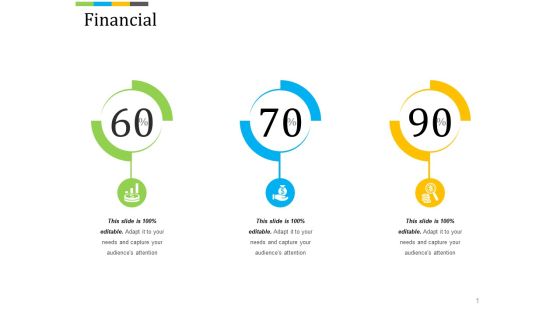
Financial Ppt PowerPoint Presentation Show Graphics Pictures
This is a financial ppt powerpoint presentation show graphics pictures. This is a three stage process. The stages in this process are business, finance, percentage, icons.
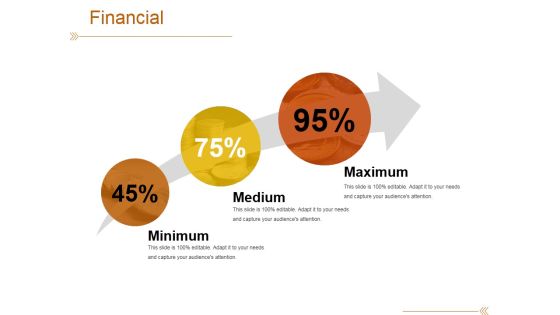
Financial Ppt PowerPoint Presentation Model Graphics Template
This is a financial ppt powerpoint presentation model graphics template. This is a three stage process. The stages in this process are minimum, medium, maximum, percentage, arrow.
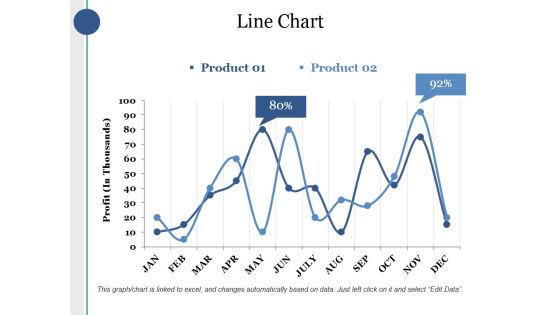
Line Chart Ppt PowerPoint Presentation Layouts Sample
This is a line chart ppt powerpoint presentation layouts sample. This is a two stage process. The stages in this process are product, profit, percentage, finance, business.

Comparison Ppt PowerPoint Presentation Ideas Guidelines
This is a comparison ppt powerpoint presentation ideas guidelines. This is a four stage process. The stages in this process are compare, percentage, finance, business, marketing.

Area Chart Ppt PowerPoint Presentation Icon Gallery
This is a area chart ppt powerpoint presentation icon gallery. This is a two stage process. The stages in this process are sales in percentage, product, bar graph.

Column Chart Ppt PowerPoint Presentation Professional Aids
This is a column chart ppt powerpoint presentation professional aids. This is a two stage process. The stages in this process are product, sales in percentage, financial years.

Line Chart Ppt PowerPoint Presentation Pictures Layout
This is a line chart ppt powerpoint presentation pictures layout. This is a two stage process. The stages in this process are product, financial years, sales in percentage.

Donut Pie Chart Ppt PowerPoint Presentation Show Outline
This is a donut pie chart ppt powerpoint presentation show outline. This is a six stage process. The stages in this process are business, marketing, percentage, chart, process.

Column Chart Ppt PowerPoint Presentation Gallery Layout
This is a column chart ppt powerpoint presentation gallery layout. This is a two stage process. The stages in this process are product, sales in percentage, year.
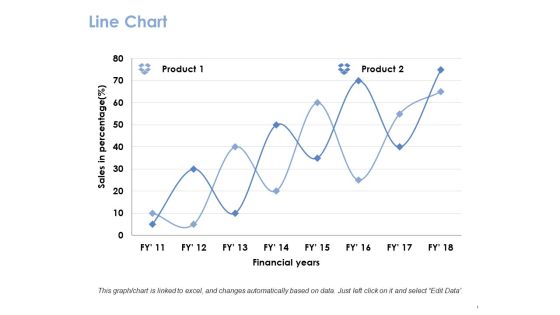
Line Chart Ppt PowerPoint Presentation Gallery Guide
This is a line chart ppt powerpoint presentation gallery guide. This is a two stage process. The stages in this process are product, financial years, sales in percentage.

Scatter Chart Ppt PowerPoint Presentation Show Sample
This is a scatter chart ppt powerpoint presentation show sample. This is a one stage process. The stages in this process are product, dollar, in percentage.

Bar Graph Ppt PowerPoint Presentation Ideas Display
This is a bar graph ppt powerpoint presentation ideas display. This is a two stage process. The stages in this process are product, sales in percentage, bar graph.

Area Chart Ppt PowerPoint Presentation Styles Brochure
This is a area chart ppt powerpoint presentation styles brochure. This is a two stage process. The stages in this process are product, financial years, in percentage.

Bubble Chart Ppt PowerPoint Presentation Layouts Demonstration
This is a bubble chart ppt powerpoint presentation icon structure. This is a three stage process. The stages in this process are product, sales in percentage, bubble chart.

Area Graph Ppt PowerPoint Presentation Slides Ideas
This is a area graph ppt powerpoint presentation slides ideas. This is a two stage process. The stages in this process are sales in percentage, financial year, product.

Scatter Bubble Chart Ppt PowerPoint Presentation Summary Slides
This is a scatter bubble chart ppt powerpoint presentation summary slides. This is a one stage process. The stages in this process are product, profit, in percentage.

Area Chart Ppt PowerPoint Presentation Styles Professional
This is a area chart ppt powerpoint presentation styles professional. This is a two stage process. The stages in this process are sales in percentage, product, area chart.

Bubble Chart Ppt PowerPoint Presentation Outline Demonstration
This is a bubble chart ppt powerpoint presentation outline demonstration. This is a two stage process. The stages in this process are bubble chart, product, in percentage.

Area Chart Ppt PowerPoint Presentation Show Graphics
This is a area chart ppt powerpoint presentation show graphics. This is a three stage process. The stages in this process are percentage, product, marketing, management, business.

Combo Chart Ppt PowerPoint Presentation Slides Slideshow
This is a combo chart ppt powerpoint presentation slides slideshow. This is a three stage process. The stages in this process are percentage, product, marketing, management, business.

Column Chart Ppt PowerPoint Presentation Show Objects
This is a column chart ppt powerpoint presentation show objects. This is a two stage process. The stages in this process are percentage, product, business, management, marketing.

Column Chart Ppt PowerPoint Presentation Model Slideshow
This is a column chart ppt powerpoint presentation model slideshow. This is a two stage process. The stages in this process are percentage, product, business, marketing.

Combo Chart Ppt PowerPoint Presentation Styles Topics
This is a combo chart ppt powerpoint presentation styles topics. This is a three stage process. The stages in this process are percentage, product, business, management, marketing.

Clustered Column Product Ppt PowerPoint Presentation Show Guidelines
This is a clustered column product ppt powerpoint presentation show guidelines. This is a four stage process. The stages in this process are business, management, marketing, percentage, product.

Column Chart Financial Ppt PowerPoint Presentation Information
This is a column chart financial ppt powerpoint presentation information. This is a three stage process. The stages in this process are business, management, marketing, percentage, product.

Column Chart Marketing Ppt PowerPoint Presentation Summary Images
This is a column chart marketing ppt powerpoint presentation summary images. This is a three stage process. The stages in this process are business, management, marketing, product, percentage.

Column Chart Ppt PowerPoint Presentation Slides Clipart
This is a column chart ppt powerpoint presentation slides clipart. This is a two stage process. The stages in this process are business, management, marketing, percentage, product.

Financial Ppt PowerPoint Presentation Infographic Template
This is a financial ppt powerpoint presentation infographic template. This is a three stage process. The stages in this process are beginner, advanced, professional, finance, percentage.
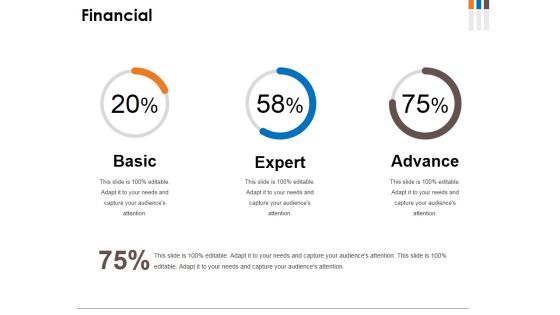
Financial Ppt PowerPoint Presentation Infographics Portfolio
This is a financial ppt powerpoint presentation infographics portfolio. This is a three stage process. The stages in this process are basic, expert, advance, percentage, finance.
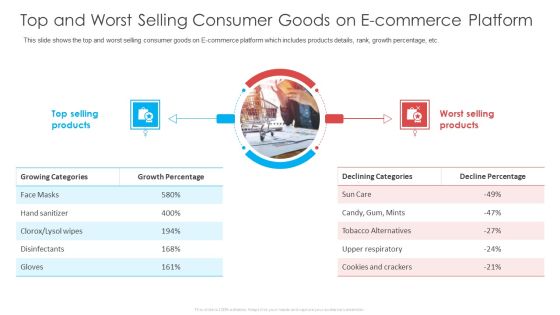
Top And Worst Selling Consumer Goods On E Commerce Platform Ppt File Outline PDF
This slide shows the top and worst selling consumer goods on E-commerce platform which includes products details, rank, growth percentage, etc. Deliver an awe-inspiring pitch with this creative top and worst selling consumer goods on e commerce platform ppt file outline pdf bundle. Topics like growth percentage, decline percentage, selling products can be discussed with this completely editable template. It is available for immediate download depending on the needs and requirements of the user.

Big Data Database Comparison Ppt PowerPoint Presentation Outline
This is a big data database comparison ppt powerpoint presentation outline. This is a four stage process. The stages in this process are business, finance, management, percentage, growth.

Comparison Ppt PowerPoint Presentation Layouts Gridlines
This is a comparison ppt powerpoint presentation layouts gridlines. This is a three stage process. The stages in this process are year, growth, success, percentage, finance.
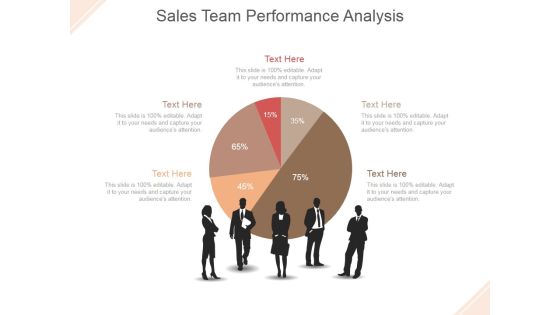
Sales Team Performance Analysis Ppt PowerPoint Presentation Inspiration
This is a sales team performance analysis ppt powerpoint presentation inspiration. This is a five stage process. The stage in this process are pie, finance, people, communication, percentage.
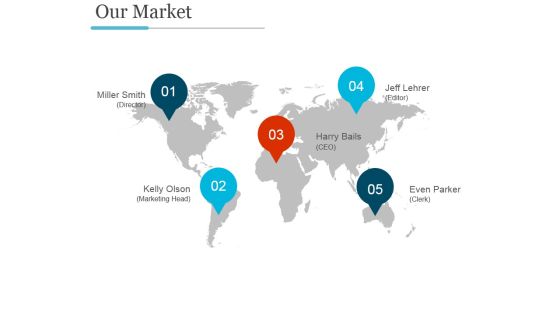
Our Market Template Ppt PowerPoint Presentation Design Templates
This is a our market template ppt powerpoint presentation design templates. This is a four stage process. The stages in this process are pie, percentage, finance, division, analysis.

Clustered Column Ppt PowerPoint Presentation Ideas Show
This is a clustered column ppt powerpoint presentation ideas show. This is a two stage process. The stages in this process are product, percentage, finance, business, bar graph.

Clustered Bar Ppt PowerPoint Presentation Layouts Professional
This is a clustered bar ppt powerpoint presentation layouts professional. This is a two stage process. The stages in this process are clustered bar, product, profit, percentage.

Core Strategic Audience Powerpoint Graphics
This is a core strategic audience powerpoint graphics. This is a six stage process. The stages in this process are circular, growth, business, marketing, percentage.

Core Strategic Circular Diagram Powerpoint Images
This is a core strategic circular diagram powerpoint images. This is a six stage process. The stages in this process are circular, growth, business, marketing, percentage.
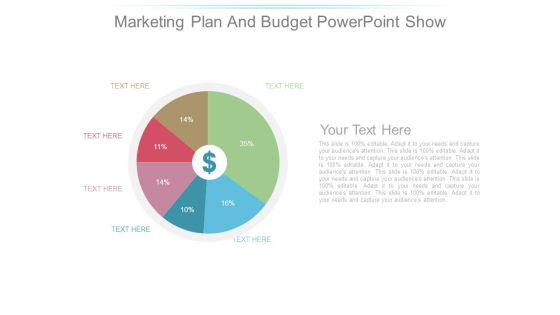
Marketing Plan And Budget Powerpoint Show
This is a marketing plan and budget powerpoint show. This is a six stage process. The stages in this process are growth, business, marketing, percentage, currency.
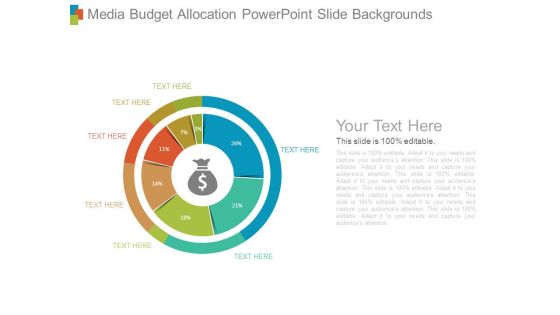
Media Budget Allocation Powerpoint Slide Backgrounds
This is a media budget allocation powerpoint slide backgrounds. This is a seven stage process. The stages in this process are growth, business, marketing, percentage, currency.
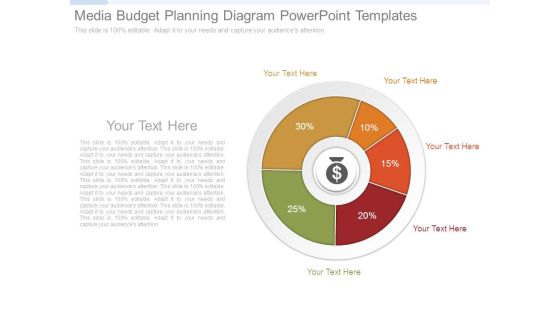
Media Budget Planning Diagram Powerpoint Templates
This is a media budget planning diagram powerpoint templates. This is a six stage process. The stages in this process are growth, business, marketing, percentage.

Possible Target Audiences Ppt Diagrams
This is a possible target audiences ppt diagrams. This is a seven stage process. The stages in this process are growth, business, marketing, percentage.
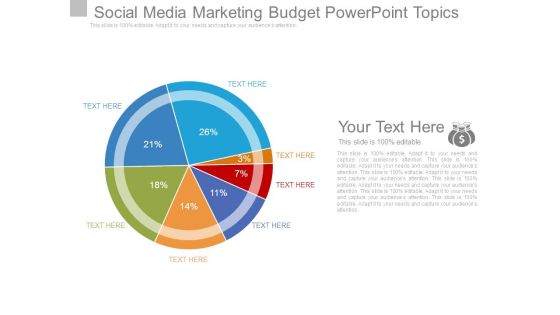
Social Media Marketing Budget Powerpoint Topics
This is a social media marketing budget powerpoint topics. This is a seven stage process. The stages in this process are pie, growth, business, marketing, percentage.

Combo Chart Ppt PowerPoint Presentation Model Grid
This is a combo chart ppt powerpoint presentation model grid. This is a three stage process. The stages in this process are growth, product, percentage, marketing.

Area Chart Ppt PowerPoint Presentation Pictures Graphics Design
This is a area chart ppt powerpoint presentation pictures graphics design. This is a two stage process. The stages in this process are charts, success, finance, percentage, growth.

Comparison Ppt PowerPoint Presentation Visuals
This is a comparison ppt powerpoint presentation visuals. This is a two stage process. The stages in this process are percentage, business, marketing, strategy, success.

Key Evaluation Metrics Ppt PowerPoint Presentation Files
This is a key evaluation metrics ppt powerpoint presentation files. This is a five stage process. The stages in this process are icons, business, management, success, percentage.
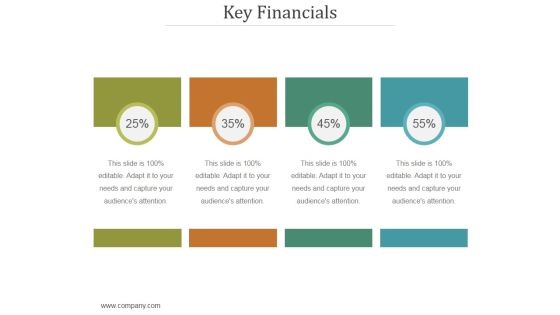
Key Financials Ppt PowerPoint Presentation Clipart
This is a key financials ppt powerpoint presentation clipart. This is a four stage process. The stages in this process are percentage, finance, success, growth, analysis.
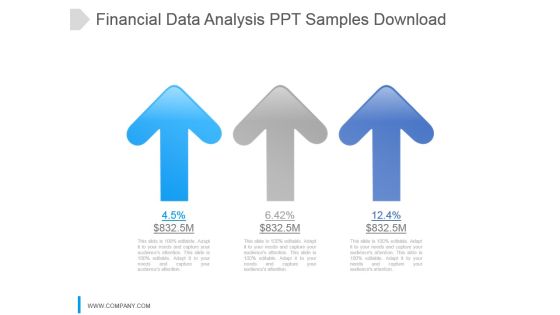
Financial Data Analysis Ppt Samples Download
This is a financial data analysis ppt samples download. This is a three stage process. The stages in this process are arrow, growth, percentage, finance, success.

Bar Graph Ppt PowerPoint Presentation Layouts Pictures
This is a bar graph ppt powerpoint presentation layouts pictures. This is a four stage process. The stages in this process are fire, earthquake, axis title, in percentage.

Combo Chart Ppt PowerPoint Presentation Portfolio Template
This is a combo chart ppt powerpoint presentation portfolio template. This is a three stage process. The stages in this process are product, business, marketing, combo chart, percentage.
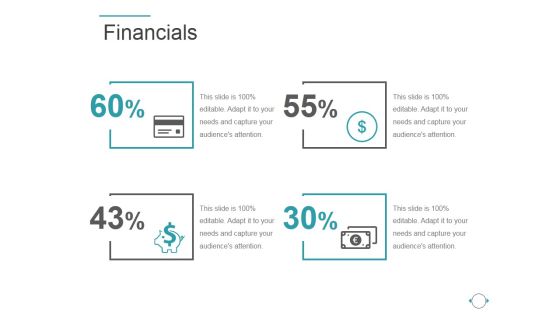
Financials Ppt PowerPoint Presentation Clipart
This is a financials ppt powerpoint presentation clipart. This is a four stage process. The stages in this process are icons, percentage, finance, success, strategy.
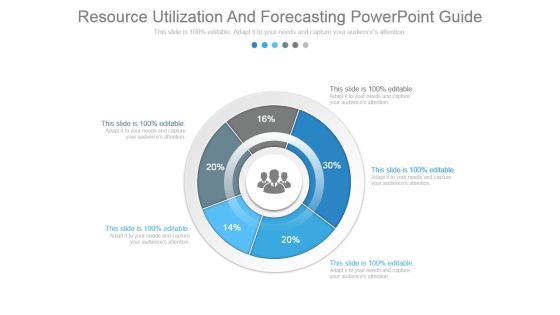
Resource Utilization And Forecasting Powerpoint Guide
This is a resource utilization and forecasting powerpoint guide. This is a five stage process. The stages in this process are donut, business, marketing, growth, percentage.

Financial Performance Analysis Data Ppt PowerPoint Presentation Topics
This is a financial performance analysis data ppt powerpoint presentation topics. This is a three stage process. The stages in this process are finance, percentage, marketing, business, growth.
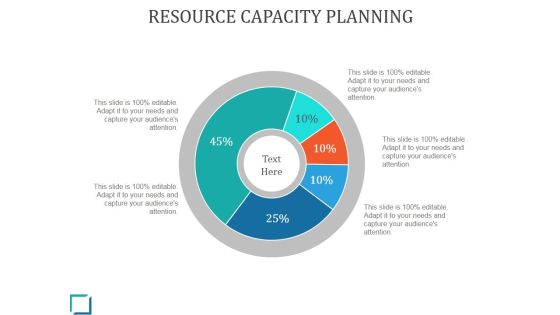
Resource Capacity Planning Ppt PowerPoint Presentation Example
This is a resource capacity planning ppt powerpoint presentation example. This is a five stage process. The stages in this process are pie, percentage, finance, management, growth.

Financial Ppt PowerPoint Presentation Ideas Show
This is a financial ppt powerpoint presentation ideas show. This is a four stage process. The stages in this process are percentage, finance, business, marketing, growth.
 Home
Home