Percentage Progress

Competitor Positioning Ppt PowerPoint Presentation Professional Picture
This is a competitor positioning ppt powerpoint presentation professional picture. This is a two stage process. The stages in this process are company growth, percentage, market growth , business.

Stacked Area Clustered Column Ppt PowerPoint Presentation Styles Gridlines
This is a stacked area clustered column ppt powerpoint presentation styles gridlines. This is a three stage process. The stages in this process are dollars, in percentage, finance, growth strategy, business, strategy.
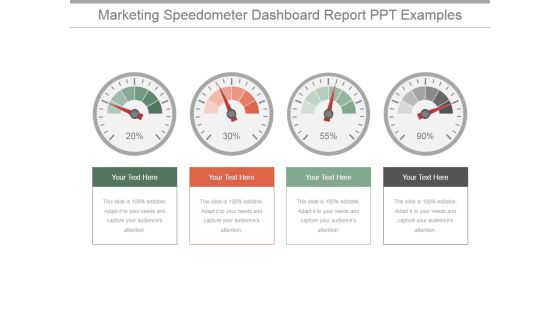
Marketing Speedometer Dashboard Report Ppt PowerPoint Presentation Designs Download
This is a marketing speedometer dashboard report ppt powerpoint presentation designs download. This is a four stage process. The stages in this process are dashboard, measurement, percentage, business, finance.

Comparison Of Prices Ppt PowerPoint Presentation Designs Download
This is a comparison of prices ppt powerpoint presentation designs download. This is a two stage process. The stages in this process are comparison of prices, marketing, in percentage, bar graph, business.
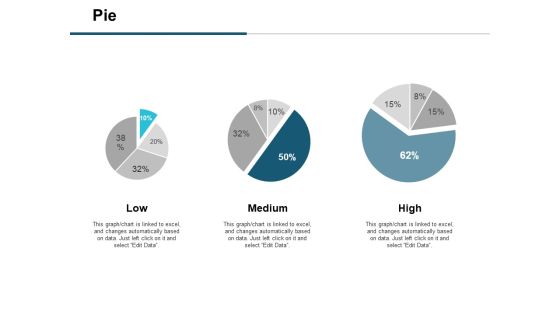
Pie Financial Ppt PowerPoint Presentation Infographics Master Slide
This is a pie financial ppt powerpoint presentation infographics master slide. This is a three stage process. The stages in this process are business strategy, marketing, management, percentage, pie, financial.

Resource Capacity Planning Template 2 Ppt PowerPoint Presentation Show
This is a resource capacity planning template 2 ppt powerpoint presentation show. This is a four stage process. The stages in this process are percentage, finance, donut, growth, success.

Bar Graph Ppt PowerPoint Presentation File Slides
This is a bar graph ppt powerpoint presentation file slides. This is a three stage process. The stages in this process are product, sales in percentage, bar graph, growth, success.

Competitor Positioning Ppt PowerPoint Presentation Show Example Introduction
This is a competitor positioning ppt powerpoint presentation show example introduction. This is a two stage process. The stages in this process are market growth, company growth, business, finance, percentage.

Competitor Positioning Ppt PowerPoint Presentation Gallery Portrait
This is a competitor positioning ppt powerpoint presentation gallery portrait. This is a two stage process. The stages in this process are company growth, market growth, business, marketing, percentage.

Big Data Opportunities And Challenges In Construction Ppt PowerPoint Presentation Outline
This is a big data opportunities and challenges in construction ppt powerpoint presentation outline. This is a three stage process. The stages in this process are finance, management, growth, percentage, business.

Portfolio Evaluation Template 2 Ppt PowerPoint Presentation Inspiration Information
This is a portfolio evaluation template 2 ppt powerpoint presentation inspiration information. This is a five stage process. The stages in this process are pie, finance, percentage, business, growth.

Clustered Column Line Ppt PowerPoint Presentation Slide
This is a clustered column line ppt powerpoint presentation slide. This is a three stage process. The stages in this process are bar graph, growth, finance, product, sales in percentage.
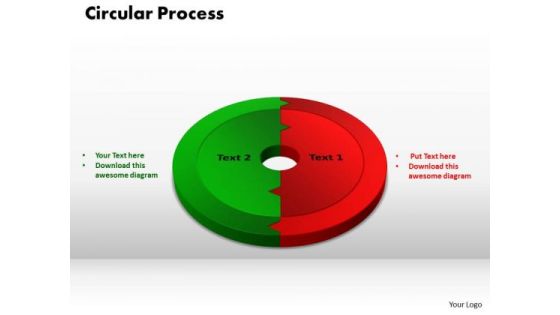
PowerPoint Design Slides Circular Process Business Ppt Backgrounds
PowerPoint Design Slides Circular Process Business PPT Backgrounds-This PowerPoint slide has circular process chart divided two parts that can be used for comparison. You can easily edit the size, percentage, text and color.-PowerPoint Design Slides Circular Process Business PPT Backgrounds
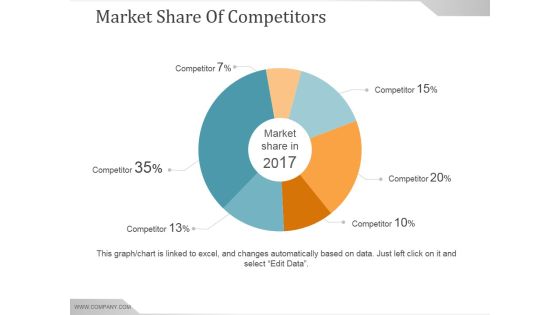
Market Share Of Competitors Ppt PowerPoint Presentation Slides
This is a market share of competitors ppt powerpoint presentation slides. This is a six stage process. The stages in this process are market share in, competitor, pie, finance, percentage.
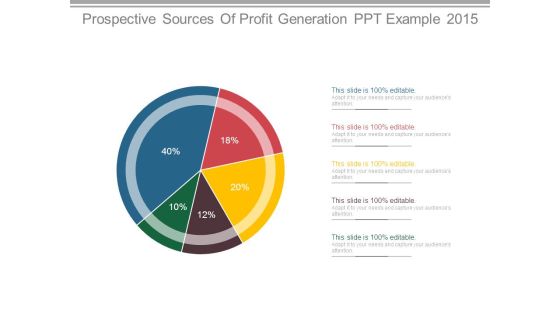
Prospective Sources Of Profit Generation Ppt Example 2015
This is a prospective sources of profit generation ppt example 2015. This is a five stage process. The stages in this process are finance, success, business, marketing, percentage, pie.
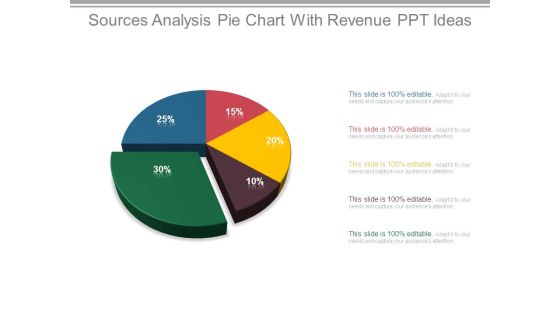
Sources Analysis Pie Chart With Revenue Ppt Ideas
This is a sources analysis pie chart with revenue ppt ideas. This is a five stage process. The stages in this process are finance, success, business, marketing, percentage, pie chart.
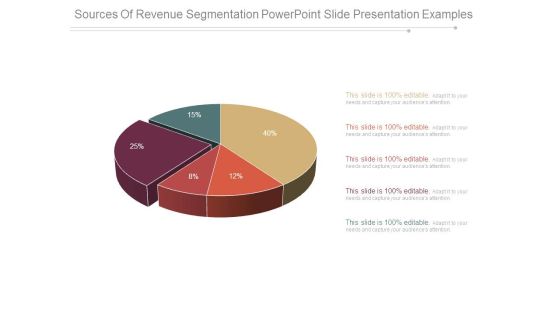
Sources Of Revenue Segmentation Powerpoint Slide Presentation Examples
This is a sources of revenue segmentation powerpoint slide presentation examples. This is a five stage process. The stages in this process are finance, success, business, marketing, percentage, pie chart.

Pie Chart For Current Sources Of Profit Ppt Background Template
This is a pie chart for current sources of profit ppt background template. This is a five stage process. The stages in this process are finance, success, business, marketing, percentage, donut.
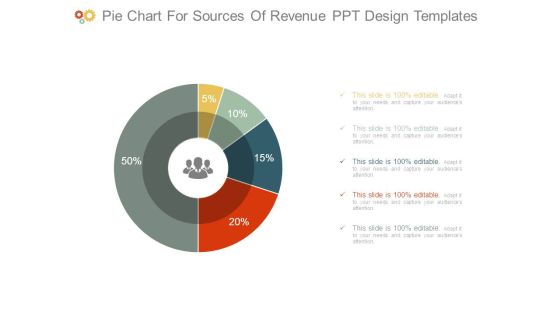
Pie Chart For Sources Of Revenue Ppt Design Templates
This is a pie chart for sources of revenue ppt design templates. This is a five stage process. The stages in this process are finance, success, business, marketing, percentage, donut.
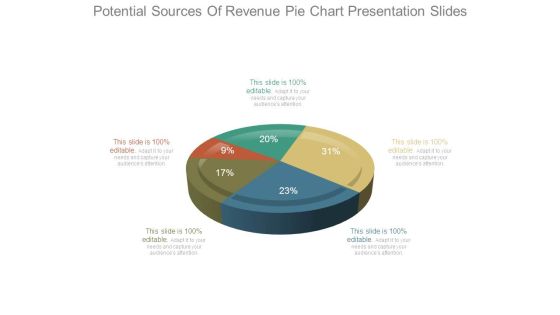
Potential Sources Of Revenue Pie Chart Presentation Slides
This is a potential sources of revenue pie chart presentation slides. This is a five stage process. The stages in this process are finance, success, business, marketing, percentage, pie.

Meet Our Awesome Team Ppt PowerPoint Presentation Styles Graphics Design
This is a meet our awesome team ppt powerpoint presentation styles graphics design. This is a one stage process. The stages in this process are strategy, management, finance, business, percentage.

Magnifying Glass For Sales Performance Review Ppt PowerPoint Presentation Model
This is a magnifying glass for sales performance review ppt powerpoint presentation model. This is a four stage process. The stage in this process are magnifier glass, pie, finance, percentage, research.

Brand Performance Dashboard Ppt PowerPoint Presentation Show Graphic Tips
This is a brand performance dashboard ppt powerpoint presentation show graphic tips. This is a three stage process. The stages in this process are customer recognition, enhanced sales, competitive edge, dashboard, business, percentage.
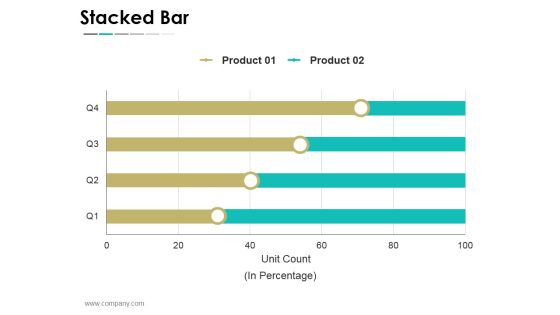
Stacked Bar Ppt PowerPoint Presentation Infographics Graphics
This is a stacked bar ppt powerpoint presentation infographics graphics. This is a four stage process. The stages in this process are business, strategy, marketing, success, unit count, in percentage.

Clustered Column Line Ppt PowerPoint Presentation File Examples
This is a clustered column line ppt powerpoint presentation file examples. This is a three stage process. The stages in this process are sales in percentage, product, business, marketing, success.
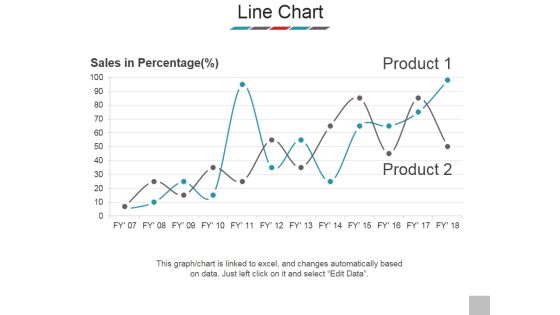
Line Chart Ppt PowerPoint Presentation Outline Samples
This is a line chart ppt powerpoint presentation outline samples. This is a two stage process. The stages in this process are sales in percentage, product, business, marketing, success.

Bar Graph Ppt PowerPoint Presentation Slides Visual Aids
This is a bar graph ppt powerpoint presentation slides visual aids. This is a three stage process. The stages in this process are sales in percentage, bar graph, business, marketing, success.

Clustered Column Line Ppt PowerPoint Presentation Outline Infographic Template
This is a clustered column line ppt powerpoint presentation outline infographic template. This is a three stage process. The stages in this process are product, sales in percentage, business, marketing, success.

Funding Updates Equity Ppt PowerPoint Presentation Outline Gridlines
This is a funding updates equity ppt powerpoint presentation outline gridlines. This is a one stage process. The stages in this process are shareholding pattern, percentage, business, marketing, success.

Pie Chart Ppt PowerPoint Presentation Infographics Show
This is a pie chart ppt powerpoint presentation infographics show. This is a three stage process. The stages in this process are process, percentage, business, marketing, success, pie chart.

Time Management Techniques For Successful Project Parameters To Measure Timeliness Diagrams PDF
This slide shows the parameters to measure timeliness of project activities which includes cycle time, time spent, on-time completion percentage, number of adjustments, planned hours vs. actual time spent, etc.Deliver an awe inspiring pitch with this creative Time Management Techniques For Successful Project Parameters To Measure Timeliness Diagrams PDF bundle. Topics like Development Process, Completion Percentage, Adjustments Project can be discussed with this completely editable template. It is available for immediate download depending on the needs and requirements of the user.
Funding Request And Use Of Funds Template 1 Ppt PowerPoint Presentation Icon Background
This is a funding request and use of funds template 1 ppt powerpoint presentation icon background. This is a three stage process. The stages in this process are key hires, marketing, product development, percentage, process.

Task Distribution Ppt PowerPoint Presentation Design Ideas
This is a task distribution ppt powerpoint presentation design ideas. This is a eight stage process. The stages in this process are outside service providers, research and development, product, divisions, percentage.

Product Development Status Update With Due Date Graphics PDF
The following slide showcases status of various products to track progress. The table also covers phases , responsible person, due date and completion percentage. Pitch your topic with ease and precision using this Product Development Status Update With Due Date Graphics PDF. This layout presents information on Design, Implementation, Marketing. It is also available for immediate download and adjustment. So, changes can be made in the color, design, graphics or any other component to create a unique layout.

Analyzing The Impact Of Russia Ukraine Conflict On Agriculture Sector Increasing Global Wheat Professional PDF
This slide covers graphical representation of wheat price inflation due to the Russia Ukraine conflict. It includes insights such as global wheat production percentage, global wheat export percentage, supply chain disruptions due to suspended operations, and increase in price on the Chicago board of trade. Deliver an awe inspiring pitch with this creative analyzing the impact of russia ukraine conflict on agriculture sector increasing global wheat professional pdf bundle. Topics like russia represent around, global wheat production, suspended commercial operations can be discussed with this completely editable template. It is available for immediate download depending on the needs and requirements of the user.

Project Time Management To Enhance Productivity Parameters To Measure Timeliness Of Project Activities Diagrams PDF
This slide shows the parameters to measure timeliness of project activities which includes cycle time, time spent, on-time completion percentage, number of adjustments, planned hours vs. actual time spent, etc.Deliver an awe inspiring pitch with this creative Project Time Management To Enhance Productivity Parameters To Measure Timeliness Of Project Activities Diagrams PDF bundle. Topics like Development Process, Completion Percentage, Completion Allocated can be discussed with this completely editable template. It is available for immediate download depending on the needs and requirements of the user.
Kpis To Measure Success Rate Of Employee Virtual Onboarding Brochure PDF
The slide showcases key performance metrics to evaluate success rate of employee remote onboarding in an organization. It contains KPIs such as new-hire satisfaction, retention, training completion rate, time to productivity etc. Along with description, target percentage, actual percentage, deviation. Showcasing this set of slides titled Kpis To Measure Success Rate Of Employee Virtual Onboarding Brochure PDF. The topics addressed in these templates are Retention, Training Completion Rate, Engagement Rates. All the content presented in this PPT design is completely editable. Download it and make adjustments in color, background, font etc. as per your unique business setting.

Business Chart Showing Economic Growth Trend Ppt PowerPoint Presentation Infographic Template Format
Presenting this set of slides with name business chart showing economic growth trend ppt powerpoint presentation infographic template format. The topics discussed in these slides are gdp growth rate, percentage. This is a completely editable PowerPoint presentation and is available for immediate download. Download now and impress your audience.
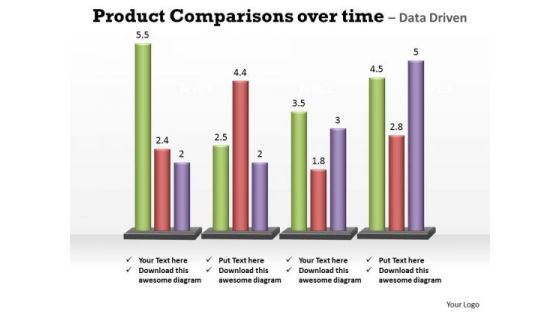
Business Marketing PowerPoint Templates Business Product Comparisons Over Time Ppt Slides
Business Marketing PowerPoint Templates Business product comparisons over time PPT Slides--This chart is useful for showing data changes over a period of time or for illustrating comparisons among items. -Business Marketing PowerPoint Templates Business product comparison over time PPT Slides-This ppt can be used for concepts relating to-chart,, graph, growth, investment, , market, percentage, , presentation report, results, statistics, stock, success and business.

Business Editable PowerPoint Templates Business Beveled Column Chart Ppt Slides
Business Editable PowerPoint Templates Business beveled column chart PPT Slides-This PowerPoint slide is a data driven Columns Chart. The number of columns depend on the data.-Business Editable PowerPoint Templates Business beveled column chart PPT Slides-This ppt can be used for concepts relating to-chart,, graph, growth, investment, , market, percentage, , presentation report, results, statistics, stock, success and business.

Business Education PowerPoint Templates Business Bar Graph Data Driven Ppt Slides
Business Education PowerPoint Templates Business bar graph data driven PPT Slides-This PowerPoint slide is a data driven Columns Chart. The number of columns depend on the data.-Business Editable PowerPoint Templates Business beveled column chart PPT Slides-This ppt can be used for concepts relating to-chart,, graph, growth, investment, , market, percentage, , presentation report, results, statistics, stock, success and business.
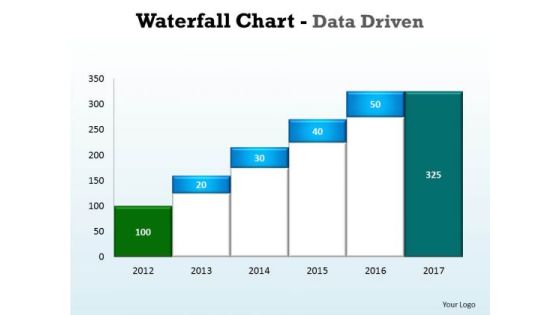
Business Graphic PowerPoint Templates Business Waterfall Chart Data Driven Ppt Slides
Business Graphic PowerPoint Templates Business waterfall chart data driven PPT Slides- This Water Fall chart can display continuous data over time, set against a common scale, and are therefore ideal for showing trends in data at equal intervals-This ppt can be used for concepts relating to-chart,, graph, growth, investment, , market, percentage, , presentation report, results, statistics, stock, success and business.

Business Operations Assessment Bad Debt Ppt Model Templates PDF
Deliver an awe-inspiring pitch with this creative business operations assessment bad debt ppt model templates pdf bundle. Topics like types bad debts, percentage, cash advances, loan given customers, credit given company can be discussed with this completely editable template. It is available for immediate download depending on the needs and requirements of the user.
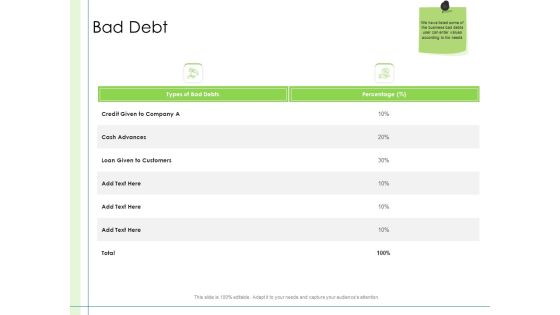
In Depth Business Assessment Bad Debt Ppt PowerPoint Presentation Professional Design Inspiration PDF
Deliver an awe-inspiring pitch with this creative in depth business assessment bad debt ppt powerpoint presentation professional design inspiration pdf bundle. Topics like types bad debts, percentage, cash advances, loan given customers, credit given company can be discussed with this completely editable template. It is available for immediate download depending on the needs and requirements of the user.

Administrative Regulation Bad Debt Ppt PowerPoint Presentation Outline Gridlines PDF
Deliver an awe-inspiring pitch with this creative administrative regulation bad debt ppt powerpoint presentation outline gridlines pdf bundle. Topics like types bad debts, percentage, cash advances, loan given customers, credit given company can be discussed with this completely editable template. It is available for immediate download depending on the needs and requirements of the user.

Dashboard For Successful FSM System Ppt Visual Aids Infographics PDF
Showcasing this set of slides titled dashboard for successful fsm system ppt visual aids infographics pdf. The topics addressed in these templates are resource percentage, duration compliance, priority. All the content presented in this PPT design is completely editable. Download it and make adjustments in color, background, font etc. as per your unique business setting.

Global Customer Relationship Management Software Market Pictures PDF
Presenting global customer relationship management software market pictures pdf to provide visual cues and insights. Share and navigate important information on five stages that need your due attention. This template can be used to pitch topics like forecasted percentage, global spending, projected crm market. In addtion, this PPT design contains high resolution images, graphics, etc, that are easily editable and available for immediate download.

Assessing The Impact Of COVID On Retail Business Segment Top And Worst Selling Consumer Goods Background PDF
Presenting this set of slides with name assessing the impact of covid on retail business segment top and worst selling consumer goods background pdf. The topics discussed in these slides are growth percentage, growing categories, sauce and seasoning mix, alcoholic beverage mixers. This is a completely editable PowerPoint presentation and is available for immediate download. Download now and impress your audience.
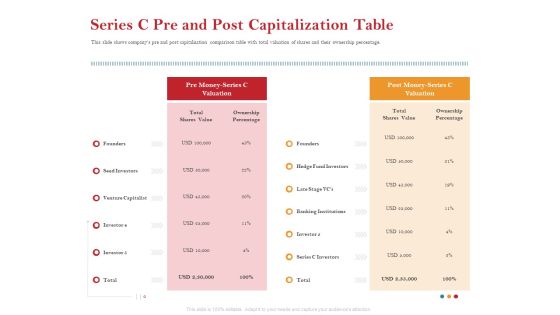
Pitch Deck For Raising Capital For Inorganic Growth Series C Pre And Post Capitalization Table Summary PDF
This slide shows companys pre and post capitalization comparison table with total valuation of shares and their ownership percentage. Deliver and pitch your topic in the best possible manner with this pitch deck for raising capital for inorganic growth series c pre and post capitalization table summary pdf. Use them to share invaluable insights on investors, valuation, venture capitalist, banking institutions and impress your audience. This template can be altered and modified as per your expectations. So, grab it now.

Cios Methodologies To Improve IT Spending Determine It Project Portfolio Management Microsoft PDF
This slide provides information regarding IT project portfolio management tracking dashboard including details about allocated budget across portfolios, used budget percentage, estimated vs. actual cost, etc. Deliver an awe inspiring pitch with this creative Cios Methodologies To Improve IT Spending Determine It Project Portfolio Management Microsoft PDF bundle. Topics like Return On Investment, Revenue, Break Down can be discussed with this completely editable template. It is available for immediate download depending on the needs and requirements of the user.
Improved Digital Expenditure Determine IT Project Portfolio Management Tracking Dashboard Designs PDF
This slide provides information regarding IT project portfolio management tracking dashboard including details about allocated budget across portfolios, used budget percentage, estimated vs. actual cost, etc. Deliver an awe inspiring pitch with this creative Improved Digital Expenditure Determine IT Project Portfolio Management Tracking Dashboard Designs PDF bundle. Topics like Allocated Budget, Budget Across, Allocated Budget can be discussed with this completely editable template. It is available for immediate download depending on the needs and requirements of the user.
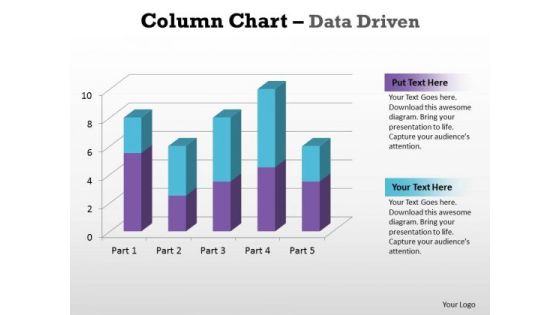
Business Graphic PowerPoint Templates Business Column Chart Data Driven Ppt Slides
Business Graphic PowerPoint Templates Business column chart data driven PPT Slides-With help of visual aids like this template you can capture the attention of the audience and make the presentation very interactive and lively.-Business Graphic PowerPoint Templates Business column chart data driven PPT Slides-This ppt can be used for concepts relating to-chart,, graph, growth, investment, , market, percentage, , presentation report, results, statistics, stock, success and business.
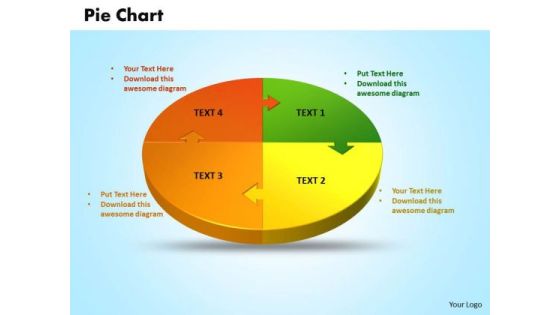
Business Editable PowerPoint Templates Business 3d Jigsaw Circular Pie Chart Ppt Slides
Business Chart PowerPoint Templates Business 3d jigsaw circular pie chart PPT Slides-PowerPoint Template shows Pie Chart with four sectors \\ Part of a series. -Business Chart PowerPoint Templates Business 3d jigsaw circular pie chart PPT Slides-This ppt can be used for concepts relating to-chart, circular, graph, growth, investment, isolated, market, numbers, percentage, pie, piece, plan, presentation, render, report, results, slice, statistics, stock, success and business.

Comparative Analysis Of Human Resource Consulting Software Implementation Rules PDF
The following slide highlights the comparative analysis of human resource consulting software implementation. It showcases region, software implementation percentage, growth, development type and software type. Pitch your topic with ease and precision using this Comparative Analysis Of Human Resource Consulting Software Implementation Rules PDF. This layout presents information on Development Type, Growth, Software Implementation. It is also available for immediate download and adjustment. So, changes can be made in the color, design, graphics or any other component to create a unique layout.

Business Assessment Outline Bad Debt Ppt Ideas Visuals PDF
Presenting business assessment outline bad debt ppt ideas visuals pdf to provide visual cues and insights. Share and navigate important information on one stages that need your due attention. This template can be used to pitch topics like types bad debts, percentage, cash advances, loan given customers, credit given company. In addition, this PPT design contains high-resolution images, graphics, etc, that are easily editable and available for immediate download.

Kpis Digital Marketing Analytics Measurement Strategy Ppt Slides
This is a kpis digital marketing analytics measurement strategy ppt slides. This is a six stage process. The stages in this process are home improvement inc, increase customer conversion, lead generation, website goal quick and easy purchases, kpl conversion rate purchases, segments revenue per purchase time on site geography, website goal get people to read about the services offered and sign up, kpl e mail sign up conversion rate target 15 percentage, segments, time on site geography visit tiers. \n

Implementing Marketing Mix Strategy To Enhance Overall Performance Allocating Marketing Budget To Key Activities Mockup PDF
The following slide helps organization in carefully analyzing the key elements of marketing budget. The pie chart provides an overview of the percentage. Deliver and pitch your topic in the best possible manner with this Implementing Marketing Mix Strategy To Enhance Overall Performance Allocating Marketing Budget To Key Activities Mockup PDF. Use them to share invaluable insights on Marketing Budget, Optimization, Advertisement and impress your audience. This template can be altered and modified as per your expectations. So, grab it now.

Composition Of Formulation Development Experiments Diagrams PDF
Following table illustrates the composition of formulation development experiments. It includes ingredients details and their proportion in grams and percentage. Deliver an awe inspiring pitch with this creative composition of formulation development experiments diagrams pdf bundle. Topics like composition of formulation development experiments can be discussed with this completely editable template. It is available for immediate download depending on the needs and requirements of the user.

Business Workforce Timeline For Team Targets Ppt Summary Mockup PDF
Persuade your audience using this business workforce timeline for team targets ppt summary mockup pdf. This PPT design covers four stages, thus making it a great tool to use. It also caters to a variety of topics including teamwork, market share percentage, brainstorm, target. Download this PPT design now to present a convincing pitch that not only emphasizes the topic but also showcases your presentation skills.
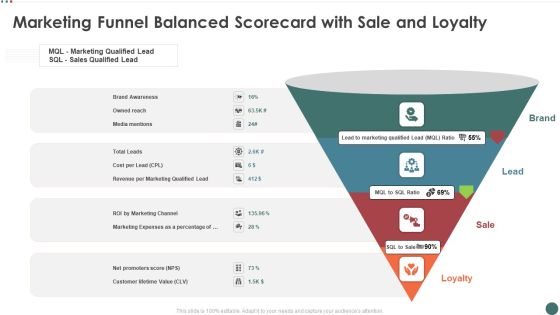
Marketing Funnel Balanced Scorecard With Sale And Loyalty Elements PDF
Presenting marketing funnel balanced scorecard with sale and loyalty elements pdf to provide visual cues and insights. Share and navigate important information on four stages that need your due attention. This template can be used to pitch topics like brand awareness, revenue per marketing qualified, marketing expenses as a percentage. In addtion, this PPT design contains high resolution images, graphics, etc, that are easily editable and available for immediate download.
 Home
Home