AI PPT Maker
Templates
PPT Bundles
Design Services
Business PPTs
Business Plan
Management
Strategy
Introduction PPT
Roadmap
Self Introduction
Timelines
Process
Marketing
Agenda
Technology
Medical
Startup Business Plan
Cyber Security
Dashboards
SWOT
Proposals
Education
Pitch Deck
Digital Marketing
KPIs
Project Management
Product Management
Artificial Intelligence
Target Market
Communication
Supply Chain
Google Slides
Research Services
 One Pagers
All Categories
-
Home
- Customer Favorites
- Percentage Infographic
Percentage Infographic

Scatter Line Ppt PowerPoint Presentation Infographics Background Images
This is a scatter line ppt powerpoint presentation infographics background images. This is a one stage process. The stages in this process are dollar in millions, product, sales in percentage.
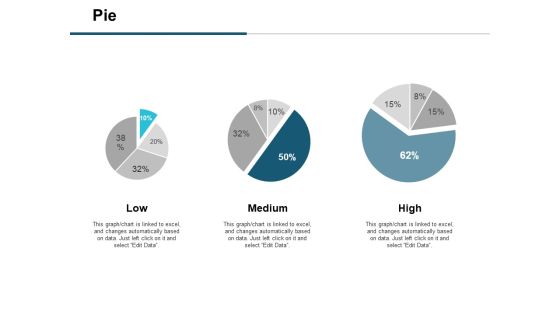
Pie Financial Ppt PowerPoint Presentation Infographics Master Slide
This is a pie financial ppt powerpoint presentation infographics master slide. This is a three stage process. The stages in this process are business strategy, marketing, management, percentage, pie, financial.

Area Chart Ppt PowerPoint Presentation Infographics Graphics Tutorials
This is a area chart ppt powerpoint presentation infographics graphics tutorials. This is a two stage process. The stages in this process are product, area chart, sales in percentage.

Clustered Column Line Ppt PowerPoint Presentation Infographics Templates
This is a clustered column line ppt powerpoint presentation infographics templates. This is a three stage process. The stages in this process are in percentage, business, marketing, product, finance, graph.

Donut Pie Chart Ppt PowerPoint Presentation Infographics Background Designs
This is a donut pie chart ppt powerpoint presentation infographics background designs. This is a three stage process. The stages in this process are finance, business, marketing, strategy, percentage.
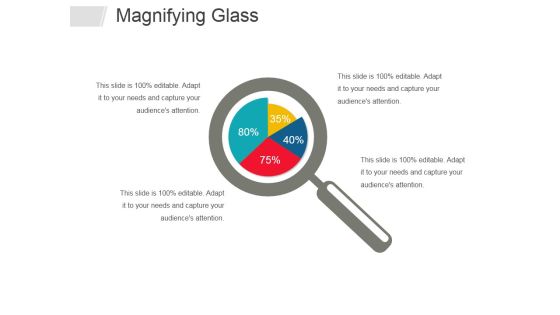
Magnifying Glass Ppt PowerPoint Presentation Infographics Slide Portrait
This is a magnifying glass ppt powerpoint presentation infographics slide portrait. This is a four stage process. The stages in this process are magnifying glass, management, marketing, business, percentage.
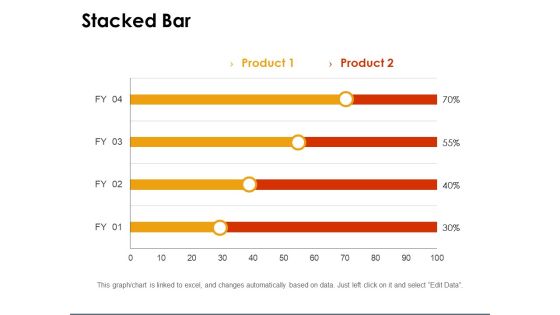
Stacked Bar Template 2 Ppt PowerPoint Presentation Infographics Graphics Design
This is a stacked bar template 2 ppt powerpoint presentation infographics graphics design. This is a two stage process. The stages in this process are percentage, business, marketing, finance.
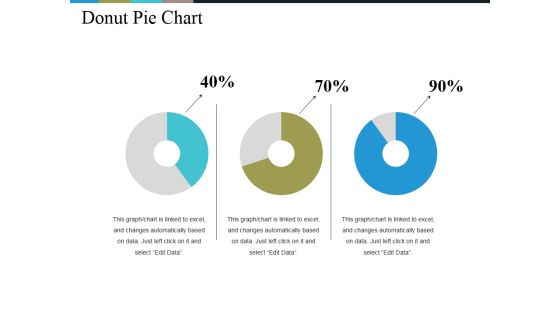
Donut Pie Chart Ppt PowerPoint Presentation Infographics Background Images
This is a donut pie chart ppt powerpoint presentation infographics background images. This is a three stage process. The stages in this process are chart, percentage, business, management, process.

Area Chart Ppt PowerPoint Presentation Infographics Graphics Pictures
This is a area chart ppt powerpoint presentation infographics graphics pictures. This is a two stage process. The stages in this process are business, sales in percentage, area chart, marketing, graph.

Control Charts Sample Value Ppt PowerPoint Presentation Infographics Demonstration
This is a control charts sample value ppt powerpoint presentation infographics demonstration. This is a five stage process. The stages in this process are product, percentage, marketing, business, management.
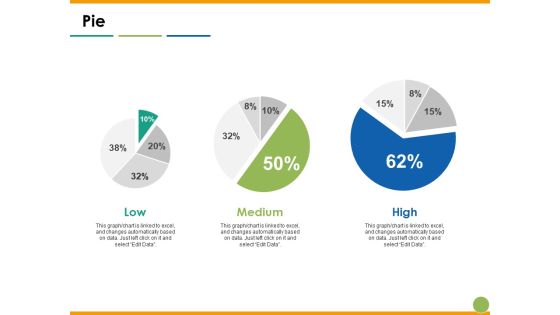
Pie Capability Maturity Matrix Ppt PowerPoint Presentation Infographics Visual Aids
This is a pie capability maturity matrix ppt powerpoint presentation infographics visual aids. This is a three stage process. The stages in this process are pie, low, medium, high, percentage.
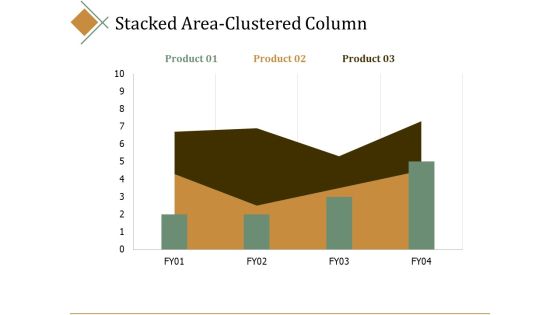
Stacked Area Clustered Column Ppt PowerPoint Presentation Infographics Portrait
This is a stacked area clustered column ppt powerpoint presentation infographics portrait. This is a three stage process. The stages in this process are percentage, product, business, management, marketing.

Cost Performance Index Ppt PowerPoint Presentation Infographics Mockup
This is a cost performance index ppt powerpoint presentation infographics mockup. This is a three stage process. The stages in this process are finance, marketing, management, investment, product, percentage.
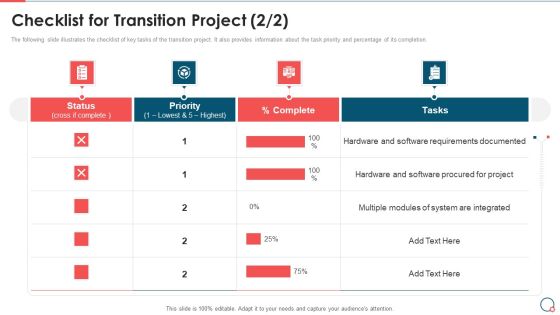
Checklist For Transition Project Information Technology Change Implementation Plan Infographics PDF
The following slide illustrates the checklist of key tasks of the transition project. It also provides information about the task priority and percentage of its completion. Deliver and pitch your topic in the best possible manner with this Checklist For Transition Project Information Technology Change Implementation Plan Infographics PDF. Use them to share invaluable insights on Status, Priority, Complete and impress your audience. This template can be altered and modified as per your expectations. So, grab it now.
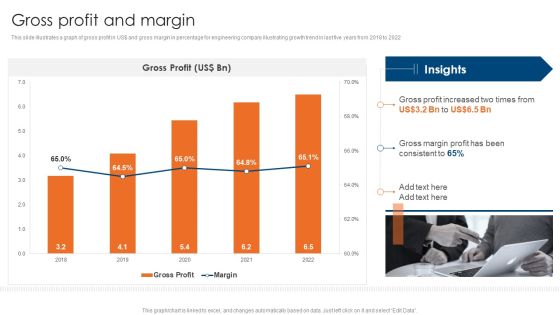
Engineering Consultancy Works Company Profile Gross Profit And Margin Infographics PDF
This slide illustrates a graph of gross profit in US doller and gross margin in percentage for engineering company illustrating growth trend in last five years from 2018 to 2022. Deliver an awe inspiring pitch with this creative Engineering Consultancy Works Company Profile Gross Profit And Margin Infographics PDF bundle. Topics like Gross Profit, Margin can be discussed with this completely editable template. It is available for immediate download depending on the needs and requirements of the user.

ABS Healthcare Company Records Infected By Malware Ppt File Infographics PDF
This slide shows the percentage of ABS Healthcare Company Records that are infected by Malware in the past 5 years. Deliver an awe inspiring pitch with this creative ABS healthcare company records infected by malware ppt file infographics pdf bundle. Topics like ABS healthcare company records infected by malware, 2017 to 2021 can be discussed with this completely editable template. It is available for immediate download depending on the needs and requirements of the user.

Abs Healthcare Company Records Infected By Malware Ppt Infographics Rules PDF
This slide shows the percentage of ABS Healthcare Company Records that are infected by Malware in the past 5 years. Deliver an awe-inspiring pitch with this creative abs healthcare company records infected by malware ppt infographics rules pdf. bundle. Topics like abs healthcare company records infected by malware can be discussed with this completely editable template. It is available for immediate download depending on the needs and requirements of the user.

Cloud Based Service Models Infrastructure As A Service Iaas Infographics PDF
This slide represents the market rate of cloud computing, and it is showing the percentage of users who are using public cloud, private cloud, and hybrid cloud services.Deliver and pitch your topic in the best possible manner with this Cloud Based Service Models Infrastructure As A Service Iaas Infographics PDF. Use them to share invaluable insights on Cloud Services, Private Cloud, Private And Public and impress your audience. This template can be altered and modified as per your expectations. So, grab it now.
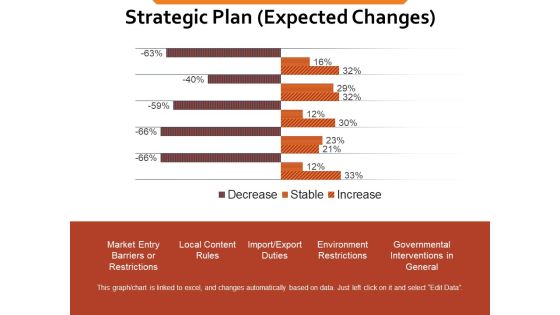
Strategic Plan Expected Changes Ppt PowerPoint Presentation Infographics Template
This is a strategic plan expected changes ppt powerpoint presentation infographics template. This is a two stage process. The stages in this process are market entry barriers or restrictions, local content rules, import export duties, environment restrictions, governmental interventions in general, percentage.

Dashboard For Successful FSM System Ppt Visual Aids Infographics PDF
Showcasing this set of slides titled dashboard for successful fsm system ppt visual aids infographics pdf. The topics addressed in these templates are resource percentage, duration compliance, priority. All the content presented in this PPT design is completely editable. Download it and make adjustments in color, background, font etc. as per your unique business setting.
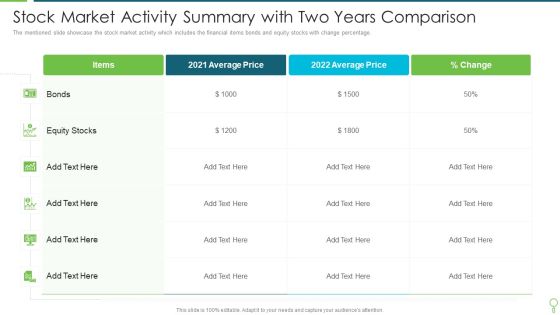
Stock Market Activity Summary With Two Years Comparison Infographics PDF
The mentioned slide showcase the stock market activity which includes the financial items bonds and equity stocks with change percentage. Pitch your topic with ease and precision using this Stock Market Activity Summary With Two Years Comparison Infographics PDF. This layout presents information on Average, Price, Equity Stocks. It is also available for immediate download and adjustment. So, changes can be made in the color, design, graphics or any other component to create a unique layout.
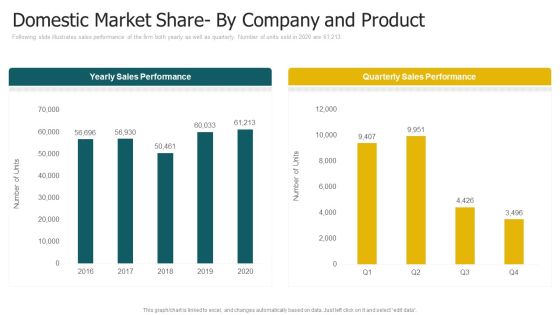
Domestic Market Share By Company And Product Sales Infographics PDF
This slide shows the domestic market share by company as well as by product. Product 2 is the most selling among other products with a share of 34 percentage. Deliver an awe inspiring pitch with this creative domestic market share by company and product sales infographics pdf bundle. Topics like domestic market share by company and product can be discussed with this completely editable template. It is available for immediate download depending on the needs and requirements of the user.

Shareholder Structure Of The Company With Details Infographics PDF
This slide shows companys Shareholder structure with shareholder names and their respective percentages. Deliver an awe inspiring pitch with this creative shareholder structure of the company with details infographics pdf bundle. Topics like institutional investors, livestock companies, state farm investors, mutual fund holders, agri business investors can be discussed with this completely editable template. It is available for immediate download depending on the needs and requirements of the user.

Digitalization Plan For Business Modernization Digital Transformation Change Management Dashboard Infographics PDF
Purpose of the following slide is to show the digital transformation change management dashboard as it highlights the percentage of digital transformation and the transformation one by priority. Deliver and pitch your topic in the best possible manner with this digitalization plan for business modernization digital transformation change management dashboard infographics pdf. Use them to share invaluable insights on transformation by priority, percent age of digital transformation and impress your audience. This template can be altered and modified as per your expectations. So, grab it now.
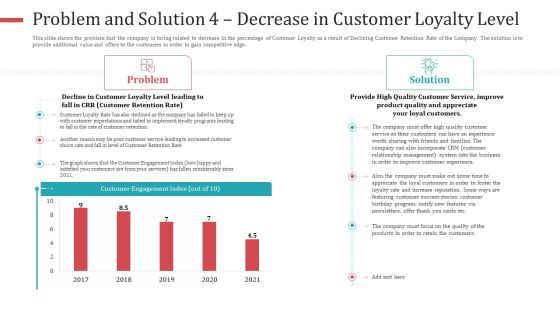
Problem And Solution 4 Decrease In Customer Loyalty Level Infographics PDF
This slide shows the problem that the company is facing related to decrease in the percentage of Customer Loyalty as a result of Declining Customer Retention Rate of the Company. The solution is to provide additional value and offers to the customers in order to gain competitive edge.Deliver an awe-inspiring pitch with this creative problem and solution 4 decrease in customer loyalty level infographics pdf. bundle. Topics like customer engagement index, 2017 to 2021 can be discussed with this completely editable template. It is available for immediate download depending on the needs and requirements of the user.
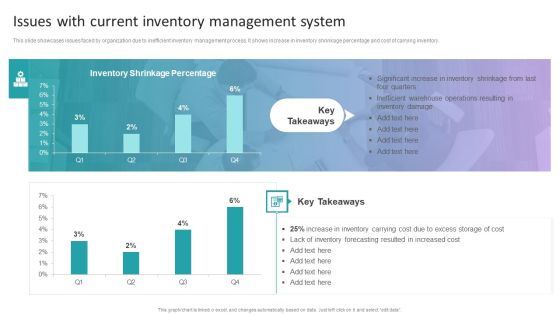
Stock Inventory Acquisition Issues With Current Inventory Management System Infographics PDF
This slide showcases issues faced by organization due to inefficient inventory management process. It shows increase in inventory shrinkage percentage and cost of carrying inventory. Slidegeeks is one of the best resources for PowerPoint templates. You can download easily and regulate Stock Inventory Acquisition Issues With Current Inventory Management System Infographics PDF for your personal presentations from our wonderful collection. A few clicks is all it takes to discover and get the most relevant and appropriate templates. Use our Templates to add a unique zing and appeal to your presentation and meetings. All the slides are easy to edit and you can use them even for advertisement purposes.

Customer Behavior Analytics Dashboard To Improve Satisfaction Ppt File Infographics PDF
The following slide provides an insight of websites performance that includes date parameters. The dashboard includes sessions, users, pageviews, bounce rate and percentage of new sessions. Pitch your topic with ease and precision using this Customer Behavior Analytics Dashboard To Improve Satisfaction Ppt File Infographics PDF. This layout presents information on Session, Avg Session Duration, Bounce Rate. It is also available for immediate download and adjustment. So, changes can be made in the color, design, graphics or any other component to create a unique layout.

Success Rate Of Waterfall And Agile Project Management Approach Infographics PDF
This slide showcases the success rate of waterfall and agile methodology for project management. It presents the project success, failure and challenged percentage in waterfall and agile model approach. If your project calls for a presentation, then Slidegeeks is your go-to partner because we have professionally designed, easy-to-edit templates that are perfect for any presentation. After downloading, you can easily edit Success Rate Of Waterfall And Agile Project Management Approach Infographics PDF and make the changes accordingly. You can rearrange slides or fill them with different images. Check out all the handy templates
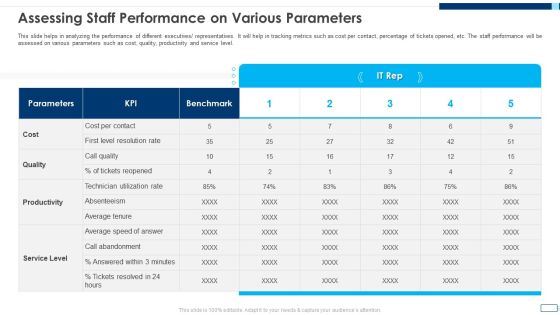
Evolving BI Infrastructure Assessing Staff Performance On Various Parameters Infographics PDF
This slide helps in analyzing the performance of different executives or representatives. It will help in tracking metrics such as cost per contact, percentage of tickets opened, etc. The staff performance will be assessed on various parameters such as cost, quality, productivity and service level. Deliver an awe inspiring pitch with this creative evolving bi infrastructure assessing staff performance on various parameters infographics pdf bundle. Topics like cost, quality, productivity, service level, parameters can be discussed with this completely editable template. It is available for immediate download depending on the needs and requirements of the user.

Customer Support Services Company Profile Integrated Performance Of The Company Infographics PDF
This slide highlights the integrated performance of call center which covers different elements such as jobs created, percentage of women, renewable energy consumption, employees trained on data security and code of conduct Presenting Customer Support Services Company Profile Integrated Performance Of The Company Infographics PDF to provide visual cues and insights. Share and navigate important information on one stages that need your due attention. This template can be used to pitch topics like Technology, Analytics Experts, Data Security. In addtion, this PPT design contains high resolution images, graphics, etc, that are easily editable and available for immediate download.

Annual Employee Attrition Tracking Report With Separation And Appointment Rates Infographics PDF
This slide covers summary report of employees separation rates with reasons. It also includes total appointments including transfers and promotion rates with percentage for cumulative turnover. Showcasing this set of slides titled Annual Employee Attrition Tracking Report With Separation And Appointment Rates Infographics PDF. The topics addressed in these templates are Organizational, Separation And Appointment Rates, Employee Attrition. All the content presented in this PPT design is completely editable. Download it and make adjustments in color, background, font etc. as per your unique business setting.
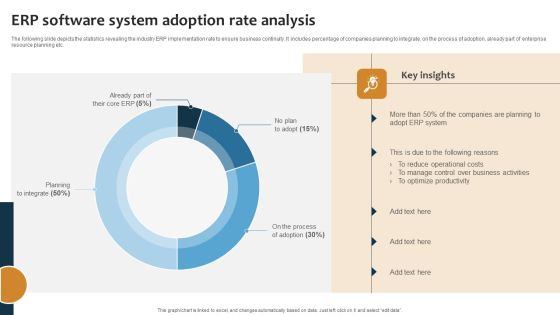
Improving Business Procedures Enterprise Resource Planning System ERP Software System Adoption Rate Infographics PDF
The following slide depicts the statistics revealing the industry ERP implementation rate to ensure business continuity. It includes percentage of companies planning to integrate, on the process of adoption, already part of enterprise resource planning etc. Make sure to capture your audiences attention in your business displays with our gratis customizable Improving Business Procedures Enterprise Resource Planning System ERP Software System Adoption Rate Infographics PDF. These are great for business strategies, office conferences, capital raising or task suggestions. If you desire to acquire more customers for your tech business and ensure they stay satisfied, create your own sales presentation with these plain slides.

Marketers Guide To Data Analysis Optimization Tracking Unsubscribe Rate For Improving Email Content Infographics PDF
This slide covers an overview of the unsubscribe rate to identify the percentage of recipients that opt out of the mailing list. It also includes strategies to reduce unsubscribe rates, such as creating an optimized list, using automation, etc. From laying roadmaps to briefing everything in detail, our templates are perfect for you. You can set the stage with your presentation slides. All you have to do is download these easy to edit and customizable templates. Marketers Guide To Data Analysis Optimization Tracking Unsubscribe Rate For Improving Email Content Infographics PDF will help you deliver an outstanding performance that everyone would remember and praise you for. Do download this presentation today.
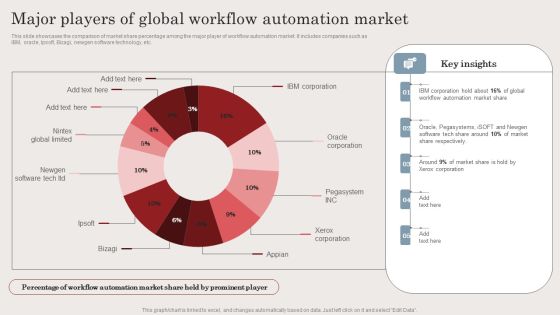
Major Players Of Global Workflow Automation Market Ppt Infographics Design Templates PDF
This slide showcases the comparison of market share percentage among the major player of workflow automation market. It includes companies such as IBM, oracle, Ipsoft, Bizagi, newgen software technology, etc. Take your projects to the next level with our ultimate collection of Major Players Of Global Workflow Automation Market Ppt Infographics Design Templates PDF. Slidegeeks has designed a range of layouts that are perfect for representing task or activity duration, keeping track of all your deadlines at a glance. Tailor these designs to your exact needs and give them a truly corporate look with your own brand colors they will make your projects stand out from the rest.

Project Task List Template 1 Ppt PowerPoint Presentation Infographics Portrait
This is a project task list template 1 ppt powerpoint presentation infographics portrait. This is a three stage process. The stages in this process are priority, start, plan end, actual end, complete, incomplete.

Impact Effort Task Prioritization Matrix Ppt PowerPoint Presentation Infographics Show
This is a impact effort task prioritization matrix ppt powerpoint presentation infographics show. The topics discussed in this diagram are priority matrix, responsibility matrix, action matrix. This is a completely editable PowerPoint presentation, and is available for immediate download.

Project Capabilities Task Matrix Ppt Infographics File Formats PDF
Presenting this set of slides with name project capabilities task matrix ppt infographics file formats pdf. The topics discussed in these slides are main tasks, competencies, responsibilities. This is a completely editable PowerPoint presentation and is available for immediate download. Download now and impress your audience.

Organizational Event Management Weekly Timeline With Task Name Infographics PDF
Deliver an awe-inspiring pitch with this creative organizational event management weekly timeline with task name infographics pdf. bundle. Topics like weekly timeline with task name can be discussed with this completely editable template. It is available for immediate download depending on the needs and requirements of the user.
Employees Task Management Vector Icon Ppt Infographics Maker PDF
Presenting employees task management vector icon ppt infographics maker pdf to dispense important information. This template comprises three stages. It also presents valuable insights into the topics including employees task management vector icon. This is a completely customizable PowerPoint theme that can be put to use immediately. So, download it and address the topic impactfully.
Project Task Management With Time Monitoring Icon Infographics PDF
Presenting project task management with time monitoring icon infographics pdf to dispense important information. This template comprises four stages. It also presents valuable insights into the topics including project task management with time monitoring icon. This is a completely customizable PowerPoint theme that can be put to use immediately. So, download it and address the topic impactfully.
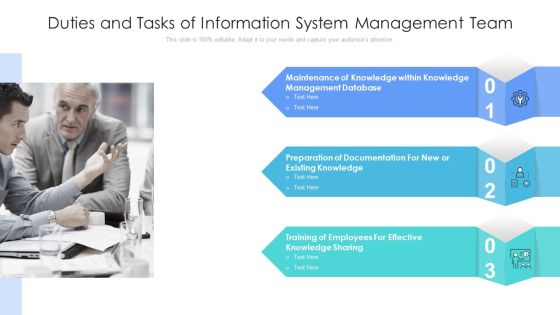
Duties And Tasks Of Information System Management Team Infographics PDF
Presenting duties and tasks of information system management team infographics pdf to dispense important information. This template comprises three stages. It also presents valuable insights into the topics including knowledge management database, preparation of documentation, training of employees. This is a completely customizable PowerPoint theme that can be put to use immediately. So, download it and address the topic impactfully.
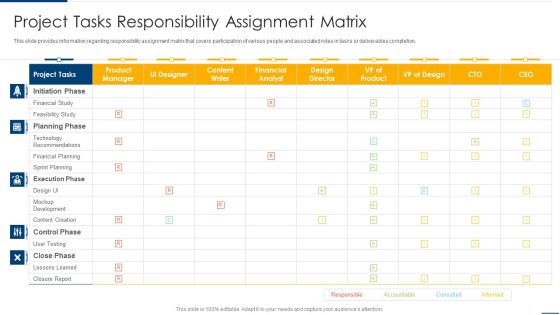
Project Organizing Playbook Project Tasks Responsibility Assignment Matrix Infographics PDF
This slide provides information regarding responsibility assignment matrix that covers participation of various people and associated roles in tasks or deliverables completion. Deliver an awe inspiring pitch with this creative project organizing playbook project tasks responsibility assignment matrix infographics pdf bundle. Topics like initiation phase, planning phase, execution phase can be discussed with this completely editable template. It is available for immediate download depending on the needs and requirements of the user.

Team Task And Time Monitoring Overview Dashboard Infographics PDF
This slide shows a dashboard which includes workload graph, team task tracking list, this week task priority, status and time tracking table. Showcasing this set of slides titled team task and time monitoring overview dashboard infographics pdf. The topics addressed in these templates are team task and time monitoring overview dashboard. All the content presented in this PPT design is completely editable. Download it and make adjustments in color, background, font etc. as per your unique business setting.
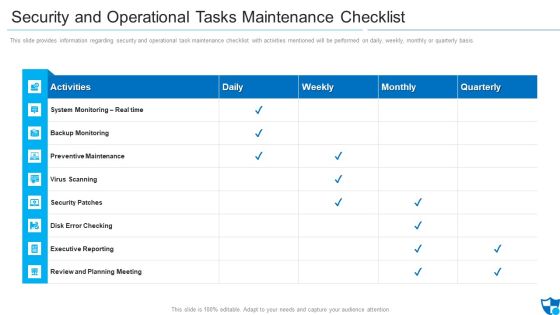
Security And Operational Tasks Maintenance Checklist Infographics PDF
This slide provides information regarding security and operational task maintenance checklist with activities mentioned will be performed on daily, weekly, monthly or quarterly basis.Deliver an awe inspiring pitch with this creative security and operational tasks maintenance checklist infographics pdf bundle. Topics like preventive maintenance, security patches, review and planning meeting can be discussed with this completely editable template. It is available for immediate download depending on the needs and requirements of the user.
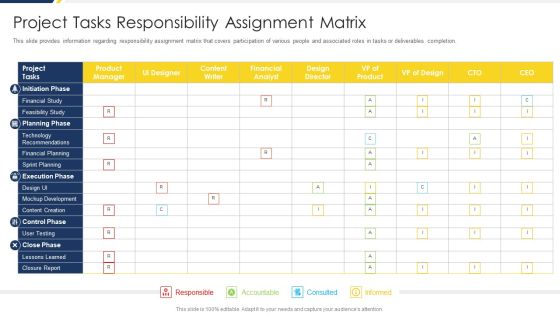
Project Management Development Project Tasks Responsibility Assignment Matrix Infographics PDF
This slide provides information regarding responsibility assignment matrix that covers participation of various people and associated roles in tasks or deliverables completion. Deliver and pitch your topic in the best possible manner with this Project Management Development Project Tasks Responsibility Assignment Matrix Infographics PDF. Use them to share invaluable insights on Product Manager, Financial Study, Technology Recommendations and impress your audience. This template can be altered and modified as per your expectations. So, grab it now.

Online Business Simulation Games With Participant Tasks Infographics PDF
This slide shows corporate role playing games with attendants activities. It provides information about business management, hotel, restaurant, retail store, success factors, production, etc. Showcasing this set of slides titled Online Business Simulation Games With Participant Tasks Infographics PDF. The topics addressed in these templates are Simulation, Participant Tasks, Learning Areas, Success Factors. All the content presented in this PPT design is completely editable. Download it and make adjustments in color, background, font etc. as per your unique business setting.
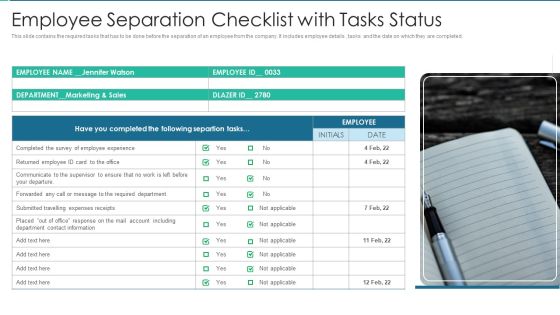
Employee Separation Checklist With Tasks Status Infographics PDF
This slide contains the required tasks that has to be done before the separation of an employee from the company. It includes employee details , tasks and the date on which they are completed.Presenting Employee Separation Checklist With Tasks Status Infographics PDF to dispense important information. This template comprises one stage. It also presents valuable insights into the topics including Employee Experience, Required Department, Account Including This is a completely customizable PowerPoint theme that can be put to use immediately. So, download it and address the topic impactfully.

Task Management For Waterfall Project With Work Status Infographics PDF
This slide focuses on the task management for waterfall project which covers tasks name, status, scheduled start and finish date, duration and efforts, actual start and finish date with web interfacing, gathering requirements, completing documents, prototyping, purchasing, etc. Showcasing this set of slides titled Task Management For Waterfall Project With Work Status Infographics PDF. The topics addressed in these templates are Gathering Requirements, Service, Purchasing. All the content presented in this PPT design is completely editable. Download it and make adjustments in color, background, font etc. as per your unique business setting.

Key Project Task With Delivery Method Status Infographics PDF
This slide provides details of various project tasks which can be used by different project managers for tracking the delivery status. It also provides detailed information about owner, start and due date etc. Showcasing this set of slides titled key project task with delivery method status infographics pdf. The topics addressed in these templates are key project task with delivery method status. All the content presented in this PPT design is completely editable. Download it and make adjustments in color, background, font etc. as per your unique business setting.

Content Marketing Roadmap With Task Assignment Infographics PDF
This slide displays the roadmap which helps to ascertain the accountability of all activities involved in the process of content marketing. It also includes the various stages involved in the process such as ideation, content writing, editing, designing, and publishing. Presenting Content Marketing Roadmap With Task Assignment Infographics PDF to dispense important information. This template comprises one stage. It also presents valuable insights into the topics including Research Target Audience, Targeted Email Campaign, Feature Launch . This is a completely customizable PowerPoint theme that can be put to use immediately. So, download it and address the topic impactfully.
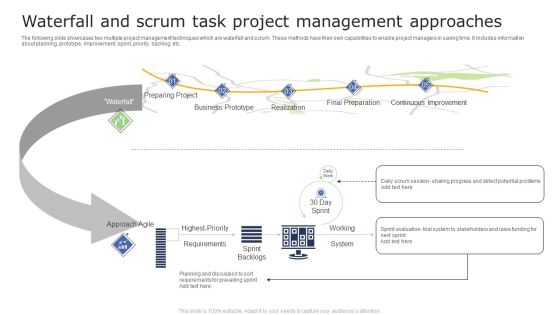
Waterfall And Scrum Task Project Management Approaches Infographics PDF
The following slide showcases two multiple project management techniques which are waterfall and scrum. These methods have their own capabilities to enable project managers in saving time. It includes information about planning, prototype, improvement, sprint, priority, backlog, etc. Showcasing this set of slides titled Waterfall And Scrum Task Project Management Approaches Infographics PDF. The topics addressed in these templates are Business Prototype, Preparing Project, Requirements. All the content presented in this PPT design is completely editable. Download it and make adjustments in color, background, font etc. as per your unique business setting.
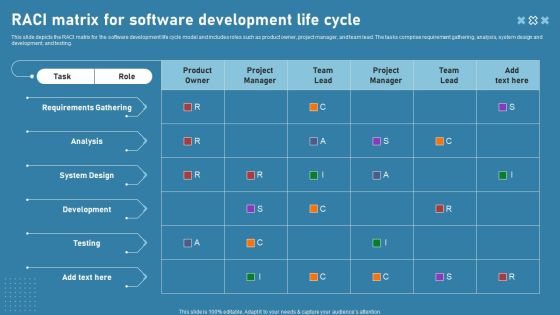
RACI Matrix For Software Development Life Cycle Infographics PDF
This slide depicts the RACI matrix for the software development life cycle model and includes roles such as product owner, project manager, and team lead. The tasks comprise requirement gathering, analysis, system design and development, and testing. Presenting this PowerPoint presentation, titled RACI Matrix For Software Development Life Cycle Infographics PDF, with topics curated by our researchers after extensive research. This editable presentation is available for immediate download and provides attractive features when used. Download now and captivate your audience. Presenting this RACI Matrix For Software Development Life Cycle Infographics PDF. Our researchers have carefully researched and created these slides with all aspects taken into consideration. This is a completely customizable RACI Matrix For Software Development Life Cycle Infographics PDF that is available for immediate downloading. Download now and make an impact on your audience. Highlight the attractive features available with our PPTs.

Action Plan Objectives Ppt PowerPoint Presentation Infographics Design Inspiration
Presenting this set of slides with name action plan objectives ppt powerpoint presentation infographics design inspiration. The topics discussed in these slides are objectives, tasks, success crieteria, time frame, resources. This is a completely editable PowerPoint presentation and is available for immediate download. Download now and impress your audience.
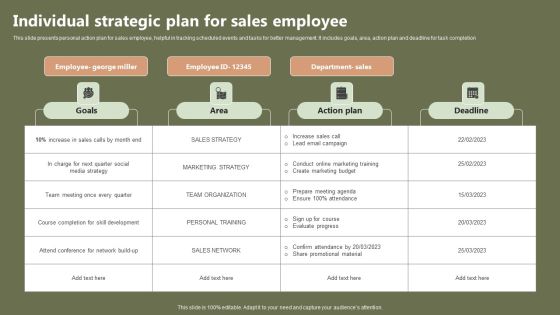
Individual Strategic Plan For Sales Employee Infographics PDF
This slide presents personal action plan for sales employee, helpful in tracking scheduled events and tasks for better management. It includes goals, area, action plan and deadline for task completion. Showcasing this set of slides titled Individual Strategic Plan For Sales Employee Infographics PDF. The topics addressed in these templates are Goals, Action Plan, Sales. All the content presented in this PPT design is completely editable. Download it and make adjustments in color, background, font etc. as per your unique business setting.
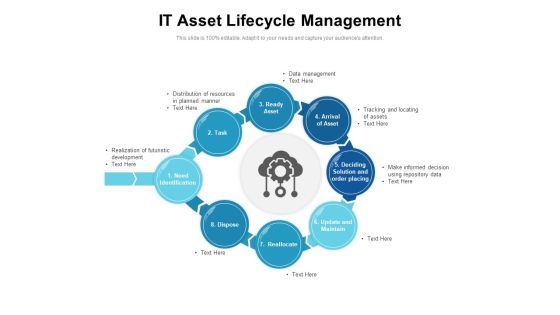
IT Asset Lifecycle Management Ppt PowerPoint Presentation Infographics Demonstration PDF
Presenting this set of slides with name it asset lifecycle management ppt powerpoint presentation infographics demonstration pdf. This is a seven stage process. The stages in this process are arrival of asset, deciding solution and order placing, update and maintain, reallocate, dispose, need identification, ready asset, task. This is a completely editable PowerPoint presentation and is available for immediate download. Download now and impress your audience.

Project Capabilities Statement Of Objectives Ppt Infographics Designs PDF
Presenting this set of slides with name project capabilities statement of objectives ppt infographics designs pdf. This is a four stage process. The stages in this process are to design and implement standard business process, to exclude unnecessary tasks, process and practices, to follow standardized work structure. This is a completely editable PowerPoint presentation and is available for immediate download. Download now and impress your audience.

Agile Software Development Stages With Estimated Time Infographics PDF
This slide shows Agile Software Development Stages such as Planning, Designing, Analysis, Task Implementation, Software Testing, and Maintenance of Software along with estimated time for each stage. Deliver an awe-inspiring pitch with this creative agile software development stages with estimated time infographics pdf bundle. Topics like planning, analysis, implementation, testing and integration, design can be discussed with this completely editable template. It is available for immediate download depending on the needs and requirements of the user.
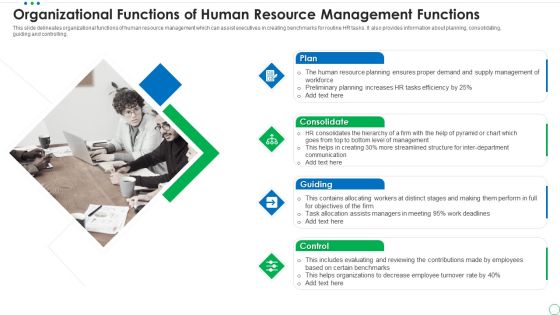
Organizational Functions Of Human Resource Management Functions Infographics PDF
This slide delineates organizational functions of human resource management which can assist executives in creating benchmarks for routine HR tasks. It also provides information about planning, consolidating, guiding and controlling. Presenting organizational functions of human resource management functions infographics pdf to dispense important information. This template comprises four stages. It also presents valuable insights into the topics including plan, consolidate, guiding. This is a completely customizable PowerPoint theme that can be put to use immediately. So, download it and address the topic impactfully.
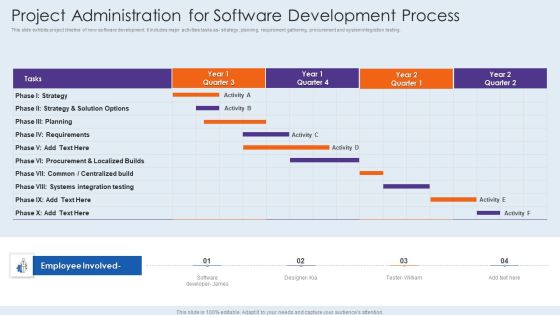
Project Administration For Software Development Process Infographics PDF
This slide exhibits project timeline of new software development. It includes major activities tasks as strategy, planning, requirement gathering, procurement and system integration testing. Showcasing this set of slides titled project administration for software development process infographics pdf. The topics addressed in these templates are strategy, requirements, planning. All the content presented in this PPT design is completely editable. Download it and make adjustments in color, background, font etc. as per your unique business setting.

Software Requirement Parameters For Employee Management System Infographics PDF
This slide signifies the application requirement specification for employee task management system. It covers information about goals, feature, software and hardware interface. Presenting Software Requirement Parameters For Employee Management System Infographics PDF to dispense important information. This template comprises one stages. It also presents valuable insights into the topics including Goals, Feature, Software Interface, Hardware Interface. This is a completely customizable PowerPoint theme that can be put to use immediately. So, download it and address the topic impactfully.

Project Plan For Effective Customer Relationship Management Infographics PDF
This slide provides information regarding the key tasks that are involved in customer relationship management project plan including task duration, task completion rate, cost and working hours associated to each task. The best PPT templates are a great way to save time, energy, and resources. Slidegeeks have 100 percent editable powerpoint slides making them incredibly versatile. With these quality presentation templates, you can create a captivating and memorable presentation by combining visually appealing slides and effectively communicating your message. Download Project Plan For Effective Customer Relationship Management Infographics PDF from Slidegeeks and deliver a wonderful presentation.

Website Needs Checklist To Enhance Ecommerce Company Infographics PDF
The slide showcases a checklist that assists in overseeing tasks and verifying if they are completed by the assigned employee or not. The slide represents the website requirements for an e-commerce businesss online store. The elements are tasks to be performed and assigned to, yes, no, etc. Showcasing this set of slides titled Website Needs Checklist To Enhance Ecommerce Company Infographics PDF. The topics addressed in these templates are Enhancing Ecommerce, Website Design, Management System. All the content presented in this PPT design is completely editable. Download it and make adjustments in color, background, font etc. as per your unique business setting.

Strategic Plan For New Product Launch Plan Checklist Infographics PDF
The slide shows a checklist containing number of tasks needed to be done before product launch. It includes tasks to be done by marketing team, engineering team and product team. Presenting Strategic Plan For New Product Launch Plan Checklist Infographics PDF to dispense important information. This template comprises one stages. It also presents valuable insights into the topics including Marketing Team, Engineering Team, Product Team. This is a completely customizable PowerPoint theme that can be put to use immediately. So, download it and address the topic impactfully.

Change Management And Deployment Release Pipeline Infographics PDF
This slide shows the pipeline of change release and deploy management. It starts with ready to share and continuous integration of developer tasks, ready to accept, continuous delivery and deployment of end user tasks.Showcasing this set of slides titled Change Management And Deployment Release Pipeline Infographics PDF. The topics addressed in these templates are Continuous Integration, Continuous Integration, Success Pipeline. All the content presented in this PPT design is completely editable. Download it and make adjustments in color, background, font etc. as per your unique business setting.
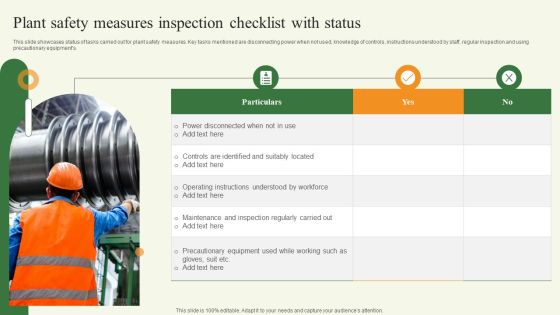
Plant Safety Measures Inspection Checklist With Status Infographics PDF
This slide showcases status of tasks carried out for plant safety measures. Key tasks mentioned are disconnecting power when not used, knowledge of controls, instructions understood by staff, regular inspection and using precautionary equipments. Showcasing this set of slides titled Plant Safety Measures Inspection Checklist With Status Infographics PDF. The topics addressed in these templates are Plant Safety Measures, Inspection Checklist With Status, Equipment. All the content presented in this PPT design is completely editable. Download it and make adjustments in color, background, font etc. as per your unique business setting.

Work Action Plan For Human Resource Department Infographics PDF
This slide defines the task plan implemented in the HR department of an organization. The purpose of this template is to develop human resource strategy for efficient working. It also includes elements such as activities, tasks, ratings, etc. Showcasing this set of slides titled Work Action Plan For Human Resource Department Infographics PDF. The topics addressed in these templates are Strategic Alignment, Goal, Employee Journey. All the content presented in this PPT design is completely editable. Download it and make adjustments in color, background, font etc. as per your unique business setting.

Analytics Procedure Dashboard With Start Trend And Summary Infographics PDF
This slide showcases a dashboard of analytics process to guide organizations upstream root cause and plan actions to avoid issues in future. It covers essential KPIs such as total and active process, average duration, participants, active tasks, errors, trend and summary. Showcasing this set of slides titled Analytics Procedure Dashboard With Start Trend And Summary Infographics PDF. The topics addressed in these templates are Procedure Status, Average Duration, Active Tasks. All the content presented in this PPT design is completely editable. Download it and make adjustments in color, background, font etc. as per your unique business setting.

Project Management Process With Supply Chain Activities Infographics PDF
This slide covers future procurement activities that need to be put into action once the task of project management have been completed. It also includes commencement, preparation, implementation, performance management, complete and lesson learned.Showcasing this set of slides titled Project Management Process With Supply Chain Activities Infographics PDF. The topics addressed in these templates are Manage Budget, Performance Management, Develop. All the content presented in this PPT design is completely editable. Download it and make adjustments in color, background, font etc. as per your unique business setting.
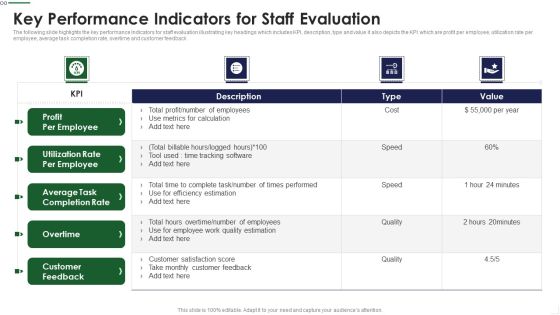
Key Performance Indicators For Staff Evaluation Infographics PDF
The following slide highlights the key performance Indicators for staff evaluation illustrating key headings which includes KPI, description, type and value it also depicts the KPI which are profit per employee, utilization rate per employee, average task completion rate, overtime and customer feedback Showcasing this set of slides titled Key Performance Indicators For Staff Evaluation Infographics PDF The topics addressed in these templates are Metrics Calculation, Times Performed, Customer Satisfaction All the content presented in this PPT design is completely editable. Download it and make adjustments in color, background, font etc. as per your unique business setting.

Finance Business Transformation Plan For Change Management Office Infographics PDF
This slide showcases various elements of change management plan for transformation office to ensure timely completion of tasks. It includes components such as vision, workstreams, adapt, innovate, etc. Presenting Finance Business Transformation Plan For Change Management Office Infographics PDF to dispense important information. This template comprises One stage. It also presents valuable insights into the topics including Organizational Design, Planning And Forecasting Process, Investment Optimization Process. This is a completely customizable PowerPoint theme that can be put to use immediately. So, download it and address the topic impactfully.
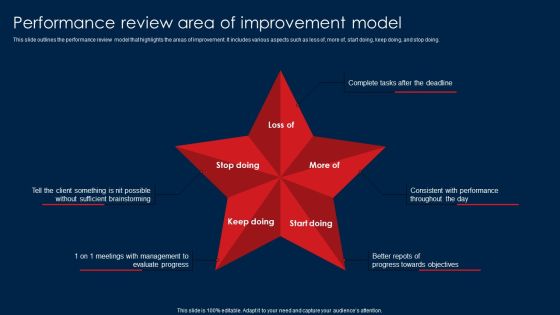
Performance Review Area Of Improvement Model Infographics PDF
This slide outlines the performance review model that highlights the areas of improvement. It includes various aspects such as less of, more of, start doing, keep doing, and stop doing. Showcasing this set of slides titled Performance Review Area Of Improvement Model Infographics PDF. The topics addressed in these templates are Complete Tasks, Sufficient Brainstorming, Consistent Performance. All the content presented in this PPT design is completely editable. Download it and make adjustments in color, background, font etc. as per your unique business setting.

Implementation Plan For Customer Experience Accomplishment Infographics PDF
This slide focuses on the implementation plan for great customer experience success which includes tasks name such as sales to post sales handoff, customer onboarding activities and implementation such as develop plan, conduct call, communicate schedule, plan onsite and training, etc. Showcasing this set of slides titled implementation plan for customer experience accomplishment infographics pdf. The topics addressed in these templates are customer implementation, customer onboarding. All the content presented in this PPT design is completely editable. Download it and make adjustments in color, background, font etc. as per your unique business setting.

Strategic Issue Management Checklist To Improve Project Effectiveness Infographics PDF
The following slide showcases checklist identify and control issues in project. It further includes key tasks and status complete, in progress, and incomplete related to them. Pitch your topic with ease and precision using this Strategic Issue Management Checklist To Improve Project Effectiveness Infographics PDF. This layout presents information on Issue Overcoming, Issue Identification, Issue Determination. It is also available for immediate download and adjustment. So, changes can be made in the color, design, graphics or any other component to create a unique layout.

Project Management Progress Status Report Ppt Infographics Gallery PDF
This slide showcase project management progress report in which task status is shown through colors. It covers three colors to showcase status such as red, yellow and green. Showcasing this set of slides titled Project Management Progress Status Report Ppt Infographics Gallery PDF. The topics addressed in these templates are Overall Status, Accomplishments, Critical Issues, Major Risks. All the content presented in this PPT design is completely editable. Download it and make adjustments in color, background, font etc. as per your unique business setting.

Online Marketing Quarterly Campaign Timeline With Progress Rate Infographics PDF
This slide represents the digital marketing timeline for effective management of its campaign. It shows the tasks of planning, content, design, marketing channels and emails with individuals assigned for them and their progress rate. Showcasing this set of slides titled Online Marketing Quarterly Campaign Timeline With Progress Rate Infographics PDF. The topics addressed in these templates are Design, Planning, Digital Marketing Campaign. All the content presented in this PPT design is completely editable. Download it and make adjustments in color, background, font etc. as per your unique business setting.

HR Work Action Plan For Hiring Employees Infographics PDF
This slide defines the task plan implemented in the HR department for selecting candidates. The purpose of this template is to explain the employee journey. It also includes elements such as problem solving and entrepreneurship. Presenting HR Work Action Plan For Hiring Employees Infographics PDF to dispense important information. This template comprises three stages. It also presents valuable insights into the topics including Recruiting, Hiring, Compensation And Benefits, Onboarding. This is a completely customizable PowerPoint theme that can be put to use immediately. So, download it and address the topic impactfully.
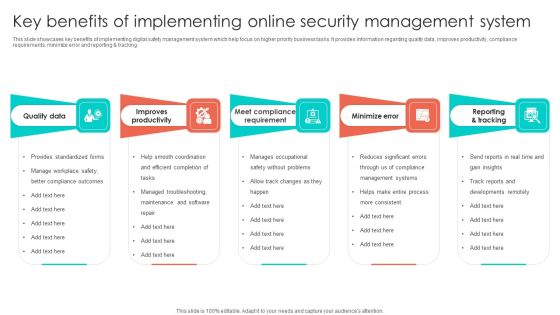
Key Benefits Of Implementing Online Security Management System Infographics PDF
This slide showcases key benefits of implementing digital safety management system which help focus on higher priority business tasks. It provides information regarding quality data, improves productivity, compliance requirements, minimize error and reporting and tracking. Presenting Key Benefits Of Implementing Online Security Management System Infographics PDF to dispense important information. This template comprises five stages. It also presents valuable insights into the topics including Improves Productivity, Quality Data, Minimize Error. This is a completely customizable PowerPoint theme that can be put to use immediately. So, download it and address the topic impactfully.

Customer Request Order And Fulfilment Framework Infographics PDF
This slide includes the fundamental structure for managing customer orders, placing them, and fulfilling them that successful companies can employ to automate system integration and manage tasks. The key elements covered in the slide are customer, order, management, system integration etc. Showcasing this set of slides titled Customer Request Order And Fulfilment Framework Infographics PDF. The topics addressed in these templates are Customer, Order Management, System Integrations. All the content presented in this PPT design is completely editable. Download it and make adjustments in color, background, font etc. as per your unique business setting.
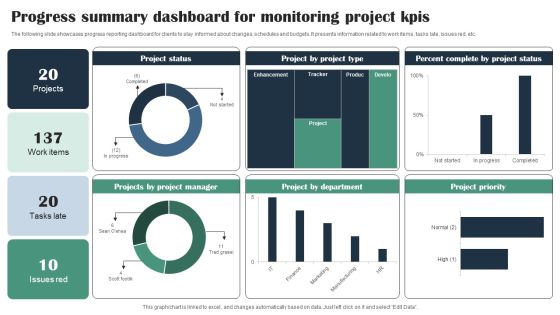
Progress Summary Dashboard For Monitoring Project Kpis Infographics PDF
The following slide showcases progress reporting dashboard for clients to stay informed about changes, schedules and budgets. It presents information related to work items, tasks late, issues red, etc. Pitch your topic with ease and precision using this Progress Summary Dashboard For Monitoring Project Kpis Infographics PDF. This layout presents information on Project Status, Project Manager, Project Type, Percent Complete. It is also available for immediate download and adjustment. So, changes can be made in the color, design, graphics or any other component to create a unique layout.

Bi Annual Communication Plan With Project Milestones Infographics PDF
The following slide shows list of tasks to be completed within months of January, February, march, April, may and June. It further includes details about meetings and presentations scheduled at specific dates. Persuade your audience using this Bi Annual Communication Plan With Project Milestones Infographics PDF. This PPT design covers six stages, thus making it a great tool to use. It also caters to a variety of topics including Milestones, Communication, Plan. Download this PPT design now to present a convincing pitch that not only emphasizes the topic but also showcases your presentation skills.

Employee Job Progression Matrix With Progression Rate Infographics PDF
This slide presents employee career matrix that helps to identify competencies and transformation over years, indicating professional development. It includes position, key tasks, skills, levels and progression rate that defines employee potential as beginner, advance and expert. Showcasing this set of slides titled Employee Job Progression Matrix With Progression Rate Infographics PDF. The topics addressed in these templates are Position, Skill, Level. All the content presented in this PPT design is completely editable. Download it and make adjustments in color, background, font etc. as per your unique business setting.

Event Marketing And Roll Out Date Timeline Infographics PDF
The following slide depicts timeline for an event launch program to synchronize tasks and track overall progress. It includes key activities such as launch meeting, targets, message brief, press release etc. Showcasing this set of slides titled Event Marketing And Roll Out Date Timeline Infographics PDF. The topics addressed in these templates are Launch Meeting, Launch Targets, Mail Event Details. All the content presented in this PPT design is completely editable. Download it and make adjustments in color, background, font etc. as per your unique business setting.

Key Capabilities And Skills In Business Analysis Infographics PDF
This slide covers key competencies required for business analysis to assess candidates and efficiently structure resource pool for future tasks. This consists of analytical thinking, behavioural characteristics, business knowledge and interaction skills. Presenting Key Capabilities And Skills In Business Analysis Infographics PDF to dispense important information. This template comprises four stages. It also presents valuable insights into the topics including Analytical Thinking, Behavioural Characteristics, Business Knowledge. This is a completely customizable PowerPoint theme that can be put to use immediately. So, download it and address the topic impactfully.
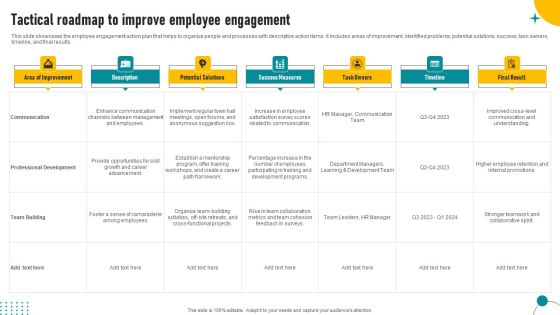
Tactical Roadmap To Improve Employee Engagement Infographics PDF
This slide showcases the employee engagement action plan that helps to organize people and processes with descriptive action items. It includes areas of improvement, identified problems, potential solutions, success, task owners, timeline, and final results. Showcasing this set of slides titled Tactical Roadmap To Improve Employee Engagement Infographics PDF. The topics addressed in these templates are Description, Potential Solutions, Success Measures. All the content presented in this PPT design is completely editable. Download it and make adjustments in color, background, font etc. as per your unique business setting.

Six Months High Level Project Design Concept Strategy Infographics PDF
The slide represents a biannual project roadmap with a design framework. It highlights all the phases beginning with the clients request to execute a project. It helps the firm track down project goals, timelines, and outcomes for the specific project. It includes critical phases, activities, and time in which the task has to be completed. Persuade your audience using this Six Months High Level Project Design Concept Strategy Infographics PDF. This PPT design covers Six stages, thus making it a great tool to use. It also caters to a variety of topics including Concept Strategy, Sales Presentation, Review Proposals. Download this PPT design now to present a convincing pitch that not only emphasizes the topic but also showcases your presentation skills.

5 Year Roadmap For Trademarking Tasks Timeline Infographics
Presenting the 5 year roadmap for trademarking tasks timeline infographics. The template includes a roadmap that can be used to initiate a strategic plan. Not only this, the PowerPoint slideshow is completely editable and you can effortlessly modify the font size, font type, and shapes according to your needs. This PPT slide can be easily reached in standard screen and widescreen aspect ratios. The set is also available in various formats like PDF, PNG, and JPG. So download and use it multiple times as per your knowledge.

Customer Service Plan To Improve Sales Metrics To Measure Customer And Revenue Churn Infographics PDF
This slide focuses on metrics to measure customer and revenue churn which also shows net promoter score, customer loyalty rate, percentage of premium users, customer lifetime value, etc. This modern and well arranged Customer Service Plan To Improve Sales Metrics To Measure Customer And Revenue Churn Infographics PDF provides lots of creative possibilities. It is very simple to customize and edit with the Powerpoint Software. Just drag and drop your pictures into the shapes. All facets of this template can be edited with Powerpoint no extra software is necessary. Add your own material, put your images in the places assigned for them, adjust the colors, and then you can show your slides to the world, with an animated slide included.

Vidyard Investor Capital Funding Elevator Pitch Deck Key Industry Statistics For Video Marketing Infographics PDF Mockup PDF
Understanding the usage of user made video is a key aspect of vidyard pitch deck, the provided slide displays the increase in sales of professionals, percentage of people who watch videos under 1 minute, total number of video analytics tools used. Deliver and pitch your topic in the best possible manner with this vidyard investor capital funding elevator pitch deck key industry statistics for video marketing infographics pdf mockup pdf. Use them to share invaluable insights on key industry statistics for video marketing and impress your audience. This template can be altered and modified as per your expectations. So, grab it now.
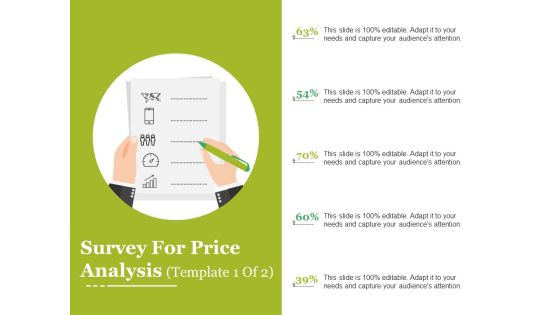
Survey For Price Analysis Template 2 Ppt PowerPoint Presentation Infographics Brochure
This is a survey for price analysis template 2 ppt powerpoint presentation infographics brochure. This is a five stage process. The stages in this process are business, marketing, analysis, percentage, management.

Series B Funding For Startup Capitalization Pre And Post Money Private Equity Valuation Infographics PDF
This slide provides the pre and post money equity valuation and share value with ownership percentage. Deliver an awe inspiring pitch with this creative series b funding for startup capitalization pre and post money private equity valuation infographics pdf bundle. Topics like pre and post money private equity valuation can be discussed with this completely editable template. It is available for immediate download depending on the needs and requirements of the user.

Investor Pitch Deck To Generate Venture Capital Funds Private Equity Post Capitalization Table Infographics PDF
This slide shows companys pre and post capitalization comparison table with total valuation of shares and their ownership percentage. Deliver and pitch your topic in the best possible manner with this investor pitch deck to generate venture capital funds private equity post capitalization table infographics pdf. Use them to share invaluable insights on private equity post capitalization table and impress your audience. This template can be altered and modified as per your expectations. So, grab it now.

Global Forthcoming Growth Opportunities In Blockchain Market Ppt Infographics Images PDF
This slide covers information on future growth opportunity in block chain market. It also includes compound annual growth rate CAGR, supplementary growth, competitors, contribution from top country market area, 2024 growth, etc. Persuade your audience using this Global Forthcoming Growth Opportunities In Blockchain Market Ppt Infographics Images PDF. This PPT design covers one stages, thus making it a great tool to use. It also caters to a variety of topics including Annual Growth Rate, Market Growth, 2024 Growth Percentage. Download this PPT design now to present a convincing pitch that not only emphasizes the topic but also showcases your presentation skills.

Post Merger Information Technology Service Delivery Amalgamation Value Categories In IT Integration Infographics PDF
Following slide portrays different value categories in IT integration along with the information of strategy adoption and stats of potential savings in percentage. This is a post merger information technology service delivery amalgamation value categories in it integration infographics pdf template with various stages. Focus and dispense information on three stages using this creative set, that comes with editable features. It contains large content boxes to add your information on topics like value categories in it integration. You can also showcase facts, figures, and other relevant content using this PPT layout. Grab it now.
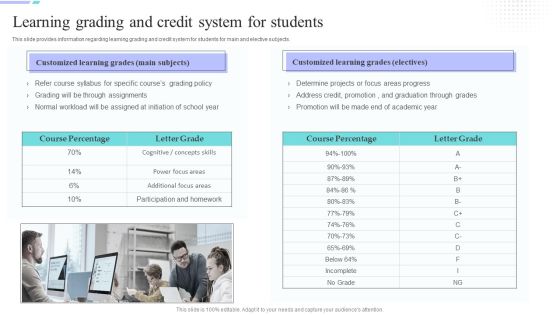
Distance Coaching Playbook Learning Grading And Credit System For Students Infographics PDF
This slide provides information regarding learning grading and credit system for students for main and elective subjects. Presenting Distance Coaching Playbook Learning Grading And Credit System For Students Infographics PDF to provide visual cues and insights. Share and navigate important information on one stages that need your due attention. This template can be used to pitch topics like Customized Learning Grades, Course Percentage, Letter Grade. In addtion, this PPT design contains high resolution images, graphics, etc, that are easily editable and available for immediate download.

Effective Product Development Strategy Impact Of Product Development Strategies Post Implementation Infographics PDF
This slide represents impact of product development strategies. It highlights sales percentage, product headcount, product sales, patent generation etc.Slidegeeks is here to make your presentations a breeze with Effective Product Development Strategy Impact Of Product Development Strategies Post Implementation Infographics PDF With our easy-to-use and customizable templates, you can focus on delivering your ideas rather than worrying about formatting. With a variety of designs to choose from, you are sure to find one that suits your needs. And with animations and unique photos, illustrations, and fonts, you can make your presentation pop. So whether you are giving a sales pitch or presenting to the board, make sure to check out Slidegeeks first.

How Leaders Can Improve Team Effectiveness Sales Team Performance Management KPI Dashboard Infographics PDF
This slide showcases KPI dashboard which can help sales team managers display and review performance rankings. It provides details about weekly sales score, target percentage, total target, sales team members, etc. Unleash your creativity with our How Leaders Can Improve Team Effectiveness Sales Team Performance Management KPI Dashboard Infographics PDF single-slide PPT template. Whether you are a seasoned presenter or a newbie, our editable and visually-stunning template will make your presentations shine. This template is versatile and easy to use. Make your presentations unforgettable with our premium template and leave a lasting impression on your audience.

Criterion For Choosing Distribution Channel For Efficient Sales Administration Budget Analysis Infographics PDF
This slide covers the budget preparation for channel sales. Company is planning to use all 3 channels of distribution which are intensive, selective and exclusive based on type of products offered. Budget highlights the expected sales, no. Of distributors required and commission percentage. Create an editable Criterion For Choosing Distribution Channel For Efficient Sales Administration Budget Analysis Infographics PDF that communicates your idea and engages your audience. Whether youre presenting a business or an educational presentation, pre-designed presentation templates help save time. Criterion For Choosing Distribution Channel For Efficient Sales Administration Budget Analysis Of Implementing Distribution Strategies Infographics PDF is highly customizable and very easy to edit, covering many different styles from creative to business presentations. Slidegeeks has creative team members who have crafted amazing templates. So, go and get them without any delay.
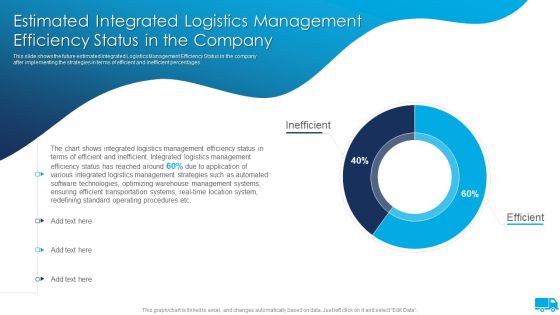
Strategies For Integrated Logistics Management Enhancing Order Efficiency Estimated Integrated Logistics Infographics PDF
This slide shows the future estimated Integrated Logistics Management Efficiency Status in the company after implementing the strategies in terms of efficient and inefficient percentages.Deliver an awe inspiring pitch with this creative Strategies For Integrated Logistics Management Enhancing Order Efficiency Estimated Integrated Logistics Infographics PDF bundle. Topics like Integrated Logistics, Inefficient Integrated, Various Integrated can be discussed with this completely editable template. It is available for immediate download depending on the needs and requirements of the user.

Three Stages Of Task Progress Ppt PowerPoint Presentation Infographics Graphics Example
This is a three stages of task progress ppt powerpoint presentation infographics graphics example. This is a three stage process. The stages in this process are task completion, assignment completion, work completion.

Business Venture Tactical Planning Complete PPT Deck Project Tasks Status Dashboard Infographics PDF
This is a business venture tactical planning complete ppt deck project tasks status dashboard infographics pdf template with various stages. Focus and dispense information on three stages using this creative set, that comes with editable features. It contains large content boxes to add your information on topics like project tasks status dashboard. You can also showcase facts, figures, and other relevant content using this PPT layout. Grab it now.

Cultural Integration In Company Monthly Timeline With Task Name Ppt PowerPoint Presentation Infographics Show PDF
Presenting this set of slides with name cultural integration in company monthly timeline with task name ppt powerpoint presentation infographics show pdf. The topics discussed in these slide is monthly timeline with task. This is a completely editable PowerPoint presentation and is available for immediate download. Download now and impress your audience.

Assessment Of Fixed Assets Monthly Timeline With Task Name Infographics PDF
Presenting this set of slides with name assessment of fixed assets monthly timeline with task name infographics pdf. The topics discussed in these slide is monthly timeline with task name. This is a completely editable PowerPoint presentation and is available for immediate download. Download now and impress your audience.

Business Task Report With Person Responsible Ppt PowerPoint Presentation Infographics Guide PDF
Showcasing this set of slides titled business task report with person responsible ppt powerpoint presentation infographics guide pdf. The topics addressed in these templates are business task report with person responsible. All the content presented in this PPT design is completely editable. Download it and make adjustments in color, background, font etc. as per your unique business setting.
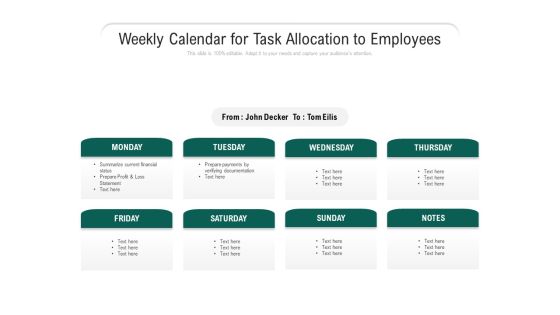
Weekly Calendar For Task Allocation To Employees Ppt PowerPoint Presentation File Infographics PDF
Presenting weekly calendar for task allocation to employees ppt powerpoint presentation file infographics pdf to dispense important information. This template comprises one stages. It also presents valuable insights into the topics including weekly calendar for task allocation to employees. This is a completely customizable PowerPoint theme that can be put to use immediately. So, download it and address the topic impactfully.
Schedule Planning For Employee Task Management Ppt PowerPoint Presentation Gallery Infographics PDF
Presenting schedule planning for employee task management ppt powerpoint presentation gallery infographics pdf to dispense important information. This template comprises three stages. It also presents valuable insights into the topics including schedule planning for employee task management. This is a completely customizable PowerPoint theme that can be put to use immediately. So, download it and address the topic impactfully.
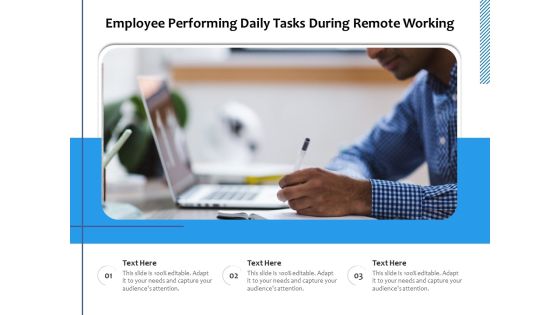
Employee Performing Daily Tasks During Remote Working Ppt PowerPoint Presentation Infographics Picture PDF
Presenting employee performing daily tasks during remote working ppt powerpoint presentation infographics picture pdf to dispense important information. This template comprises three stages. It also presents valuable insights into the topics including employee performing daily tasks during remote working. This is a completely customizable PowerPoint theme that can be put to use immediately. So, download it and address the topic impactfully.
Task Workload Distribution Vector Icon Ppt PowerPoint Presentation Infographics Slides PDF
Presenting task workload distribution vector icon ppt powerpoint presentation infographics slides pdf to dispense important information. This template comprises four stages. It also presents valuable insights into the topics including task workload distribution vector icon. This is a completely customizable PowerPoint theme that can be put to use immediately. So, download it and address the topic impactfully.

CSR Activities Company Reputation Management Weekly Timeline With Task Name Ppt Infographics Design Inspiration PDF
Deliver an awe-inspiring pitch with this creative csr activities company reputation management weekly timeline with task name ppt infographics design inspiration pdf bundle. Topics like weekly timeline task can be discussed with this completely editable template. It is available for immediate download depending on the needs and requirements of the user.

Agile Project Expenses Projection IT Weekly Timeline With Task Name Infographics PDF
Deliver an awe inspiring pitch with this creative agile project expenses projection it weekly timeline with task name infographics pdf bundle. Topics like weekly timeline with task name can be discussed with this completely editable template. It is available for immediate download depending on the needs and requirements of the user.

Fire Service Technology Comparative Balanced Scorecard With Daily Tasks Infographics PDF
Deliver an awe inspiring pitch with this creative fire service technology comparative balanced scorecard with daily tasks infographics pdf bundle. Topics like daily tasks, fire incidents, equipment maintenance can be discussed with this completely editable template. It is available for immediate download depending on the needs and requirements of the user.

Six Step Of Capability Management People Task And Technical Expertise Ppt PowerPoint Presentation Infographics Templates
Presenting this set of slides with name six step of capability management people task and technical expertise ppt powerpoint presentation infographics templates. This is a six stage process. The stages in this process are competency framework, performance management, succession planning. This is a completely editable PowerPoint presentation and is available for immediate download. Download now and impress your audience.
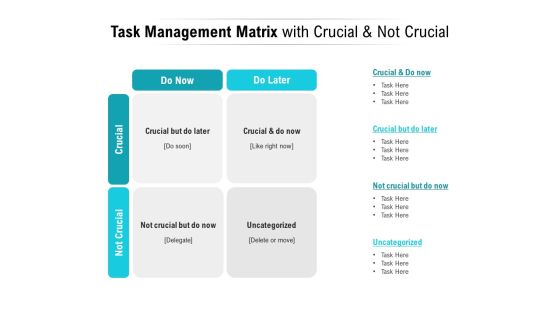
Task Management Matrix With Crucial And Not Crucial Ppt PowerPoint Presentation Infographics Background Image
Presenting this set of slides with name task management matrix with crucial and not crucial ppt powerpoint presentation infographics background image. This is a four stage process. The stages in this process are delegate, uncategorized, crucial. This is a completely editable PowerPoint presentation and is available for immediate download. Download now and impress your audience.

Understanding Task And Project Dependencies Ppt PowerPoint Presentation Infographics Slide Download
Presenting this set of slides with name understanding task and project dependencies ppt powerpoint presentation infographics slide download. The topics discussed in these slides are dependencies, casual, resource, preferential. This is a completely editable PowerPoint presentation and is available for immediate download. Download now and impress your audience.

Business Activity Flows Optimization Task Categories Of ERP Systems Ppt PowerPoint Presentation Infographics Structure PDF
Presenting this set of slides with name business activity flows optimization task categories of erp systems ppt powerpoint presentation infographics structure pdf. This is a four stage process. The stages in this process are administration, scheduling, information, analysis, data storage for business transactions. This is a completely editable PowerPoint presentation and is available for immediate download. Download now and impress your audience.

Strategies To Mitigate Cyber Security Risks Recovery Task List Maintenance Ppt Infographics Designs Download PDF
Presenting this set of slides with name strategies to mitigate cyber security risks recovery task list maintenance ppt infographics designs download pdf. This is a one stage process. The stages in this process are estimated time, actual time, assigned, comments, retrieve business continuity plans. This is a completely editable PowerPoint presentation and is available for immediate download. Download now and impress your audience.

Project Portfolio Management PPM How We Will Prioritize Our Tasks Ppt Infographics PDF
Presenting this set of slides with name project portfolio management ppm how we will prioritize our tasks ppt infographics pdf. This is a four stage process. The stages in this process are urgent, insignificant, significant. This is a completely editable PowerPoint presentation and is available for immediate download. Download now and impress your audience.

Dependency Structure With Project Task Planning Ppt PowerPoint Presentation Infographics Backgrounds PDF
Presenting this set of slides with name dependency structure with project task planning ppt powerpoint presentation infographics backgrounds pdf. The topics discussed in these slides are start project, requirement gathering, system build, system testing, user acceptance, integration testing. This is a completely editable PowerPoint presentation and is available for immediate download. Download now and impress your audience.
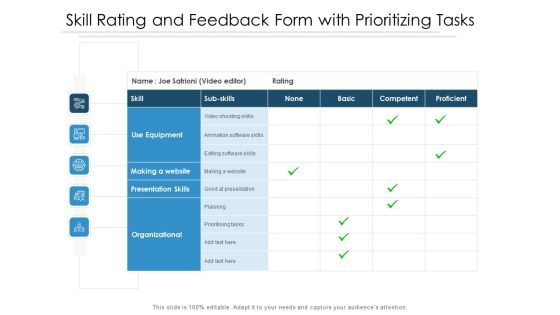
Rating And Feedback Form With Prioritizing Tasks Ppt PowerPoint Presentation Infographics Show PDF
Showcasing this set of slides titled rating and feedback form with prioritizing tasks ppt powerpoint presentation infographics show pdf. The topics addressed in these templates are use equipment, making website, presentation skills, organizational. All the content presented in this PPT design is completely editable. Download it and make adjustments in color, background, font etc. as per your unique business setting.
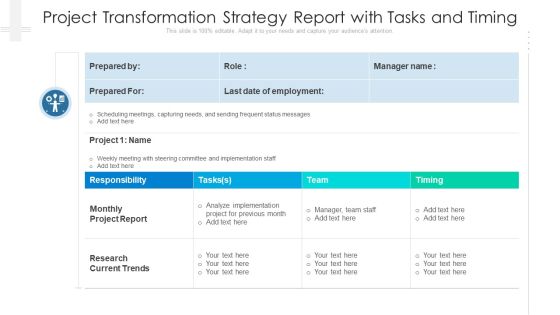
Project Transformation Strategy Report With Tasks And Timing Ppt PowerPoint Presentation Infographics Background Designs PDF
Deliver an awe-inspiring pitch with this creative project transformation strategy report with tasks and timing ppt powerpoint presentation infographics background designs pdf bundle. Topics like responsibility, monthly project report, research current trends can be discussed with this completely editable template. It is available for immediate download depending on the needs and requirements of the user.

Team Tasks Target Status And Timeline Ppt Infographics Graphics Tutorials PDF
This slide illustrates task schedule of project. It includes tasks, employee names the tasks are assigned to, status and time schedule etc. Pitch your topic with ease and precision using this Team Tasks Target Status And Timeline Ppt Infographics Graphics Tutorials PDF. This layout presents information on Team Tasks, Overdue, Completed, Legends. It is also available for immediate download and adjustment. So, changes can be made in the color, design, graphics or any other component to create a unique layout.
