Percentage Charts
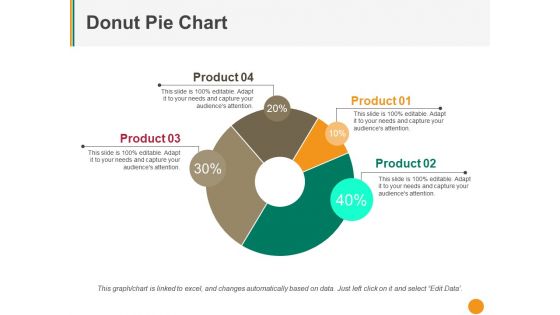
Donut Pie Chart Ppt PowerPoint Presentation Pictures Background
This is a donut pie chart ppt powerpoint presentation pictures background. This is a four stage process. The stages in this process are product, percentage, business, management, process.
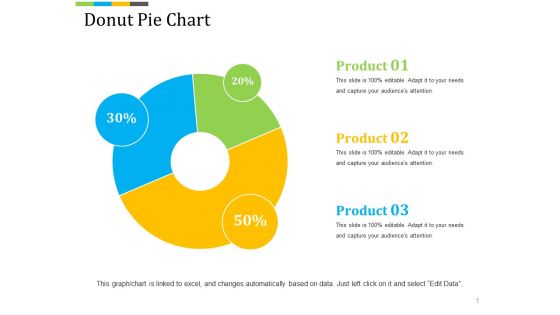
Donut Pie Chart Ppt PowerPoint Presentation Slides Outfit
This is a donut pie chart ppt powerpoint presentation slides outfit. This is a three stage process. The stages in this process are product, percentage, business, process, management.
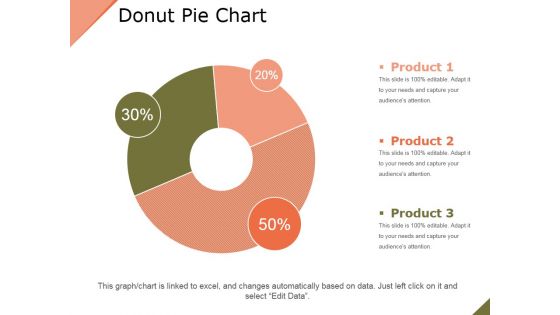
Donut Pie Chart Ppt PowerPoint Presentation Layouts Outfit
This is a donut pie chart ppt powerpoint presentation layouts outfit. This is a three stage process. The stages in this process are product, business, percentage, finance, marketing.
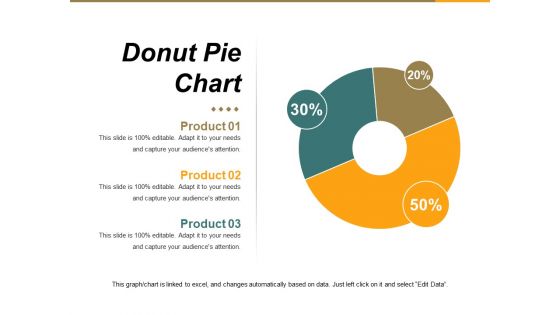
Donut Pie Chart Ppt PowerPoint Presentation Portfolio Background
This is a donut pie chart ppt powerpoint presentation portfolio background. This is a three stage process. The stages in this process are percentage, business, marketing, process.

Donut Pie Chart Ppt PowerPoint Presentation Model Pictures
This is a donut pie chart ppt powerpoint presentation model pictures. This is a six stage process. The stages in this process are product, percentage, finance, year, business.

Donut Pie Chart Ppt PowerPoint Presentation Model Show
This is a donut pie chart ppt powerpoint presentation model show. This is a three stage process. The stages in this process are product, donut, percentage, finance, business.
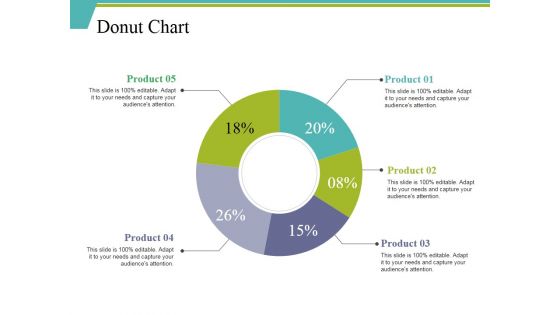
Donut Chart Ppt PowerPoint Presentation Ideas Background Designs
This is a donut chart ppt powerpoint presentation ideas background designs. This is a five stage process. The stages in this process are percentage, finance, donut, business, product.

Donut Pie Chart Ppt PowerPoint Presentation Pictures Graphics
This is a donut pie chart ppt powerpoint presentation pictures graphics. This is a four stage process. The stages in this process are product, business, percentage, donut, finance.
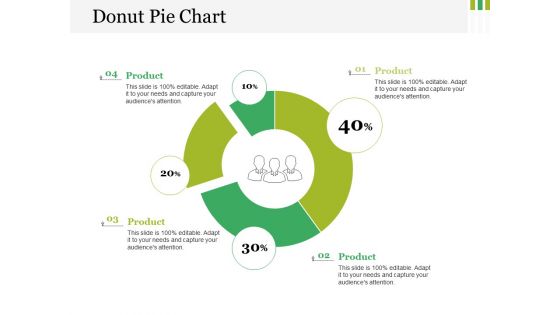
Donut Pie Chart Ppt PowerPoint Presentation Styles Clipart
This is a donut pie chart ppt powerpoint presentation styles clipart. This is a four stage process. The stages in this process are business, marketing, management, circular, percentage.

Donut Pie Chart Ppt PowerPoint Presentation Outline Mockup
This is a donut pie chart ppt powerpoint presentation outline mockup. This is a four stage process. The stages in this process are product, donut, percentage, finance, business.
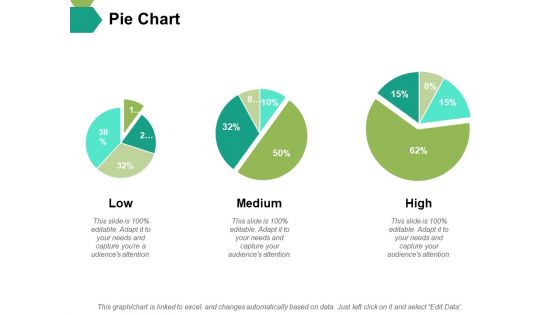
Pie Chart Ppt PowerPoint Presentation Slides Master Slide
This is a pie chart ppt powerpoint presentation slides master slide. This is a three stage process. The stages in this process are pie, process, percentage, finance, business.

Column Chart Ppt PowerPoint Presentation Infographics Graphics Template
This is a column chart ppt powerpoint presentation infographics graphics template. This is a two stage process. The stages in this process are percentage, product, business, management, marketing.

Pie Chart Ppt PowerPoint Presentation Infographic Template Topics
This is a pie chart ppt powerpoint presentation infographic template topics. This is a three stage process. The stages in this process are percentage, management, marketing, business.

Donut Pie Chart Ppt PowerPoint Presentation Outline Deck
This is a donut pie chart ppt powerpoint presentation outline deck. This is a four stage process. The stages in this process are finance, business, marketing, management, percentage.
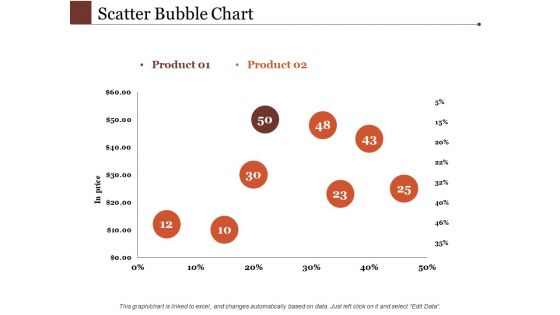
Scatter Bubble Chart Ppt PowerPoint Presentation Inspiration Demonstration
This is a scatter bubble chart ppt powerpoint presentation inspiration demonstration. This is a two stage process. The stages in this process are percentage, product, business, management, marketing.
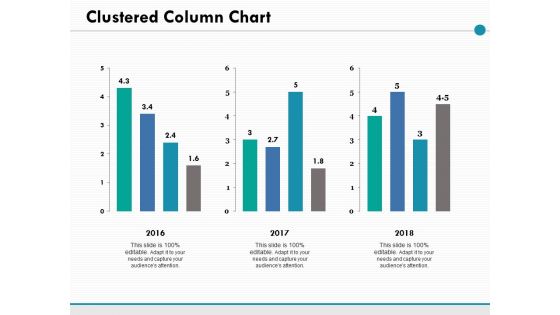
Clustered Column Chart Ppt PowerPoint Presentation Ideas Picture
This is a clustered column chart ppt powerpoint presentation ideas picture. This is a three stage process. The stages in this process are percentage, product, management, marketing.

Donut Pie Chart Ppt PowerPoint Presentation Model Information
This is a donut pie chart ppt powerpoint presentation model information. This is a five stage process. The stages in this process are percentage, product, business.
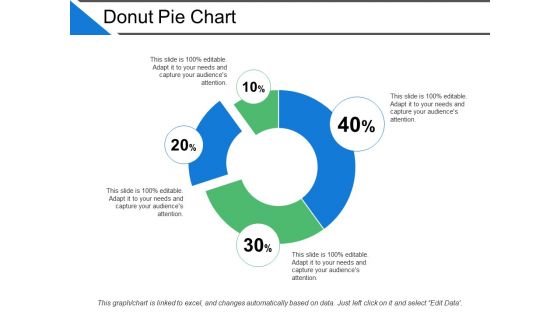
Donut Pie Chart Ppt PowerPoint Presentation Model Outline
This is a donut pie chart ppt powerpoint presentation model outline. This is a four stage process. The stages in this process are percentage, product, business.
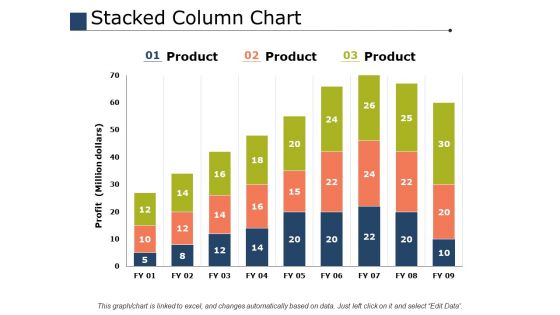
Stacked Column Chart Ppt PowerPoint Presentation Slides Files
This is a stacked column chart ppt powerpoint presentation slides files. This is a three stage process. The stages in this process are percentage, product, business, marketing.

Chart Implementation Of Donut Diagram Simple Business Plan Templates PowerPoint
We present our chart implementation of donut diagram simple business plan templates PowerPoint.Present our Ring Charts PowerPoint Templates because Our PowerPoint Templates and Slides will steer your racing mind. Hit the right buttons and spur on your audience. Download and present our Process and Flows PowerPoint Templates because Our PowerPoint Templates and Slides will let Your superior ideas hit the target always and everytime. Use our Flow Charts PowerPoint Templates because Our PowerPoint Templates and Slides have the Brilliant backdrops. Guaranteed to illuminate the minds of your audience. Use our Marketing PowerPoint Templates because our PowerPoint Templates and Slides will give your ideas the shape. Use our Business PowerPoint Templates because You are an avid believer in ethical practices. Highlight the benefits that accrue with our PowerPoint Templates and Slides.Use these PowerPoint slides for presentations relating to Pie, chart, isolated, white, bar, business, concept, sign, render, spectrum, bright, diagram, circle, percentage, light, graphic,element, digital, report, marketing, abstract, graph, modern, creative, illustration, icon, up, web, design, painting, set, art, progress, effect, style, steps,ten,pattern, financial. The prominent colors used in the PowerPoint template are Gray, White, Blue.

Public Health Barriers Column Chart With Key Insights Portrait PDF
This slide includes barriers in public heath services to avoid wasteful expenditure . It includes parts such barriers and health services percentage.Pitch your topic with ease and precision using this Public Health Barriers Column Chart With Key Insights Portrait PDF. This layout presents information on Inadequate Funds, Global Survey, Government Regulations. It is also available for immediate download and adjustment. So, changes can be made in the color, design, graphics or any other component to create a unique layout.
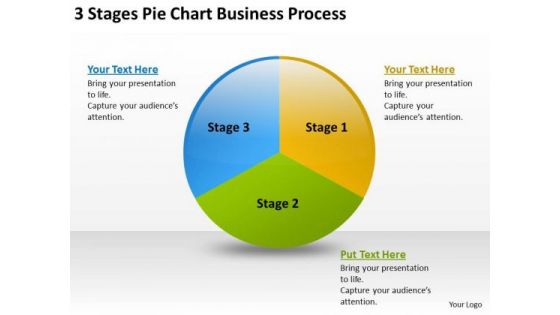
Chart Business PowerPoint Theme Process Writing Simple Plan Templates
We present our chart business powerpoint theme process writing simple plan templates.Download and present our Circle Charts PowerPoint Templates because Our PowerPoint Templates and Slides are aesthetically designed to attract attention. We gaurantee that they will grab all the eyeballs you need. Download and present our Flow Charts PowerPoint Templates because It is Aesthetically crafted by artistic young minds. Our PowerPoint Templates and Slides are designed to display your dexterity. Present our Business PowerPoint Templates because You can Stir your ideas in the cauldron of our PowerPoint Templates and Slides. Cast a magic spell on your audience. Download and present our Shapes PowerPoint Templates because you can Break through with our PowerPoint Templates and Slides. Bring down the mental barriers of your audience. Present our Marketing PowerPoint Templates because It can Bubble and burst with your ideas.Use these PowerPoint slides for presentations relating to Analyzing, business, capital, commerce, communication, company, decrease, descending, direction, earnings, economic, economy, finance, financial, graph,grow, growth, index, information, investment, leader, manage, management, marketing, money, organization, part, partition, percentage, pie, piechart, graph, piece, plan, presentation, process, profit, progress, report, resource, results, selling, slice, statistic, success, system, team, theory. The prominent colors used in the PowerPoint template are Green, Yellow, Blue.

New Technology Usage Column Chart With Key Insights Brochure PDF
This slide shows use of new technologies in 4 years chart to determine economic growth and development. It Includes aspects such as years and technology use percentage.Pitch your topic with ease and precision using this New Technology Usage Column Chart With Key Insights Brochure PDF. This layout presents information on Technology Gradually, Increased Reasons, Developing Countries. It is also available for immediate download and adjustment. So, changes can be made in the color, design, graphics or any other component to create a unique layout.

Bar Chart Ppt PowerPoint Presentation Infographics Format Ideas
This is a bar chart ppt powerpoint presentation infographics format ideas. This is a two stage process. The stages in this process are bar graph, product, financial year, sales in percentage.

Column Chart Ppt PowerPoint Presentation Gallery Slide Portrait
This is a column chart ppt powerpoint presentation gallery slide portrait. This is a two stage process. The stages in this process are sales in percentage, financial year, product, bar graph, growth.
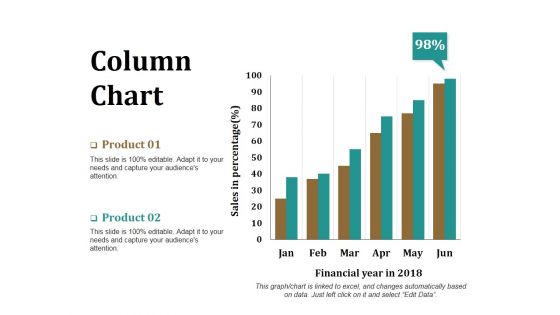
Column Chart Ppt PowerPoint Presentation Model Graphics Download
This is a column chart ppt powerpoint presentation model graphics download. This is a two stage process. The stages in this process are product, financial year, sales in percentage, bar graph, success.
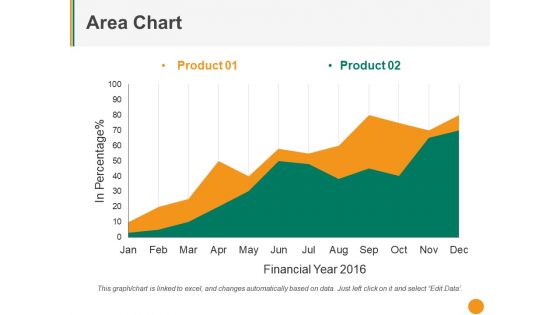
Area Chart Ppt PowerPoint Presentation File Graphic Tips
This is a area chart ppt powerpoint presentation file graphic tips. This is a two stage process. The stages in this process are product, in percentage, financial year, business, growth.

Line Chart Ppt PowerPoint Presentation Model Design Templates
This is a line chart ppt powerpoint presentation model design templates. This is a two stage process. The stages in this process are sales in percentage, financial years, product.
Scatter Line Chart Ppt PowerPoint Presentation Icon Files
This is a scatter line chart ppt powerpoint presentation icon files. This is a one stage process. The stages in this process are dollar in millions, product, sales in percentage.
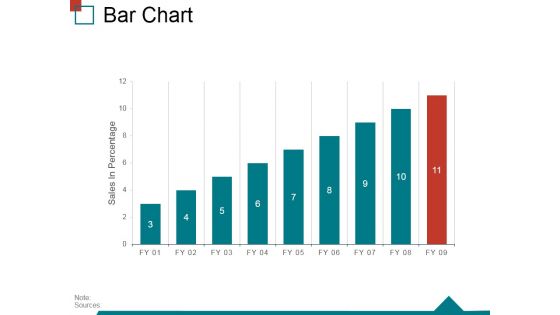
Bar Chart Ppt PowerPoint Presentation Infographic Template Skills
This is a bar chart ppt powerpoint presentation infographic template skills. This is a nine stage process. The stages in this process are sales in percentage, finance, business, marketing, strategy, success.
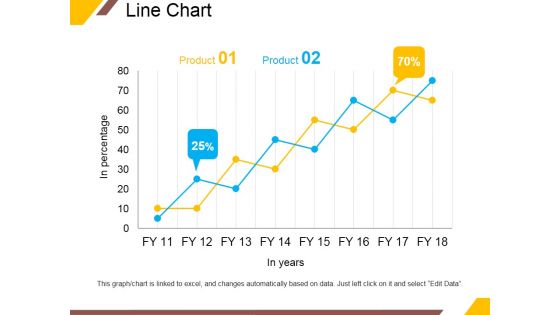
Line Chart Ppt PowerPoint Presentation Portfolio Infographic Template
This is a line chart ppt powerpoint presentation portfolio infographic template. This is a two stage process. The stages in this process are product, in years, business, percentage, growth.
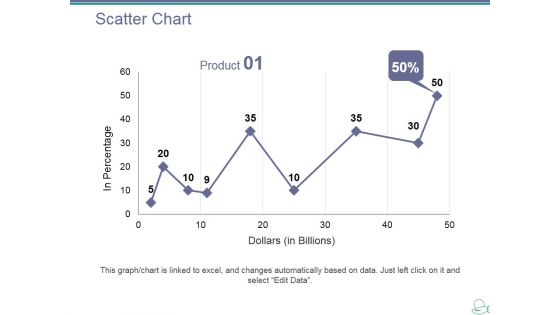
Scatter Chart Ppt PowerPoint Presentation Ideas Designs Download
This is a scatter chart ppt powerpoint presentation ideas designs download. This is a one stage process. The stages in this process are product, dollar, in percentage, growth, success.
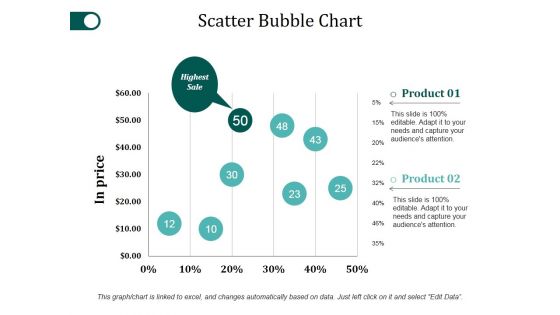
Scatter Bubble Chart Ppt PowerPoint Presentation Styles Objects
This is a scatter bubble chart ppt powerpoint presentation styles objects. This is a two stage process. The stages in this process are product, in price, highest sale, percentage, finance.

Area Chart Ppt PowerPoint Presentation Show Layout Ideas
This is a area chart ppt powerpoint presentation show layout ideas. This is a two stage process. The stages in this process are product, in percentage, financial year, growth.

Line Chart Ppt PowerPoint Presentation Outline Infographic Template
This is a line chart ppt powerpoint presentation outline infographic template. This is a two stage process. The stages in this process are in percentage, product, in year, growth, success.
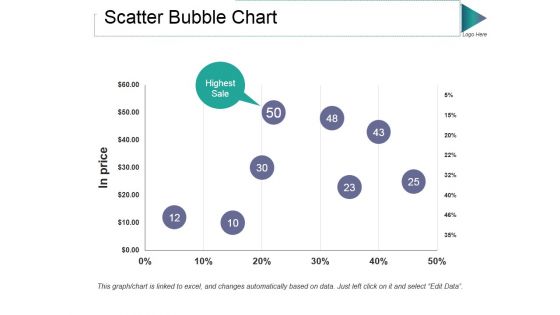
Scatter Bubble Chart Ppt PowerPoint Presentation Gallery Guidelines
This is a scatter bubble chart ppt powerpoint presentation gallery guidelines. This is a one stage process. The stages in this process are in price, highest sale, percentage, finance, business.
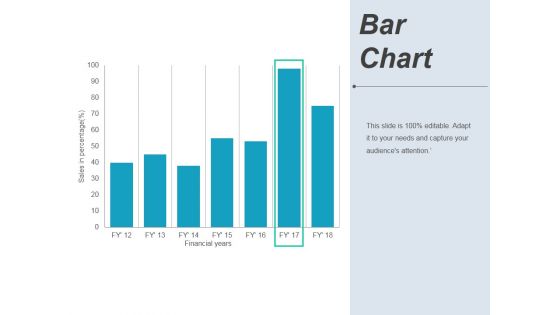
Bar Chart Ppt PowerPoint Presentation Pictures Background Image
This is a bar chart ppt powerpoint presentation pictures background image. This is a seven stage process. The stages in this process are financial years, sales in percentage, graph, business.
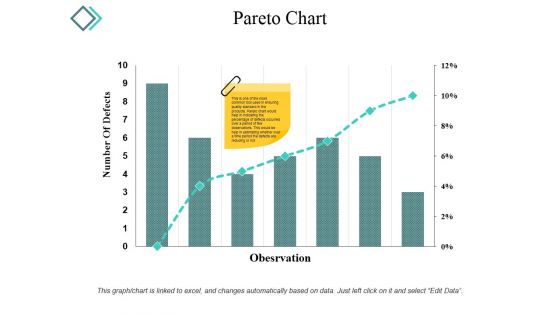
Pareto Chart Ppt PowerPoint Presentation Infographic Template Microsoft
This is a pareto chart ppt powerpoint presentation infographic template microsoft. This is a seven stage process. The stages in this process are number of defects, observation, graph, percentage, business.
Donut Pie Chart Ppt PowerPoint Presentation Icon Background Images
This is a donut pie chart ppt powerpoint presentation icon background images. This is a four stage process. The stages in this process are donut, process, planning, percentage, finance.

Scatter Bubble Chart Ppt PowerPoint Presentation Diagram Ppt
This is a scatter bubble chart ppt powerpoint presentation diagram ppt. This is a two stage process. The stages in this process are product, in price, highest sale, percentage, business, marketing.
Donut Pie Chart Ppt PowerPoint Presentation Icon Slide Portrait
This is a donut pie chart ppt powerpoint presentation icon slide portrait. This is a five stage process. The stages in this process are product, percentage, finance, donut, business.

Area Chart Ppt PowerPoint Presentation Layouts Graphics Example
This is a area chart ppt powerpoint presentation layouts graphics example. This is a two stage process. The stages in this process are sales in percentage, financial year, business, marketing, presentation.
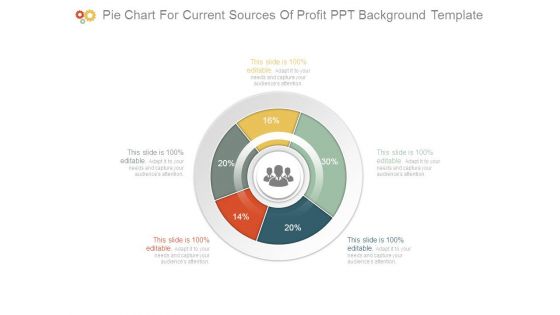
Pie Chart For Current Sources Of Profit Ppt Background Template
This is a pie chart for current sources of profit ppt background template. This is a five stage process. The stages in this process are finance, success, business, marketing, percentage, donut.
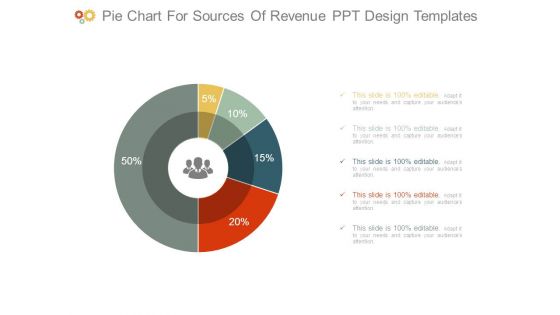
Pie Chart For Sources Of Revenue Ppt Design Templates
This is a pie chart for sources of revenue ppt design templates. This is a five stage process. The stages in this process are finance, success, business, marketing, percentage, donut.
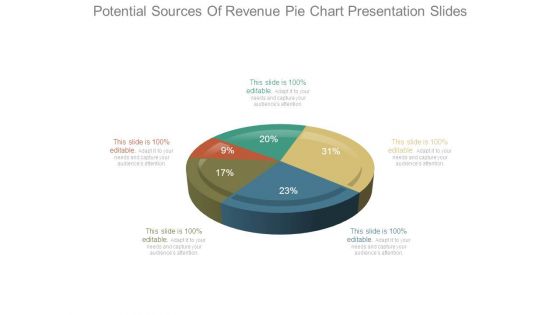
Potential Sources Of Revenue Pie Chart Presentation Slides
This is a potential sources of revenue pie chart presentation slides. This is a five stage process. The stages in this process are finance, success, business, marketing, percentage, pie.

Financial Reporting And Analysis Pie Chart Ppt PowerPoint Presentation Guidelines
This is a financial reporting and analysis pie chart ppt powerpoint presentation guidelines. This is a four stage process. The stages in this process are process, percentage, business, marketing, finance.
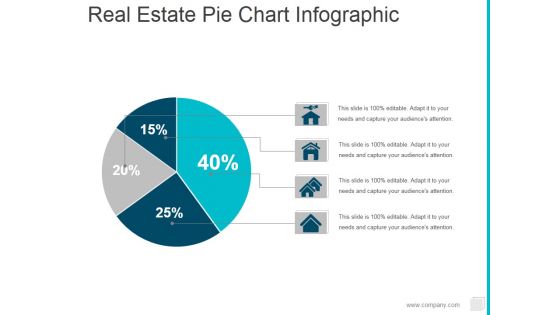
Real Estate Pie Chart Infographic Ppt PowerPoint Presentation Ideas Shapes
This is a real estate pie chart infographic ppt powerpoint presentation ideas shapes. This is a four stage process. The stages in this process are pie, finance, marketing, percentage.
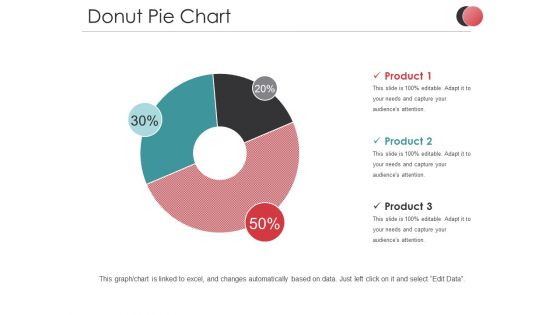
Donut Pie Chart Ppt PowerPoint Presentation Inspiration Background Image
This is a donut pie chart ppt powerpoint presentation inspiration background image. This is a three stage process. The stages in this process are product, percentage, business, marketing, process.
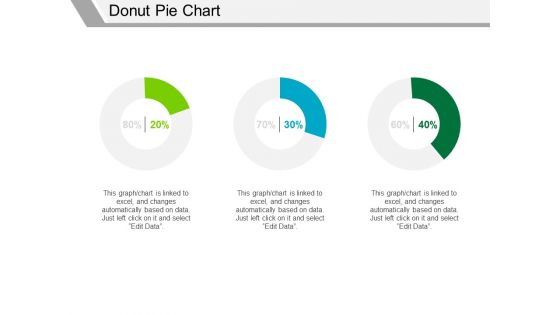
Donut Pie Chart Ppt PowerPoint Presentation Infographics Background Designs
This is a donut pie chart ppt powerpoint presentation infographics background designs. This is a three stage process. The stages in this process are finance, business, marketing, strategy, percentage.
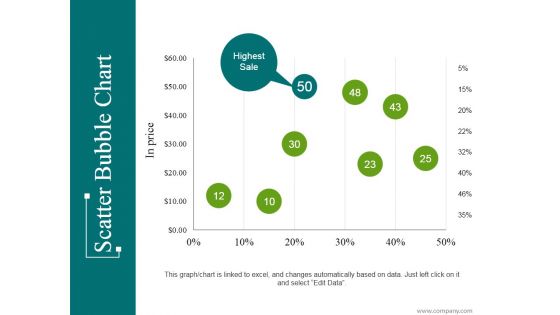
Scatter Bubble Chart Ppt PowerPoint Presentation Infographic Template Introduction
This is a scatter bubble chart ppt powerpoint presentation infographic template introduction. This is a eight stage process. The stages in this process are highest sale, business, marketing, percentage, finance.
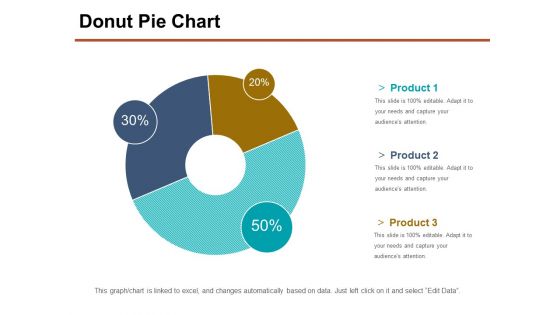
Donut Pie Chart Ppt PowerPoint Presentation Professional Slide Portrait
This is a donut pie chart ppt powerpoint presentation professional slide portrait. This is a three stage process. The stages in this process are product, percentage, business, management, process.
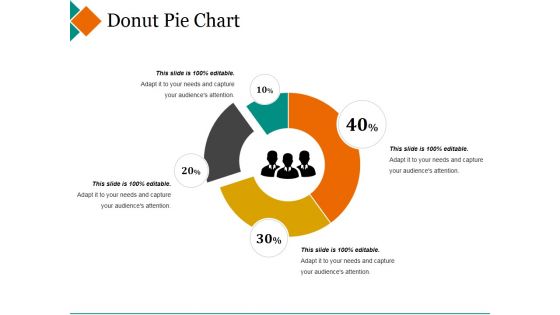
Donut Pie Chart Ppt PowerPoint Presentation Pictures Design Inspiration
This is a donut pie chart ppt powerpoint presentation pictures design inspiration. This is a four stage process. The stages in this process are maximum, donut, minimum, percentage, finance.
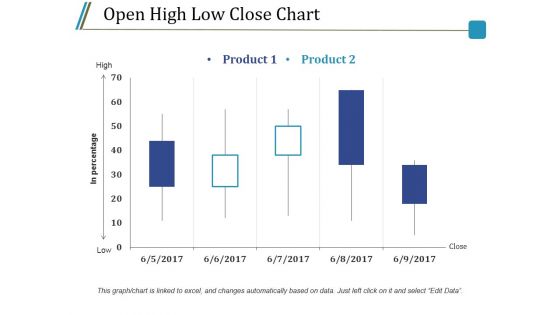
Open High Low Close Chart Ppt PowerPoint Presentation Styles Model
This is a open high low close chart ppt powerpoint presentation styles model. This is a five stage process. The stages in this process are product, high, low, in percentage, close.

Open High Low Close Chart Ppt PowerPoint Presentation Outline Rules
This is a open high low close chart ppt powerpoint presentation outline rules. This is a two stage process. The stages in this process are product, high, low, close, in percentage.
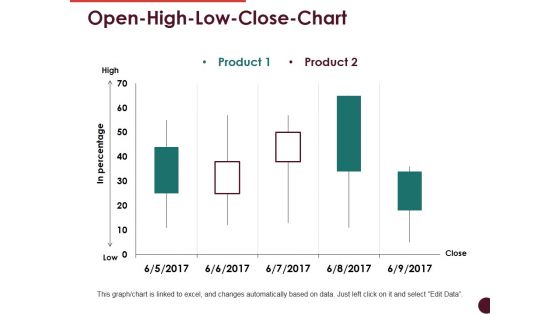
Open High Low Close Chart Ppt PowerPoint Presentation Professional Visuals
This is a open high low close chart ppt powerpoint presentation professional visuals. This is a two stage process. The stages in this process are high, low, in percentage, product, close.

Donut Pie Chart Ppt PowerPoint Presentation Professional Graphic Images
This is a donut pie chart ppt powerpoint presentation professional graphic images. This is a three stage process. The stages in this process are percentage, finance, donut, business, marketing.
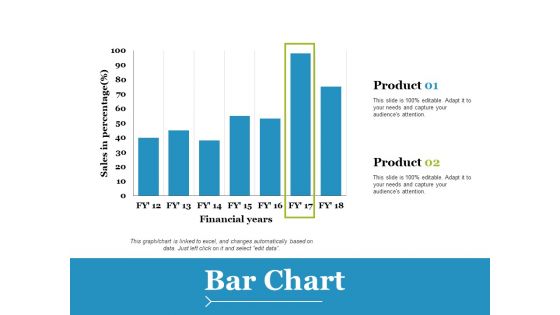
Bar Chart Ppt PowerPoint Presentation Slides Example File
This is a bar chart ppt powerpoint presentation slides example file. This is a two stage process. The stages in this process are product, financial years, sales in percentage.
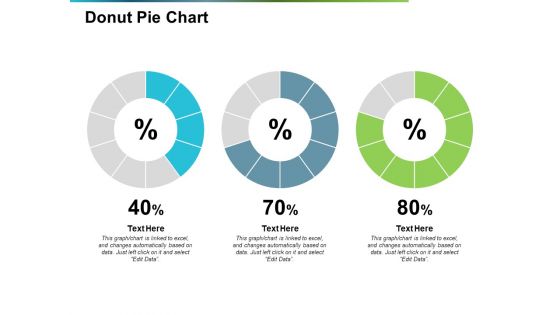
Donut Pie Chart Ppt PowerPoint Presentation Show Graphics Download
This is a donut pie chart ppt powerpoint presentation show graphics download. This is a three stage process. The stages in this process are percentage, finance, donut, business, marketing.

Bar Chart Ppt PowerPoint Presentation Infographic Template Graphics Design
This is a bar chart ppt powerpoint presentation infographic template graphics design. This is a five stage process. The stages in this process are management, marketing, business, percentage, product.
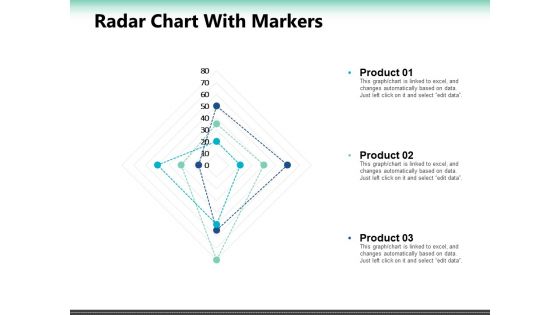
Radar Chart With Markers Ppt PowerPoint Presentation Summary Slide Portrait
This is a radar chart with markers ppt powerpoint presentation summary slide portrait. This is a seven stage process. The stages in this process are percentage, product, business, marketing.

 Home
Home