Parallel Process
Six Staged Infographics Square With Business Icons Powerpoint Templates
This business diagram displays circular puzzle infographic. This editable slide is suitable to present global communication. Use this diagram for business and finance related topics and display complete data analysis in your presentation.
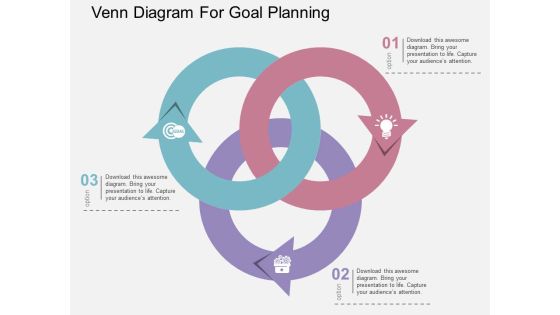
Venn Diagram For Goal Planning Powerpoint Templates
This PowerPoint template contains the graphics of Venn diagram. This Venn diagram maybe used to depict goal planning. Display target achievement and success concepts in your presentation by using this creative diagram.
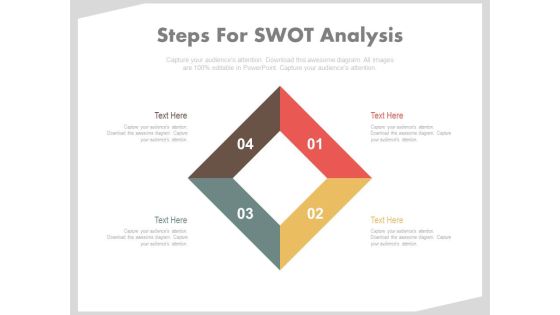
Diamond Design For Swot Analysis Powerpoint Slides
This PPT slide has been designed with graphics of four steps diamond diagram. This business diagram helps to exhibit SWOT analysis. Use this PowerPoint template to build an exclusive presentation.
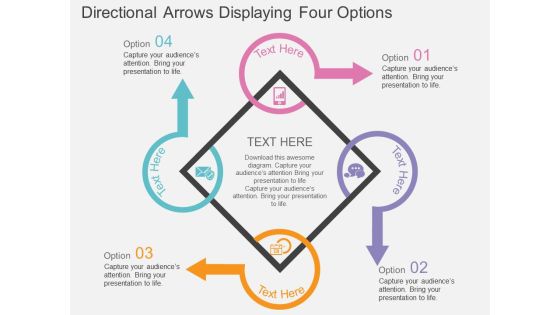
Directional Arrows Displaying Four Options Powerpoint Template
This business slide has been designed with diagram of directional arrows. Download this diagram to depict four business options. Make your mark with this unique slide and create an impression that will endure.
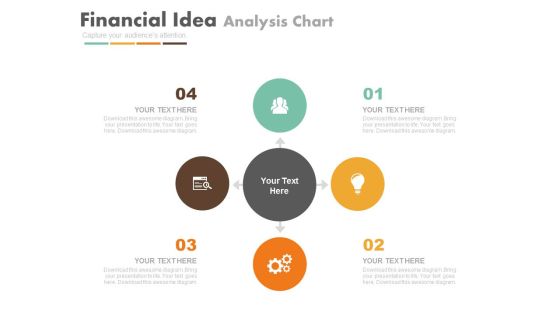
Four Staged Hub And Spokes Diagram Powerpoint Template
Four staged hub and spokes diagram has been used to design this business diagram. This PowerPoint template may be used to depict integration strategy. Download this professional slide to make impressive presentation.
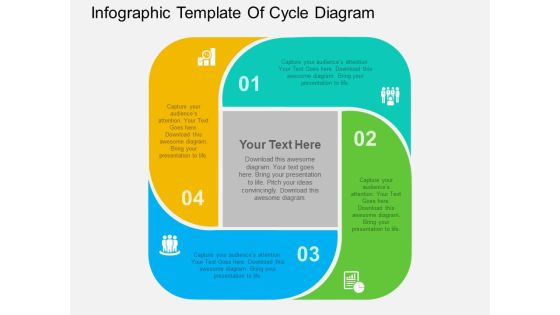
Infographic Template Of Cycle Diagram Powerpoint Templates
Create dynamic presentations with our professional template containing infographic cycle diagram. This diagram is useful to display chain of business activities. Download this template to leave permanent impression on your audience.

Crowd Sourced Equity Funding Pitch Deck Total Addressable Market Ppt Summary Infographics PDF
The slide provides the market overview of the target market which includes total addressable market, serviceable available market and serviceable obtainable market. Presenting crowd sourced equity funding pitch deck total addressable market ppt summary infographics pdf to provide visual cues and insights. Share and navigate important information on four stages that need your due attention. This template can be used to pitch topics like market opportunity, available market, serviceable market, segment opportunity. In addtion, this PPT design contains high resolution images, graphics, etc, that are easily editable and available for immediate download.

Seven Colored Concentric Circles Graphic For Business Planning Sources Slides PDF
Presenting seven colored concentric circles graphic for business planning sources slides pdf to dispense important information. This template comprises seven stages. It also presents valuable insights into the topics including seven colored concentric circles graphic for business planning sources. This is a completely customizable PowerPoint theme that can be put to use immediately. So, download it and address the topic impactfully.
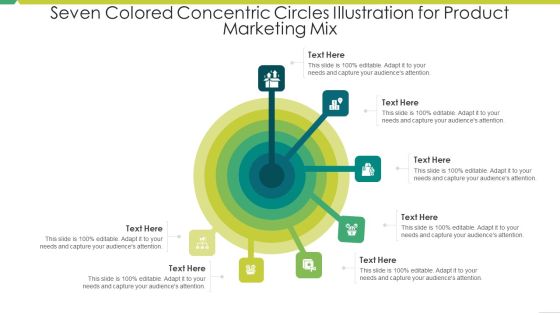
Seven Colored Concentric Circles Illustration For Product Marketing Mix Formats PDF
Persuade your audience using this seven colored concentric circles illustration for product marketing mix formats pdf. This PPT design covers seven stages, thus making it a great tool to use. It also caters to a variety of topics including seven colored concentric circles illustration for product marketing mix. Download this PPT design now to present a convincing pitch that not only emphasizes the topic but also showcases your presentation skills.

Seven Colored Concentric Circles Infographic For Big Data Engineer Career Path Professional PDF
Presenting seven colored concentric circles infographic for big data engineer career path professional pdf to dispense important information. This template comprises seven stages. It also presents valuable insights into the topics including seven colored concentric circles infographic for big data engineer career path. This is a completely customizable PowerPoint theme that can be put to use immediately. So, download it and address the topic impactfully.
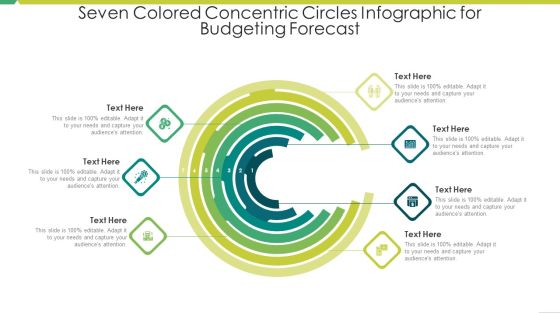
Seven Colored Concentric Circles Infographic For Budgeting Forecast Sample PDF
Persuade your audience using this seven colored concentric circles infographic for budgeting forecast sample pdf. This PPT design covers seven stages, thus making it a great tool to use. It also caters to a variety of topics including seven colored concentric circles infographic for budgeting forecast. Download this PPT design now to present a convincing pitch that not only emphasizes the topic but also showcases your presentation skills.

Seven Colored Concentric Circles Infographic For Budgeting Forecast Information PDF
Presenting seven colored concentric circles infographic for budgeting forecast information pdf to dispense important information. This template comprises seven stages. It also presents valuable insights into the topics including seven colored concentric circles infographic for budgeting forecast. This is a completely customizable PowerPoint theme that can be put to use immediately. So, download it and address the topic impactfully.

Seven Colored Concentric Circles Slide For Affiliate Marketing Costing Introduction PDF
Persuade your audience using this seven colored concentric circles slide for affiliate marketing costing introduction pdf. This PPT design covers seven stages, thus making it a great tool to use. It also caters to a variety of topics including seven colored concentric circles slide for affiliate marketing costing. Download this PPT design now to present a convincing pitch that not only emphasizes the topic but also showcases your presentation skills.
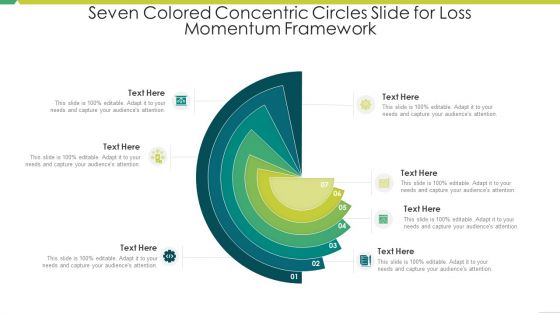
Seven Colored Concentric Circles Slide For Loss Momentum Framework Diagrams PDF
Presenting seven colored concentric circles slide for loss momentum framework diagrams pdf to dispense important information. This template comprises seven stages. It also presents valuable insights into the topics including seven colored concentric circles slide for loss momentum frameworkS. This is a completely customizable PowerPoint theme that can be put to use immediately. So, download it and address the topic impactfully.
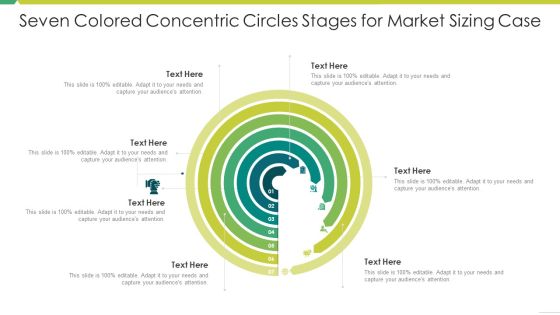
Seven Colored Concentric Circles Stages For Market Sizing Case Template PDF
Presenting seven colored concentric circles stages for market sizing case template pdf to dispense important information. This template comprises seven stages. It also presents valuable insights into the topics including seven colored concentric circles stages for market sizing case. This is a completely customizable PowerPoint theme that can be put to use immediately. So, download it and address the topic impactfully.

Business Plan Methods Tools And Templates Set 2 Six Stage Scenario Planning Mockup PDF
Following slide displays scenario planning in six stages namely iterate and act, understand each scenario and develop the strategy, accordingly, develop two by two matrix, select top two drivers of change, clustering of issues into groups and brainstorming of major issue which impacts the sector. Presenting business plan methods tools and templates set 2 six stage scenario planning mockup pdf to provide visual cues and insights. Share and navigate important information on six stages that need your due attention. This template can be used to pitch topics like brainstorming of major issue which impacts the sector, clustering of issues into group, select two drivers of change, develop two by two matrix, iterate and act. In addtion, this PPT design contains high resolution images, graphics, etc, that are easily editable and available for immediate download.
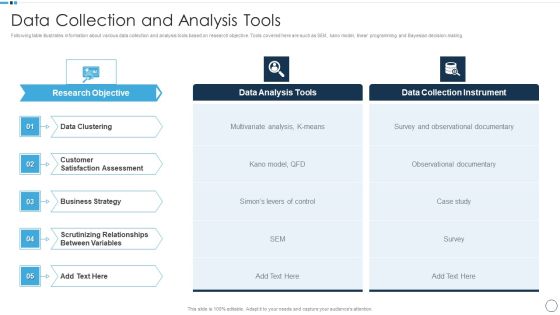
QA Plan Set 1 Data Collection And Analysis Tools Infographics PDF
Presenting QA Plan Set 1 Data Collection And Analysis Tools Infographics PDF to provide visual cues and insights. Share and navigate important information on five stages that need your due attention. This template can be used to pitch topics like Data Clustering, Business Strategy, Customer Satisfaction Assessment. In addtion, this PPT design contains high resolution images, graphics, etc, that are easily editable and available for immediate download.
Key Seven Rules Of System Testing With Icons Ppt PowerPoint Presentation Portfolio Styles PDF Ppt PowerPoint Presentation File Layouts PDF
Persuade your audience using this key seven rules of system testing with icons ppt powerpoint presentation portfolio styles pdf ppt powerpoint presentation file layouts pdf. This PPT design covers seven stages, thus making it a great tool to use. It also caters to a variety of topics including testing shows presence of defects, exhaustive testing is impossible, early testing, defect clustering, pesticide paradox. Download this PPT design now to present a convincing pitch that not only emphasizes the topic but also showcases your presentation skills.

Business Intelligence And Big Transformation Toolkit Data Analytics Value Stream Chain Guidelines PDF
This slide illustrates the series of activities required for analyzing the data. It contains information such as data preparation, exploratory analysis, and predictive analytics etc. This is a business intelligence and big transformation toolkit data analytics value stream chain guidelines pdf template with various stages. Focus and dispense information on six stages using this creative set, that comes with editable features. It contains large content boxes to add your information on topics like data preparation, exploratory data analysis, data visualization, classification and clustering, predictive analytics. You can also showcase facts, figures, and other relevant content using this PPT layout. Grab it now.
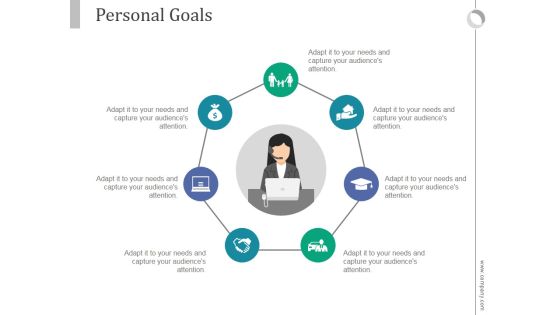
Personal Goals Ppt PowerPoint Presentation Examples
This is a personal goals ppt powerpoint presentation examples. This is a seven stage process. The stages in this process are business, marketing, process, communication, management.

Area Of Focus Ppt PowerPoint Presentation Graphics
This is a area of focus ppt powerpoint presentation graphics. This is a five stage process. The stages in this process are area, focus, arrow process, marketing, management.
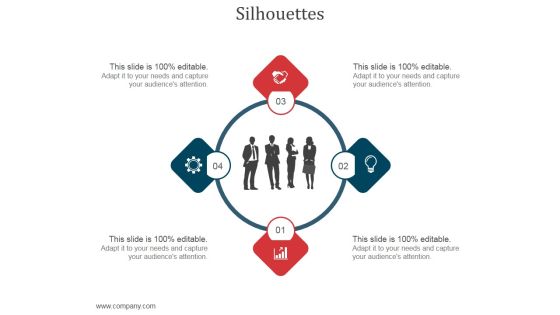
Silhouettes Ppt PowerPoint Presentation Inspiration
This is a silhouettes ppt powerpoint presentation inspiration. This is a four stage process. The stages in this process are business, process, people, marketing, success.
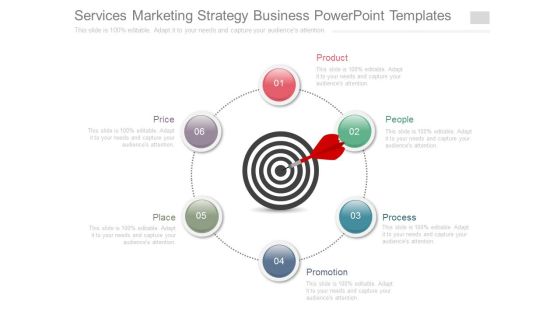
Services Marketing Strategy Business Powerpoint Templates
This is a services marketing strategy business powerpoint templates. This is a six stage process. The stages in this process are product, people, process, promotion, place, price.
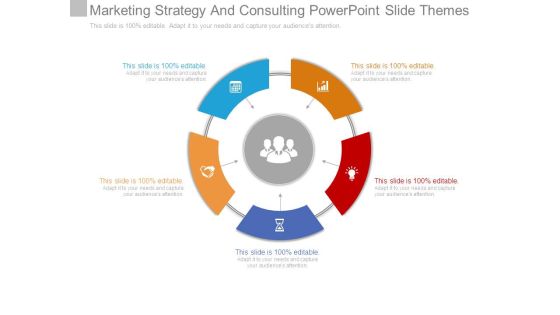
Marketing Strategy And Consulting Powerpoint Slide Themes
This is a marketing strategy and consulting powerpoint slide themes. This is a five stage process. The stages in this process are process, icons, business, marketing, arrows, strategy.
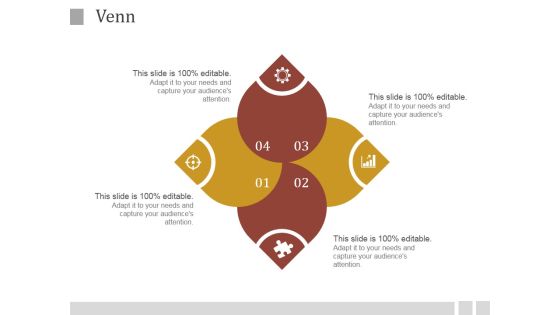
Venn Ppt PowerPoint Presentation Information
This is a venn ppt powerpoint presentation information. This is a four stage process. The stages in this process are business, icons, process, strategy, success.
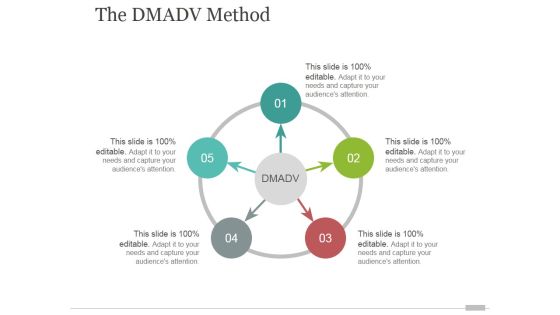
The Dmadv Method Ppt PowerPoint Presentation Design Templates
This is a the dmadv method ppt powerpoint presentation design templates. This is a five stage process. The stages in this process are arrows, process, business, marketing, strategy, analysis.
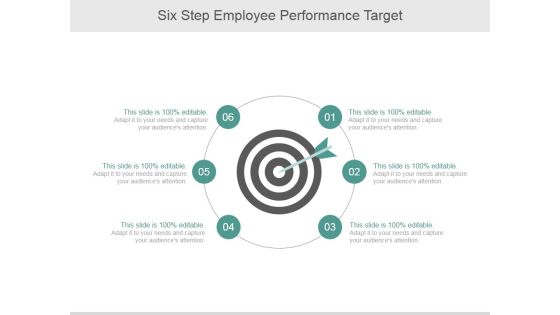
Six Step Employee Performance Target Ppt PowerPoint Presentation Professional
This is a six step employee performance target ppt powerpoint presentation professional. This is a six stage process. The stages in this process are circle, flow, process, strategy, planning, target.

Disaster Preparedness Ppt PowerPoint Presentation Design Ideas
This is a disaster preparedness ppt powerpoint presentation design ideas. This is a three stage process. The stages in this process are climate change, policy, research, practice, preparedness.

Capital Campaign Promotion Ppt PowerPoint Presentation Styles Graphic Images
This is a capital campaign promotion ppt powerpoint presentation styles graphic images. This is a eight stage process. The stages in this process are capital campaign promotion.

Segmenting Consumer Markets Powerpoint Slide Deck
This is a segmenting consumer markets powerpoint slide deck. This is a four stage process. The stages in this process are geographic, behavioral, demographic, psychographic.
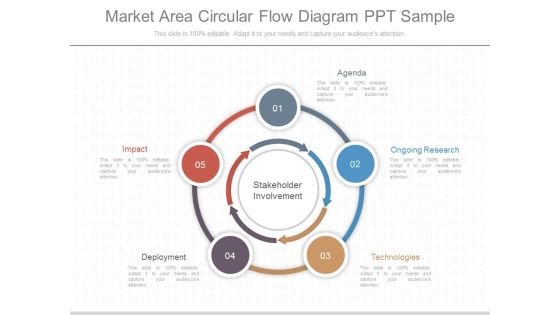
Market Area Circular Flow Diagram Ppt Sample
This is a market area circular flow diagram ppt sample. This is a five stage process. The stages in this process are agenda, ongoing research, technologies, deployment, impact.

Real Estate Investment Mentoring Sample Powerpoint Presentation
This is a real estate investment mentoring sample powerpoint presentation. This is a three stage process. The stages in this process are action, strategy, knowledge, mindset.
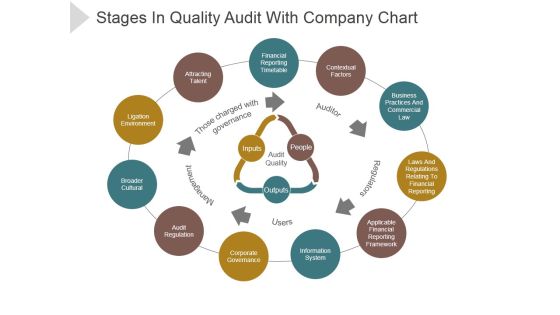
Stages In Quality Audit With Company Chart Ppt PowerPoint Presentation Files
This is a stages in quality audit with company chart ppt powerpoint presentation files. This is a eleven stage process. The stages in this process are financial reporting timetable, contextual factors, business practices and commercial law, applicable financial reporting framework.
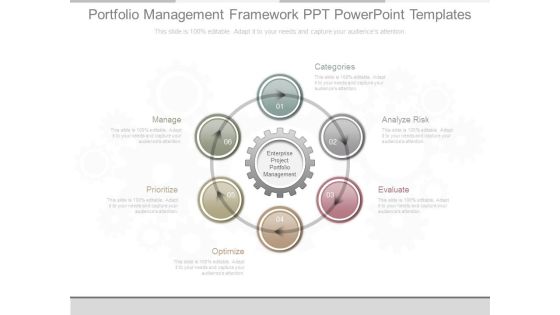
Portfolio Management Framework Ppt Powerpoint Templates
This is a portfolio management framework ppt powerpoint templates. This is a six stage process. The stages in this process are categories, manage, prioritize, optimize, analyze risk, evaluate, enterprise project portfolio management.

Circular Action Plan For Research Analysis Ppt PowerPoint Presentation Outline
This is a circular action plan for research analysis ppt powerpoint presentation outline. This is a five stage process. The stages in this process are Objectives Standards, Method Data Collection, Data Analysis, Implement Change, Reevaluate Review.

Account Strategy Presentation Powerpoint Example
This is a account strategy presentation powerpoint example. This is a five stage process. The stages in this process are define market, company sales training, account strategy, account investigation, account sales strategies.

Teamwork Projects And Ethics Ppt Slide Show
This is a teamwork projects and ethics ppt slide show. This is a five stage process. The stages in this process are elements of team, stages of development, scope of work, professional responsibility, teamwork.

Architectural Project Management Plan Ppt Summary
This is a architectural project management plan ppt summary. This is a seven stage process. The stages in this process are design, project closeout, owner occupancy, commissioning, construction, procurement, pre construction.
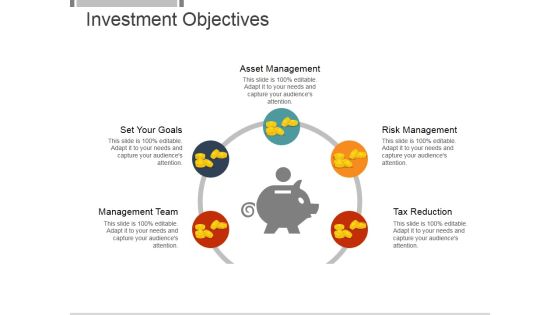
Investment Objectives Template 2 Ppt PowerPoint Presentation Designs
This is a investment objectives template 2 ppt powerpoint presentation designs. This is a five stage process. The stages in this process are asset management, risk management, tax reduction, management team, set your goals.

Market Budget Ppt PowerPoint Presentation Infographics
This is a market budget ppt powerpoint presentation infographics. This is a five stage process. The stages in this process are marketing objectives, target marketing, business opportunities, competition, product and services.

Strategic Business Plan Consulting Diagram Powerpoint Shapes
This is a strategic business plan consulting diagram powerpoint shapes. This is a five stage process. The stages in this process are vision, foundation, management plan, useful format, constant testing.

Research Customer Segments Ppt Slides
This is a research customer segments ppt slides. This is a four stage process. The stages in this process are research customer segments, keyword search, content strategy, optimize and promote.
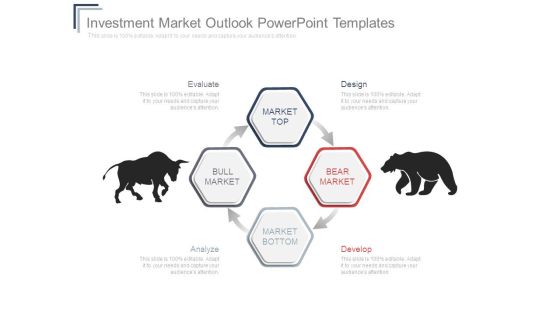
Investment Market Outlook Powerpoint Templates
This is a investment market outlook powerpoint templates. This is a four stage process. The stages in this process are market top, bull market, bear market, market bottom, evaluate, design, develop, analyze.

5 Vs Large Data Sets Applications Circular Icons Ppt PowerPoint Presentation Picture
This is a 5 vs large data sets applications circular icons ppt powerpoint presentation picture. This is a five stage process. The stages in this process are big data, volume, velocity, variety, veracity, value.

4 Points Survey Venn Circular Diagram Ppt PowerPoint Presentation Visuals
This is a 4 points survey venn circular diagram ppt powerpoint presentation visuals. This is a four stage process. The stages in this process are circular diagrams, venn diagram, survey diagram.
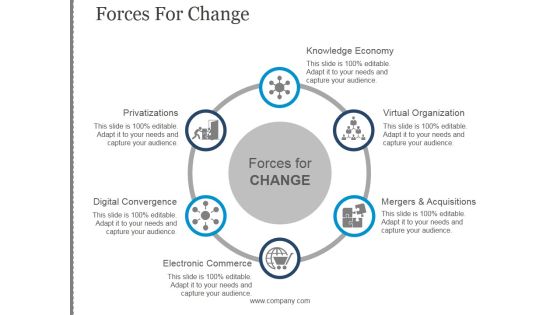
Forces For Change Template 1 Ppt PowerPoint Presentation Slides
This is a forces for change template 1 ppt powerpoint presentation slides. This is a six stage process. The stages in this process are privatizations, digital convergence, electronic commerce , knowledge economy, virtual organization, mergers and acquisitions.

Business Infographic With Four Options Powerpoint Templates
This PowerPoint template has been designed with business infographic of four options. This diagram displays steps for process management. Use this PPT slide to make impressive presentations
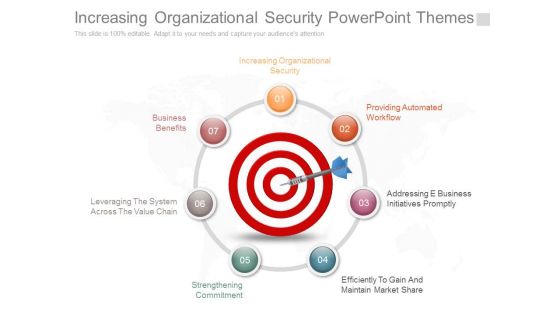
Increasing Organizational Security Powerpoint Themes
This is a increasing organizational security powerpoint themes. This is a seven stage process. The stages in this process are increasing organizational security, business benefits, leveraging the system across the value chain, strengthening commitment, providing automated workflow, addressing e business initiatives promptly, efficiently to gain and maintain market share.

Objective Of Big Data Ppt PowerPoint Presentation Example
This is a objective of big data ppt powerpoint presentation example. This is a five stage process. The stages in this process are be more responsive to the market, analyzing customer behavior, combining multiple, data sources, improving customer service, generate additional revenue.

Affiliate Web Marketing Techniques Diagram Powerpoint Graphics
This is a affiliate web marketing techniques diagram powerpoint graphics. This is a four stage process. The stages in this process are affiliate gets a commission you get a sale, affiliate puts your ad on their website, customer clicks and converts, conversions are tracked.

PowerPoint Template Circle Puzzle Diagram Ppt Designs
PowerPoint Template Circle Puzzle Diagram PPT Designs-It is all there in bits and pieces. Individual components well researched and understood in their place.Use this template to illustrate your method, piece by piece, and interlock the whole process in the minds of your audience.-PowerPoint Template Circle Puzzle Diagram PPT Designs-Cycle, Design, Diagram, Element, Graph, Business, Chart, Circular, Connect, Connection, Puzzle, Round, Solving, Step, Together, Putting, Mystery, Linking, Infographic, Icon,

PowerPoint Template Circle Puzzle Diagram Ppt Themes
PowerPoint Template Circle Puzzle Diagram PPT Themes-It is all there in bits and pieces. Individual components well researched and understood in their place.Use this template to illustrate your method, piece by piece, and interlock the whole process in the minds of your audience.-PowerPoint Template Circle Puzzle Diagram PPT Themes-Cycle, Design, Diagram, Element, Graph, Business, Chart, Circular, Connect, Connection, Puzzle, Round, Solving, Step, Together, Putting, Mystery, Linking, Infographic, Icon,

PowerPoint Template Circle Puzzle Business Ppt Backgrounds
PowerPoint Template Circle Puzzle Business PPT Backgrounds-It is all there in bits and pieces. Individual components well researched and understood in their place.Use this template to illustrate your method, piece by piece, and interlock the whole process in the minds of your audience.-PowerPoint Template Circle Puzzle Business PPT Backgrounds-Cycle, Design, Diagram, Element, Graph, Business, Chart, Circular, Connect, Connection, Puzzle, Round, Solving, Step, Together, Putting, Mystery, Linking, Infographic, Icon,

PowerPoint Template Circle Puzzle Download Ppt Presentation
PowerPoint Template Circle Puzzle Download PPT Presentation-It is all there in bits and pieces. Individual components well researched and understood in their place.Use this template to illustrate your method, piece by piece, and interlock the whole process in the minds of your audience.-PowerPoint Template Circle Puzzle Download PPT Presentation-Cycle, Design, Diagram, Element, Graph, Business, Chart, Circular, Connect, Connection, Puzzle, Round, Solving, Step, Together, Putting, Mystery, Linking, Infographic, Icon,

PowerPoint Template Circle Puzzle Leadership Ppt Backgrounds
PowerPoint Template Circle Puzzle Leadership PPT Backgrounds-It is all there in bits and pieces. Individual components well researched and understood in their place.Use this template to illustrate your method, piece by piece, and interlock the whole process in the minds of your audience.-PowerPoint Template Circle Puzzle Leadership PPT Backgrounds-Cycle, Design, Diagram, Element, Graph, Business, Chart, Circular, Connect, Connection, Puzzle, Round, Solving, Step, Together, Putting, Mystery, Linking, Infographic, Icon,
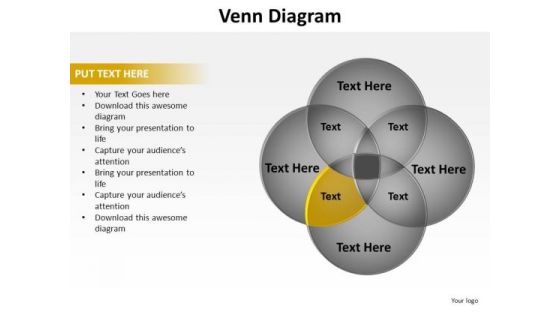
PowerPoint Backgrounds Leadership Venn Diagram Ppt Slide
PowerPoint Backgrounds Leadership Venn Diagram PPT Slide Business Power Points-The Venn graphic comprising interlinking circles geometrically demonstrate how various functions operating independently, to a large extent, are essentially interdependent. Amplify on this basic corporate concept and forefront the benefits of overlapping processes to arrive at common goals.-These amazing PowerPoint pre-designed slides and PowerPoint templates have been carefully created by our team of experts to help you impress your audience. Our stunning collection of Powerpoint slides are 100% editable and can easily fit in any PowerPoint presentations. By using these animations and graphics in PowerPoint and you can easily make professional presentations. Any text can be entered at any point in the PowerPoint template or slide. Just DOWNLOAD our awesome PowerPoint templates and you are ready to go.

PowerPoint Design Strategy Venn Diagram Ppt Design
PowerPoint Design Strategy Venn Diagram PPT Design Business Power Points-The Venn graphic comprising interlinking circles geometrically demonstrate how various functions operating independently, to a large extent, are essentially interdependent. Amplify on this basic corporate concept and forefront the benefits of overlapping processes to arrive at common goals.-These amazing PowerPoint pre-designed slides and PowerPoint templates have been carefully created by our team of experts to help you impress your audience. Our stunning collection of Powerpoint slides are 100% editable and can easily fit in any PowerPoint presentations. By using these animations and graphics in PowerPoint and you can easily make professional presentations. Any text can be entered at any point in the PowerPoint template or slide. Just DOWNLOAD our awesome PowerPoint templates and you are ready to go.

PowerPoint Layout Graphic Venn Diagram Ppt Template
PowerPoint Layout Graphic Venn Diagram PPT Template Business Power Points-The Venn graphic comprising interlinking circles geometrically demonstrate how various functions operating independently, to a large extent, are essentially interdependent. Amplify on this basic corporate concept and forefront the benefits of overlapping processes to arrive at common goals.-These amazing PowerPoint pre-designed slides and PowerPoint templates have been carefully created by our team of experts to help you impress your audience. Our stunning collection of Powerpoint slides are 100% editable and can easily fit in any PowerPoint presentations. By using these animations and graphics in PowerPoint and you can easily make professional presentations. Any text can be entered at any point in the PowerPoint template or slide. Just DOWNLOAD our awesome PowerPoint templates and you are ready to go.
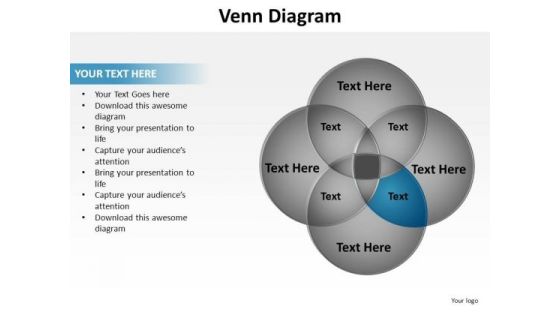
PowerPoint Layout Image Venn Diagram Ppt Designs
PowerPoint Layout Image Venn Diagram PPT Designs Business Power Points-The Venn graphic comprising interlinking circles geometrically demonstrate how various functions operating independently, to a large extent, are essentially interdependent. Amplify on this basic corporate concept and forefront the benefits of overlapping processes to arrive at common goals.-These amazing PowerPoint pre-designed slides and PowerPoint templates have been carefully created by our team of experts to help you impress your audience. Our stunning collection of Powerpoint slides are 100% editable and can easily fit in any PowerPoint presentations. By using these animations and graphics in PowerPoint and you can easily make professional presentations. Any text can be entered at any point in the PowerPoint template or slide. Just DOWNLOAD our awesome PowerPoint templates and you are ready to go.
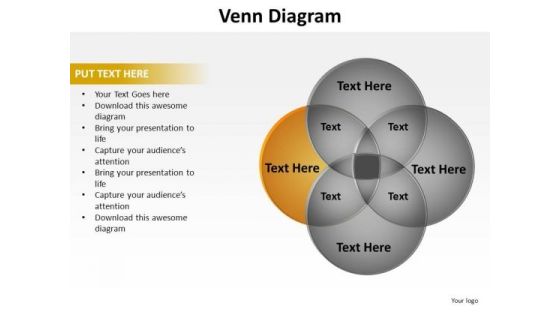
PowerPoint Presentation Global Venn Diagram Ppt Design
PowerPoint Presentation Global Venn Diagram PPT Design Business Power Points-The Venn graphic comprising interlinking circles geometrically demonstrate how various functions operating independently, to a large extent, are essentially interdependent. Amplify on this basic corporate concept and forefront the benefits of overlapping processes to arrive at common goals.-These amazing PowerPoint pre-designed slides and PowerPoint templates have been carefully created by our team of experts to help you impress your audience. Our stunning collection of Powerpoint slides are 100% editable and can easily fit in any PowerPoint presentations. By using these animations and graphics in PowerPoint and you can easily make professional presentations. Any text can be entered at any point in the PowerPoint template or slide. Just DOWNLOAD our awesome PowerPoint templates and you are ready to go.

 Home
Home