AI PPT Maker
Templates
PPT Bundles
Design Services
Business PPTs
Business Plan
Management
Strategy
Introduction PPT
Roadmap
Self Introduction
Timelines
Process
Marketing
Agenda
Technology
Medical
Startup Business Plan
Cyber Security
Dashboards
SWOT
Proposals
Education
Pitch Deck
Digital Marketing
KPIs
Project Management
Product Management
Artificial Intelligence
Target Market
Communication
Supply Chain
Google Slides
Research Services
 One Pagers
All Categories
-
Home
- Customer Favorites
- Organizational Chart
Organizational Chart

Employee Survey Results For Flexible Work Advantages Ppt Infographic Template Guidelines PDF
This slide shows the percentage wise results of survey conducted for employees regarding the advantages of flexible working culture. It includes main categories of adjustable work schedule, no travelling, family time and other advantages such as work life balance and focusing on physical health etc. Pitch your topic with ease and precision using this Employee Survey Results For Flexible Work Advantages Ppt Infographic Template Guidelines PDF. This layout presents information on Key Insights, Family Time, Adjustable Work Schedule, No Travelling. It is also available for immediate download and adjustment. So, changes can be made in the color, design, graphics or any other component to create a unique layout.

Data Dashboard For Multi Websites Performance Comparison Themes PDF
This slide showcases website statistics dashboard that can help to do the comparative assessment of visitors and traffic performance of multiple websites. Its key components are website overview, traffic sources and conversions. Showcasing this set of slides titled Data Dashboard For Multi Websites Performance Comparison Themes PDF. The topics addressed in these templates are Data Dashboard For Multi Websites Performance Comparison. All the content presented in this PPT design is completely editable. Download it and make adjustments in color, background, font etc. as per your unique business setting.

Operations Administrator Experience Based Salary Structure Structure PDF
This slide showcases comparative assessment of operations executive salary range by different experience level. It includes key components such as annual salary range, and years of experience. Pitch your topic with ease and precision using this Operations Administrator Experience Based Salary Structure Structure PDF. This layout presents information on Budget Management, Strategic Planning, Management, Operations Executive, Responsibilities. It is also available for immediate download and adjustment. So, changes can be made in the color, design, graphics or any other component to create a unique layout.

Investment Annual Performance Report Pictures PDF
This slide highlights a statistical data showing performance of investment funds for developing financial growth plan. It includes key components such as global equities, aggressive, growth, balanced, moderate, conservative and cash. Pitch your topic with ease and precision using this Investment Annual Performance Report Pictures PDF. This layout presents information on Low Interest Rates, Wage Subsidies, Returns Due Market Drop. It is also available for immediate download and adjustment. So, changes can be made in the color, design, graphics or any other component to create a unique layout.
Tracking Expenditure Incurred On Cloud Deployment Dashboard Download PDF
The following slide highlights cloud implementation expenditure dashboard to determine overspend, unused resources, plan future costs, available discounts, customization options etc. It includes components such as cloud native, software, departments, cost centre etc. Pitch your topic with ease and precision using this Tracking Expenditure Incurred On Cloud Deployment Dashboard Download PDF. This layout presents information on Dashboard, Tracking, Deployment. It is also available for immediate download and adjustment. So, changes can be made in the color, design, graphics or any other component to create a unique layout.

Capacity Allotment Management For Program Backlog Management Graphics PDF
This slide illustrates capacity allocation which can be helpful for agile teams for reducing program backlogs. It contains information about team context, stakeholders, team backlog, user stories, refactors, maintenance, next program increment, etc. Pitch your topic with ease and precision using this Capacity Allotment Management For Program Backlog Management Graphics PDF. This layout presents information on Increment Commitment Planning, Designs, Technological. It is also available for immediate download and adjustment. So, changes can be made in the color, design, graphics or any other component to create a unique layout.

Client Experience Report With Net Promoter Score Ppt PowerPoint Presentation Infographic Template Smartart PDF
Pitch your topic with ease and precision using this client experience report with net promoter score ppt powerpoint presentation infographic template smartart pdf. This layout presents information on very satisfied, somewhat satisfied, neutral, somewhat dissatisfied, very dissatisfied. It is also available for immediate download and adjustment. So, changes can be made in the color, design, graphics or any other component to create a unique layout.

Common Safety Issues At Workplace Ppt PowerPoint Presentation Infographic Template Format Ideas PDF
Pitch your topic with ease and precision using this common safety issues at workplace ppt powerpoint presentation infographic template format ideas pdf. This layout presents information on instruction incident, getting caught or crushed, physical risks were more commonly reported than psychosocial risks. It is also available for immediate download and adjustment. So, changes can be made in the color, design, graphics or any other component to create a unique layout.

Company Income Bridge With Sales And Marketing Ppt PowerPoint Presentation Gallery Templates PDF
This slide showcase company revenue bridge with sales and marketing which includes gross revenue, gross income, operating income and taxes. Pitch your topic with ease and precision using this Company Income Bridge With Sales And Marketing Ppt PowerPoint Presentation Gallery Templates PDF. This layout presents information on Gross Revenue, Net Revenue, Rev Adjustments. It is also available for immediate download and adjustment. So, changes can be made in the color, design, graphics or any other component to create a unique layout.
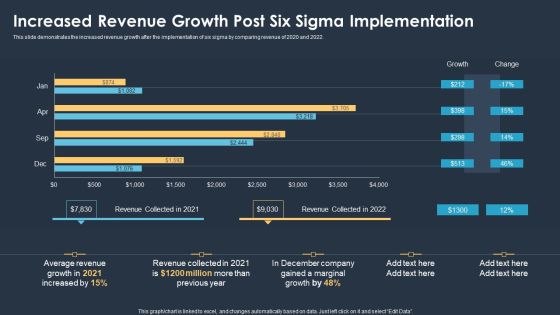
Six Sigma Methodologies For Process Optimization Increased Revenue Growth Post Six Sigma Implementation Template PDF
This slide demonstrates the increased revenue growth after the implementation of six sigma by comparing revenue of 2020 and 2022. Pitch your topic with ease and precision using this Six Sigma Methodologies For Process Optimization Increased Revenue Growth Post Six Sigma Implementation Template PDF. This layout presents information on Average Revenue Growth, Marginal Growth. It is also available for immediate download and adjustment. So, changes can be made in the color, design, graphics or any other component to create a unique layout.

Corporate Training Program Dashboard To Track Employee Performance Portrait PDF
This slide showcases dashboard that can help organization to track on job training program. Its key components are absenteeism rate, overtime hours, training duration and cost and overall labor effectiveness rate. Crafting an eye catching presentation has never been more straightforward. Let your presentation shine with this tasteful yet straightforward Corporate Training Program Dashboard To Track Employee Performance Portrait PDF template. It offers a minimalistic and classy look that is great for making a statement. The colors have been employed intelligently to add a bit of playfulness while still remaining professional. Construct the ideal Corporate Training Program Dashboard To Track Employee Performance Portrait PDF that effortlessly grabs the attention of your audience. Begin now and be certain to wow your customers.
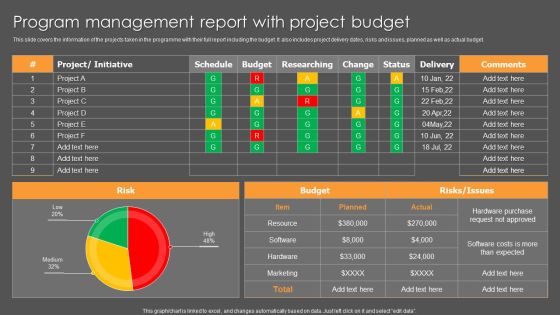
Program Management Report With Project Budget Ppt Model Designs PDF
This slide covers the information of the projects taken in the programme with their full report including the budget. It also includes project delivery dates, risks and issues, planned as well as actual budget. Pitch your topic with ease and precision using this Program Management Report With Project Budget Ppt Model Designs PDF. This layout presents information on Project, Initiative, Risk, Budget. It is also available for immediate download and adjustment. So, changes can be made in the color, design, graphics or any other component to create a unique layout.
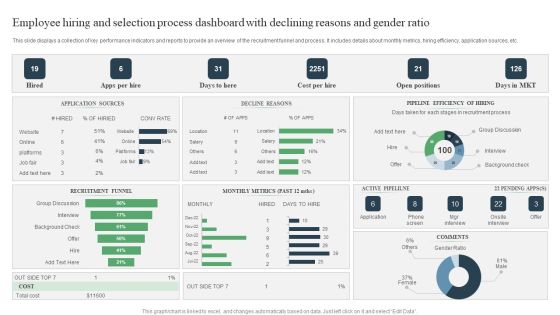
Employee Hiring And Selection Process Dashboard With Declining Reasons And Gender Ratio Ppt PowerPoint Presentation Infographic Template Rules PDF
Pitch your topic with ease and precision using this Employee Hiring And Selection Process Dashboard With Declining Reasons And Gender Ratio Ppt PowerPoint Presentation Infographic Template Rules PDF. This layout presents information on Group Discussion, Active Pipelilne, Onsite Interview. It is also available for immediate download and adjustment. So, changes can be made in the color, design, graphics or any other component to create a unique layout.

Digital Marketing Toolkit Marketing And Business Management Transformation Reasons For Failure Template PDF
This slide covers the reasons for failure on marketing due to which business can be in great loss such as poor marketing techniques, ignoring customers, no marketing plan, running out of cash for digital paid marketing and many more. Crafting an eye-catching presentation has never been more straightforward. Let your presentation shine with this tasteful yet straightforward Digital Marketing Toolkit Marketing And Business Management Transformation Reasons For Failure Template PDF template. It offers a minimalistic and classy look that is great for making a statement. The colors have been employed intelligently to add a bit of playfulness while still remaining professional. Construct the ideal Digital Marketing Toolkit Marketing And Business Management Transformation Reasons For Failure Template PDF that effortlessly grabs the attention of your audience Begin now and be certain to wow your customers

KPI Dashboard For ESO System Ppt PowerPoint Presentation File Template PDF
This slide covers kpi dashboard for enterprise security operations. It involves details such as active alerts, active automated investigation, devices with major issues and report of daily devices. Pitch your topic with ease and precision using this KPI Dashboard For ESO System Ppt PowerPoint Presentation File Template PDF. This layout presents information on Security Health, Misconfigured, Service Operating Normally. It is also available for immediate download and adjustment. So, changes can be made in the color, design, graphics or any other component to create a unique layout.
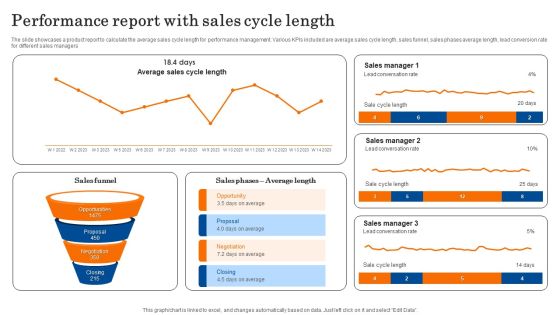
Performance Report With Sales Cycle Length Template PDF
The slide showcases a product report to calculate the average sales cycle length for performance management. Various KPIs included are average sales cycle length, sales funnel, sales phases average length, lead conversion rate for different sales managers. sPitch your topic with ease and precision using this Performance Report With Sales Cycle Length Template PDF. This layout presents information on Sales Manager, Conversation Rate, Opportunity. It is also available for immediate download and adjustment. So, changes can be made in the color, design, graphics or any other component to create a unique layout.
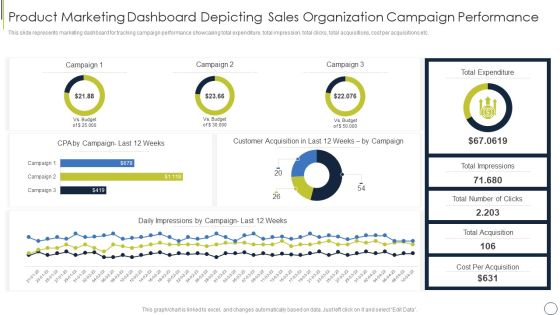
Product Marketing Dashboard Depicting Sales Organization Campaign Performance Themes PDF
This slide represents marketing dashboard for tracking campaign performance showcasing total expenditure, total impression, total clicks, total acquisitions, cost per acquisitions etc. Pitch your topic with ease and precision using this product marketing dashboard depicting sales organization campaign performance themes pdf. This layout presents information on product marketing dashboard depicting sales organization campaign performance. It is also available for immediate download and adjustment. So, changes can be made in the color, design, graphics or any other component to create a unique layout.
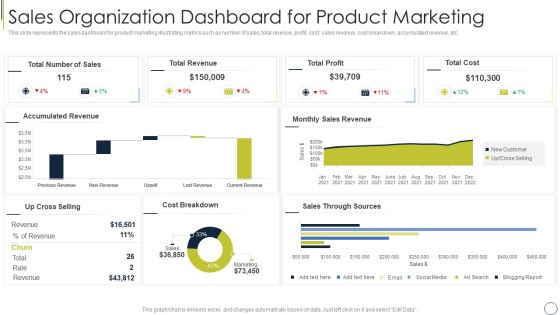
Sales Organization Dashboard For Product Marketing Themes PDF
This slide represents the sales dashboard for product marketing illustrating metrics such as number of sales, total revenue, profit, cost, sales revenue, cost breakdown, accumulated revenue, etc. Pitch your topic with ease and precision using this sales organization dashboard for product marketing themes pdf. This layout presents information on total cost, total profit, total revenue. It is also available for immediate download and adjustment. So, changes can be made in the color, design, graphics or any other component to create a unique layout.
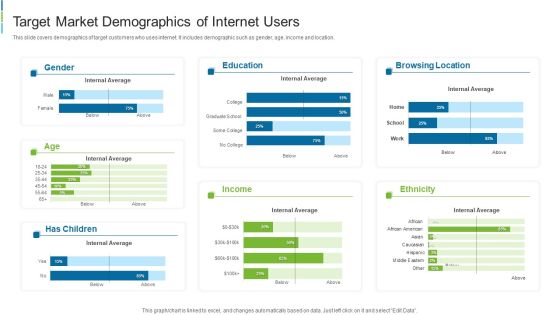
Target Market Demographics Of Internet Users Themes PDF
This slide covers demographics of target customers who uses internet. It includes demographic such as gender, age, income and location. Pitch your topic with ease and precision using this target market demographics of internet users themes pdf This layout presents information on target market demographics of internet users It is also available for immediate download and adjustment. So, changes can be made in the color, design, graphics or any other component to create a unique layout.

Employee Key Performance Indicators With Scores Themes PDF
The following slide highlights the staff key performance Indicators with scores illustrating key headings which includes staff performance , average scores and team result areas Pitch your topic with ease and precision using this Employee Key Performance Indicators With Scores Themes PDF This layout presents information on Staff Performance, Average Scores, Team Result It is also available for immediate download and adjustment. So, changes can be made in the color, design, graphics or any other component to create a unique layout.
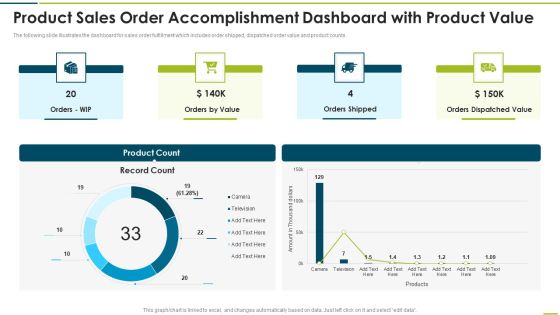
Product Sales Order Accomplishment Dashboard With Product Value Themes PDF
The following slide illustrates the dashboard for sales order fulfillment which includes order shipped, dispatched order value and product counts.Pitch your topic with ease and precision using this Product Sales Order Accomplishment Dashboard With Product Value Themes PDF This layout presents information on Orders Shipped, Dispatched Value, Orders Value It is also available for immediate download and adjustment. So, changes can be made in the color, design, graphics or any other component to create a unique layout.

Customer Acquisition Method In Brand Campaign Advertisement Themes PDF
This slide showcase the methods used by companies for product promotion in campaign. It includes influencer marketing, organic search and paid search. Pitch your topic with ease and precision using this Customer Acquisition Method In Brand Campaign Advertisement Themes PDF. This layout presents information on Product Promotion, Marketing, Organic Research. It is also available for immediate download and adjustment. So, changes can be made in the color, design, graphics or any other component to create a unique layout.

Artificial Intelligence Capabilities And Applications In Retail Sector Themes PDF
This slide illustrates statistics related to AI application in retail industry. It includes AI types like machine learning, chatbots, natural language processing and swarm intelligence etc. Pitch your topic with ease and precision using this Artificial Intelligence Capabilities And Applications In Retail Sector Themes PDF. This layout presents information on Capabilities And Applications, Retail Sector. It is also available for immediate download and adjustment. So, changes can be made in the color, design, graphics or any other component to create a unique layout.

Annual Sales Comparison Of Corporate Products Themes PDF
This slide covers the comparison of annual business sales. It shows that the sales of product A has been increased by 7 percent due to product improvement. Pitch your topic with ease and precision using this Annual Sales Comparison Of Corporate Products Themes PDF. This layout presents information on Annual Sales, Comparison Of Corporate Products. It is also available for immediate download and adjustment. So, changes can be made in the color, design, graphics or any other component to create a unique layout.

Return On Investment From Email Marketing Campaign Themes PDF
This slide shows return on per dollar marketing investment spend. It includes email, catalogs, search engine optimization, mobile, etc. Pitch your topic with ease and precision using this Return On Investment From Email Marketing Campaign Themes PDF. This layout presents information on Email Marketing, Email Roi, Reducing Email Bounce Rate. It is also available for immediate download and adjustment. So, changes can be made in the color, design, graphics or any other component to create a unique layout.

Market Potential Report For Business Feasibility Pictures PDF
This slide showcases dashboard that help organization to identify the market viability and potential before launch of final product. Its key components are market growth estimation, market by geography, market with product segment and opportunities available Pitch your topic with ease and precision using this market potential report for business feasibility pictures pdf This layout presents information on geographical location, opportunities in market, growth estimation It is also available for immediate download and adjustment. So, changes can be made in the color, design, graphics or any other component to create a unique layout.
OEM Spare Parts Sales Tracking Dashboard Ppt PowerPoint Presentation Gallery Inspiration PDF
This slide showcases dashboard that can help organization to keep track of aftermarket components sales. Its key elements are sold quantity per spare part and deviation of sold units. Pitch your topic with ease and precision using this oem spare parts sales tracking dashboard ppt powerpoint presentation gallery inspiration pdf. This layout presents information on sold quantity, budgeted quantity, quantity ytd ly. It is also available for immediate download and adjustment. So, changes can be made in the color, design, graphics or any other component to create a unique layout.
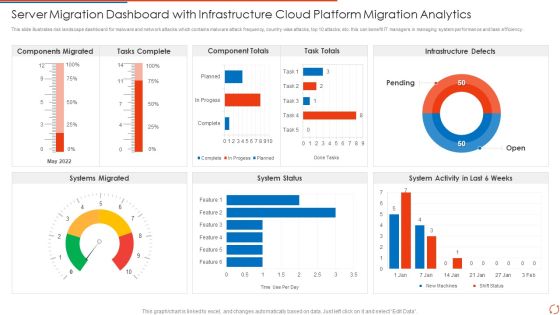
Server Migration Dashboard With Infrastructure Cloud Platform Migration Analytics Elements PDF Portrait PDF
This slide illustrates risk landscape dashboard for malware and network attacks which contains malware attack frequency, country wise attacks, top 10 attacks, etc. this can benefit IT managers in managing system performance and task efficiency Pitch your topic with ease and precision using this Server Migration Dashboard With Infrastructure Cloud Platform Migration Analytics Elements PDF Portrait PDF. This layout presents information on Tasks Complete, Component Totals, Task Totals. It is also available for immediate download and adjustment. So, changes can be made in the color, design, graphics or any other component to create a unique layout.

Smartphone App Installation Metrics Dashboard With User Sessions Microsoft PDF
This slide showcases dashboard that can help organization to identify the installation trend of mobile application and formulate strategies in case of declining downloads. Its key components are installs trend, total installs, total sessions and total media source breakdown by revenue. Pitch your topic with ease and precision using this Smartphone App Installation Metrics Dashboard With User Sessions Microsoft PDF. This layout presents information on Smartphone App Installation Metrics Dashboard With User Sessions. It is also available for immediate download and adjustment. So, changes can be made in the color, design, graphics or any other component to create a unique layout.

Financial Performance Introduction Of Supply Chain Management Organization Infographics PDF
This slide showcases introduction to statistics that can help supply chain management organization to evaluate the financial performance. Its key components are revenue, net income and revenue sources.Pitch your topic with ease and precision using this Financial Performance Introduction Of Supply Chain Management Organization Infographics PDF This layout presents information on Revenue Sources, Revenue Increased, Income Increased It is also available for immediate download and adjustment. So, changes can be made in the color, design, graphics or any other component to create a unique layout.
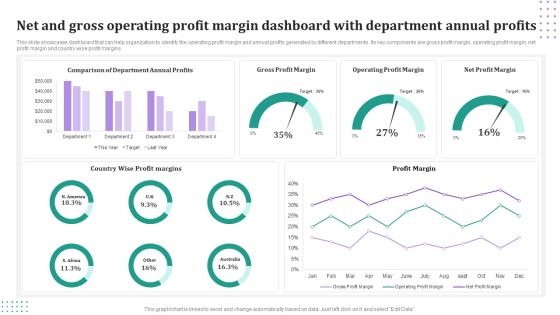
Net And Gross Operating Profit Margin Dashboard With Department Annual Profits Mockup PDF
This slide showcases dashboard that can help organization to identify the operating profit margin and annual profits generated by different departments. Its key components are gross profit margin, operating profit margin, net profit margin and country wise profit margins. Pitch your topic with ease and precision using this Net And Gross Operating Profit Margin Dashboard With Department Annual Profits Mockup PDF. This layout presents information on Gross Profit Margin, Operating Profit Margin, Net Profit Margin. It is also available for immediate download and adjustment. So, changes can be made in the color, design, graphics or any other component to create a unique layout.
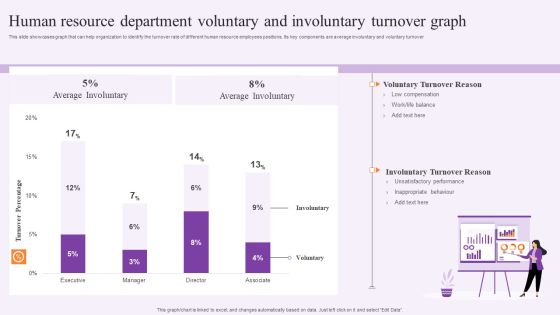
Human Resource Department Voluntary And Involuntary Turnover Graph Summary PDF
This slide showcases graph that can help organization to identify the turnover rate of different human resource employees positions. Its key components are average involuntary and voluntary turnover. Pitch your topic with ease and precision using this Human Resource Department Voluntary And Involuntary Turnover Graph Summary PDF. This layout presents information on Executive, Voluntary Turnover Reason, Average Involuntary. It is also available for immediate download and adjustment. So, changes can be made in the color, design, graphics or any other component to create a unique layout.
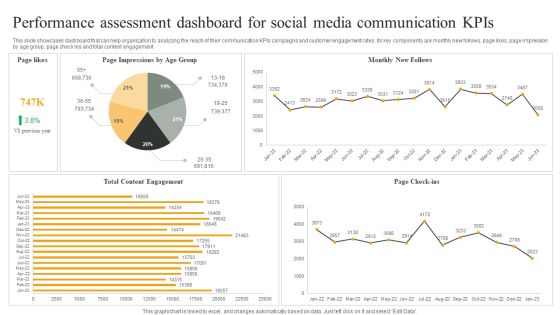
Performance Assessment Dashboard For Social Media Communication Kpis Graphics PDF
This slide showcases dashboard that can help organization to analyzing the reach of their communication KPIs campaigns and customer engagement rates. Its key components are monthly new follows, page likes, page impression by age group, page check ins and total content engagement. Pitch your topic with ease and precision using this Performance Assessment Dashboard For Social Media Communication Kpis Graphics PDF. This layout presents information on Monthly New Follows, Page Check ins, Total Content Engagement. It is also available for immediate download and adjustment. So, changes can be made in the color, design, graphics or any other component to create a unique layout.
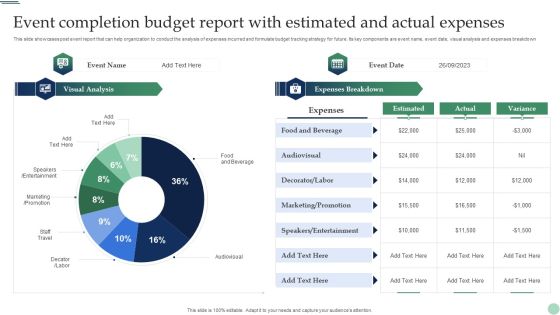
Event Completion Budget Report With Estimated And Actual Expenses Pictures PDF
This slide showcases post event report that can help organization to conduct the analysis of expenses incurred and formulate budget tracking strategy for future. Its key components are event name, event date, visual analysis and expenses breakdown. Pitch your topic with ease and precision using this Event Completion Budget Report With Estimated And Actual Expenses Pictures PDF. This layout presents information on Food And Beverage, Audiovisual, Marketing, Entertainment. It is also available for immediate download and adjustment. So, changes can be made in the color, design, graphics or any other component to create a unique layout.
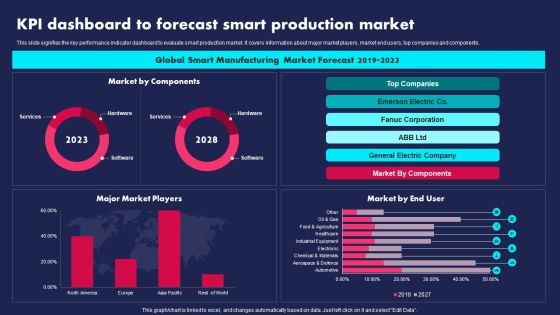
KPI Dashboard To Forecast Smart Production Market Ppt PowerPoint Presentation Gallery Visual Aids PDF
This slide signifies the key performance indicator dashboard to evaluate smart production market. It covers information about major market players, market end users, top companies and components. Pitch your topic with ease and precision using this KPI Dashboard To Forecast Smart Production Market Ppt PowerPoint Presentation Gallery Visual Aids PDF. This layout presents information on Global Smart Manufacturing, Market Forecast, 2019 To 2023. It is also available for immediate download and adjustment. So, changes can be made in the color, design, graphics or any other component to create a unique layout.
Implementation Challenges For Tracking And Assessment Framework Slides PDF
The slide displays statistical report for potential failures in effective implementation of monitoring and evaluation framework. It includes key components such as insufficient funds, employee resistance, poor communication, etc. Pitch your topic with ease and precision using this Implementation Challenges For Tracking And Assessment Framework Slides PDF. This layout presents information on Budget Allocated, Monitoring, Framework. It is also available for immediate download and adjustment. So, changes can be made in the color, design, graphics or any other component to create a unique layout.
Report On Cost Of High Restaurant Attrition Tracking With Key Insights Topics PDF
This slide depicts breakdown of cost incurred due to restaurant employees turnover. It includes components such as productivity loss, recruitment costs, selection costs, pre-departure costs, orientation and training costs, along with turnover rates, cost per churned employee, total annual cost. Pitch your topic with ease and precision using this Report On Cost Of High Restaurant Attrition Tracking With Key Insights Topics PDF. This layout presents information on Average Turnover Cost, Employee, Productivity. It is also available for immediate download and adjustment. So, changes can be made in the color, design, graphics or any other component to create a unique layout.

Cash Management Dashboard With Sales Outstanding And Liquidity Ratio Analysis Information PDF
This showcases dashboard that can help organization in cash management and track KPIs to evaluate the financial performance of company. It key components are liquidity ratios, cash balance. days sales outstanding, days inventory outstanding and days payable outstanding. Pitch your topic with ease and precision using this Cash Management Dashboard With Sales Outstanding And Liquidity Ratio Analysis Information PDF. This layout presents information on Cash Conversion, Working Capital, Cash Balance. It is also available for immediate download and adjustment. So, changes can be made in the color, design, graphics or any other component to create a unique layout.
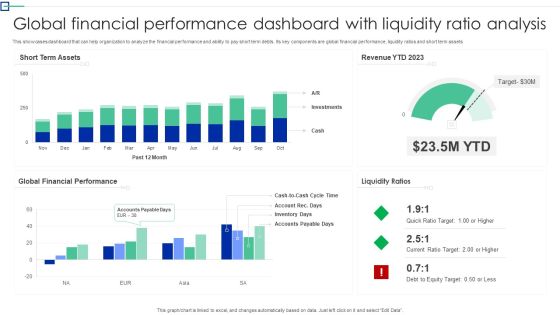
Global Financial Performance Dashboard With Liquidity Ratio Analysis Information PDF
This showcases dashboard that can help organization to analyze the financial performance and ability to pay short term debts. Its key components are global financial performance, liquidity ratios and short term assets. Pitch your topic with ease and precision using this Global Financial Performance Dashboard With Liquidity Ratio Analysis Information PDF. This layout presents information on Short Term Assets, Global Financial Performance, Liquidity Ratios. It is also available for immediate download and adjustment. So, changes can be made in the color, design, graphics or any other component to create a unique layout.

Budget Analysis Dashboard With Actual And Forecasted Revenue Comparison Structure PDF
This slide displays the budget analysis report comparing the budget with the actual year to date data. It also helps in making estimations for the remaining year. It includes variance between budgeted and actual gross margin results, service revenue, profit margin, product revenue, payroll cost, etc. Pitch your topic with ease and precision using this Budget Analysis Dashboard With Actual And Forecasted Revenue Comparison Structure PDF. This layout presents information on Payroll Cost, Budget Revenue Components, Product Revenue. It is also available for immediate download and adjustment. So, changes can be made in the color, design, graphics or any other component to create a unique layout.
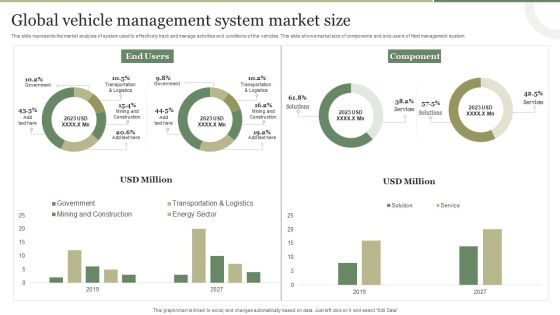
Global Vehicle Management System Market Size Guidelines PDF
This slide represents the market analysis of system used to effectively track and manage activities and conditions of the vehicles. This slide shows market size of components and end-users of fleet management system. Pitch your topic with ease and precision using this Global Vehicle Management System Market Size Guidelines PDF. This layout presents information on Global Vehicle, Management System, Market Size. It is also available for immediate download and adjustment. So, changes can be made in the color, design, graphics or any other component to create a unique layout.
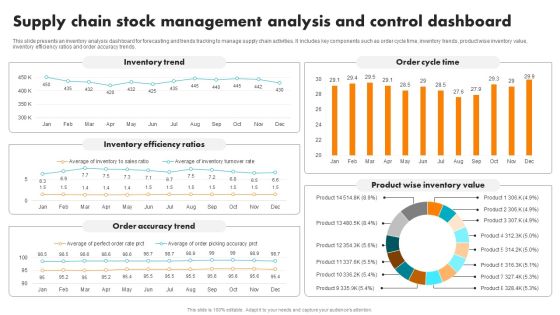
Supply Chain Stock Management Analysis And Control Dashboard Brochure PDF
This slide presents an inventory analysis dashboard for forecasting and trends tracking to manage supply chain activities. It includes key components such as order cycle time, inventory trends, product wise inventory value, inventory efficiency ratios and order accuracy trends. Pitch your topic with ease and precision using this Supply Chain Stock Management Analysis And Control Dashboard Brochure PDF. This layout presents information on Inventory Trend, Inventory Efficiency Ratios, Order Accuracy Trend, Order Cycle Time, Product Wise Inventory Value. It is also available for immediate download and adjustment. So, changes can be made in the color, design, graphics or any other component to create a unique layout.
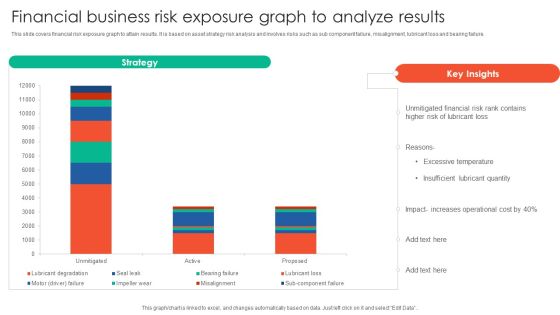
Financial Business Risk Exposure Graph To Analyze Results Elements PDF
This slide covers financial risk exposure graph to attain results. It is based on asset strategy risk analysis and involves risks such as sub component failure, misalignment, lubricant loss and bearing failure. Pitch your topic with ease and precision using this Financial Business Risk Exposure Graph To Analyze Results Elements PDF. This layout presents information on Strategy, Unmitigated Financial, Risk Rank Contains. It is also available for immediate download and adjustment. So, changes can be made in the color, design, graphics or any other component to create a unique layout.
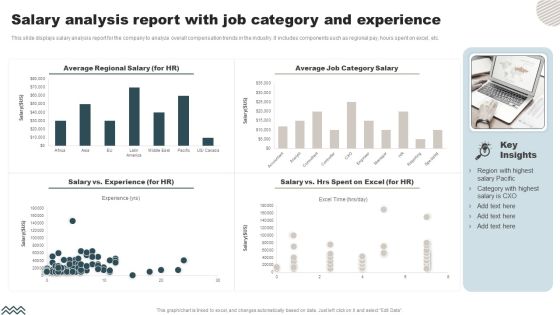
Salary Analysis Report With Job Category And Experience Microsoft PDF
This slide displays salary analysis report for the company to analyze overall compensation trends in the industry. It includes components such as regional pay, hours spent on excel, etc. Pitch your topic with ease and precision using this Salary Analysis Report With Job Category And Experience Microsoft PDF. This layout presents information on Average Regional Salary, Average Job Category Salary . It is also available for immediate download and adjustment. So, changes can be made in the color, design, graphics or any other component to create a unique layout.
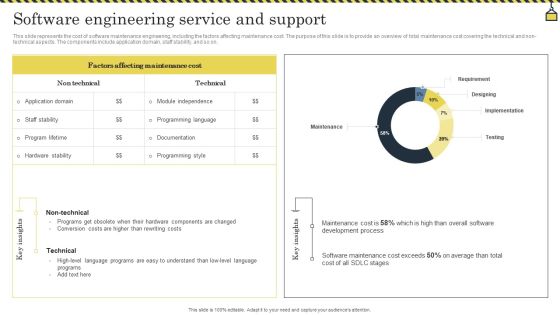
Software Engineering Service And Support Information PDF
This slide represents the cost of software maintenance engineering, including the factors affecting maintenance cost. The purpose of this slide is to provide an overview of total maintenance cost covering the technical and non technical aspects. The components include application domain, staff stability, and so on. Pitch your topic with ease and precision using this Software Engineering Service And Support Information PDF. This layout presents information on Rewriting Costs, Conversion Costs, Development Process. It is also available for immediate download and adjustment. So, changes can be made in the color, design, graphics or any other component to create a unique layout.

Strategic Organization Evaluation With Quarterly Performance Analysis Ppt Model Portfolio PDF
This slide highlights business growth and targets achieved by company in first quarter to review progress strategically. It includes components such as recruitment, expansion, corporate social responsibility and budget vs performance. Pitch your topic with ease and precision using this Strategic Organization Evaluation With Quarterly Performance Analysis Ppt Model Portfolio PDF. This layout presents information on Recruitment, Expansion Middle East, Corporate Social Responsibilities, Budget Vs Performance. It is also available for immediate download and adjustment. So, changes can be made in the color, design, graphics or any other component to create a unique layout.

Sales Monitoring Dashboard With Monthly Qualified Leads Guidelines PDF
This slide showcases dashboard that can help organization to monitor the sales pipeline velocity and predict future sales more accurately plus increase the leads converted. Its key components are monthly qualified leads, win rate based on deal size, monthly sales cycle and number of leads at each stage of pipeline. Pitch your topic with ease and precision using this Sales Monitoring Dashboard With Monthly Qualified Leads Guidelines PDF. This layout presents information on Monthly Qualified, Monthly Sales Cycle, Deal Size. It is also available for immediate download and adjustment. So, changes can be made in the color, design, graphics or any other component to create a unique layout.
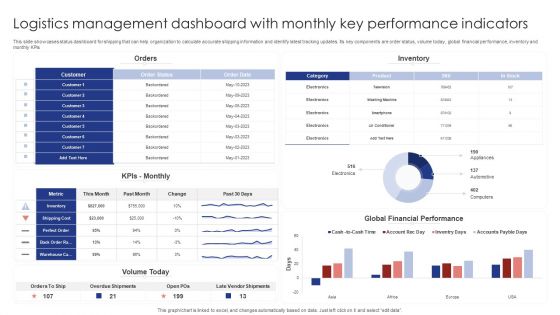
Logistics Management Dashboard With Monthly Key Performance Indicators Rules PDF
This slide showcases status dashboard for shipping that can help organization to calculate accurate shipping information and identify latest tracking updates. Its key components are order status, volume today, global financial performance, inventory and monthly KPIs. Pitch your topic with ease and precision using this Logistics Management Dashboard With Monthly Key Performance Indicators Rules PDF. This layout presents information on Orders, Inventory, Kpis Monthly. It is also available for immediate download and adjustment. So, changes can be made in the color, design, graphics or any other component to create a unique layout.
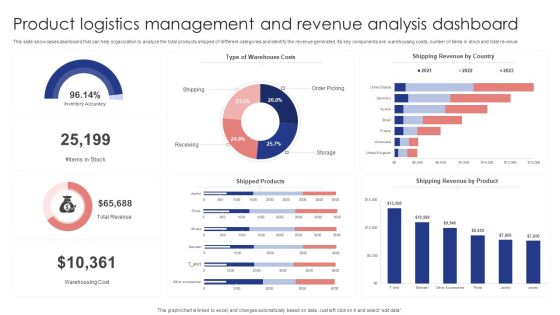
Product Logistics Management And Revenue Analysis Dashboard Demonstration PDF
This slide showcases dashboard that can help organization to analyze the total products shipped of different categories and identify the revenue generated. Its key components are warehousing costs, number of items in stock and total revenue. Pitch your topic with ease and precision using this Product Logistics Management And Revenue Analysis Dashboard Demonstration PDF. This layout presents information on Warehouse Costs, Shipping Revenue Country, Shipped Products . It is also available for immediate download and adjustment. So, changes can be made in the color, design, graphics or any other component to create a unique layout.

Company Payout Dashboard For Effective Finance Management Introduction PDF
The slide carries a dashboard to manage day-to-day payments and measure the savings. Various components included are due bills, amount paid for energy consumption, common transactions, preferred modes of payment, etc. Pitch your topic with ease and precision using this Company Payout Dashboard For Effective Finance Management Introduction PDF. This layout presents information on Electricity, Oil And Fuel, Gas Cylinder. It is also available for immediate download and adjustment. So, changes can be made in the color, design, graphics or any other component to create a unique layout.

Sales Employee Representative Performance Scorecard Dashboard For Healthcare Industry Clipart PDF
This slide showcases sales performance of healthcare products which can be used by managers to evaluate business achievements. It includes key components such as monthly sales comparison, sales performance of products by different channels, sales team performance. Pitch your topic with ease and precision using this Sales Employee Representative Performance Scorecard Dashboard For Healthcare Industry Clipart PDF. This layout presents information on Monthly Sales Comparison, Revenue By Previous Year, Sales Performance, Different Products, Different Channels, Sales Team Performance . It is also available for immediate download and adjustment. So, changes can be made in the color, design, graphics or any other component to create a unique layout.

Big Data Analytics Analysts Salary Range Structure PDF
This slide showcases big data managers salary range by different experience level for improve business decision making. It includes key components such as analyst experience level, minimum salary range and maximum salary range. Pitch your topic with ease and precision using this Big Data Analytics Analysts Salary Range Structure PDF. This layout presents information on Analyst Manager, Data Management, Management Skills. It is also available for immediate download and adjustment. So, changes can be made in the color, design, graphics or any other component to create a unique layout.

Industry Specific Dynamic Costing Model Demonstration PDF
This slide highlights a dynamic pricing model showing various pricing methods used by different industries. It includes key components such as industry, dynamic pricing examples, perishable inventory, price, seasonality, differentiated willingness to pay, fixed capacity, etc. Pitch your topic with ease and precision using this Industry Specific Dynamic Costing Model Demonstration PDF. This layout presents information on Dynamic Pricing, E Commerce, Target. It is also available for immediate download and adjustment. So, changes can be made in the color, design, graphics or any other component to create a unique layout.
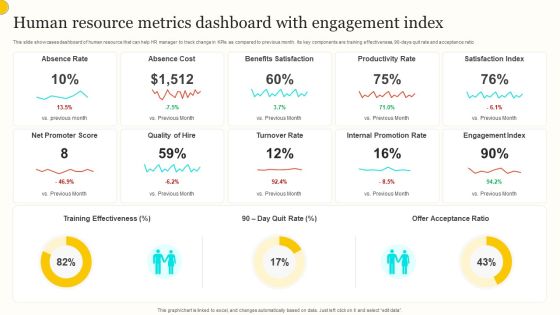
Human Resource Metrics Dashboard With Engagement Index Guidelines PDF
This slide showcases dashboard of human resource that can help HR manager to track change in KPIs as compared to previous month. Its key components are training effectiveness, 90 days quit rate and acceptance ratio. Pitch your topic with ease and precision using this Human Resource Metrics Dashboard With Engagement Index Guidelines PDF. This layout presents information on Absence Rate, Absence Cost, Benefits Satisfaction. It is also available for immediate download and adjustment. So, changes can be made in the color, design, graphics or any other component to create a unique layout.

Survey Work Life Balance Startup Summary Report Survey SS
Following slides demonstrates summarized report on employee work life balance conducted by HR managers to determine employee work life balance issues. It includes components such as year of employment, average working hours, current job satisfaction, work life balance. Pitch your topic with ease and precision using this Survey Work Life Balance Startup Summary Report Survey SS. This layout presents information on Years Of Employment, Average Working Hours, Destress, Overtime . It is also available for immediate download and adjustment. So, changes can be made in the color, design, graphics or any other component to create a unique layout.

Shareholder Capital Structure For Food Company Inspiration PDF
The slide carries a shareholder structure to understand the food companys share capital and voting rights. Various components included are percentage of share capital and percentage of voting rights owned by each shareholder of the company. Pitch your topic with ease and precision using this Shareholder Capital Structure For Food Company Inspiration PDF. This layout presents information on Shareholder Capital Structure, Food Company. It is also available for immediate download and adjustment. So, changes can be made in the color, design, graphics or any other component to create a unique layout.
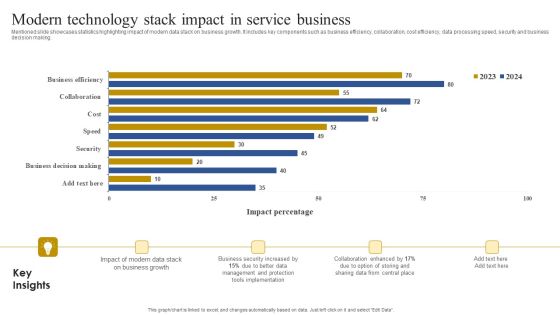
Modern Technology Stack Impact In Service Business Clipart PDF
Mentioned slide showcases statistics highlighting impact of modern data stack on business growth. It includes key components such as business efficiency, collaboration, cost efficiency, data processing speed, security and business decision making. Pitch your topic with ease and precision using this Modern Technology Stack Impact In Service Business Clipart PDF. This layout presents information on Business Security, Implementation, Management And Protection. It is also available for immediate download and adjustment. So, changes can be made in the color, design, graphics or any other component to create a unique layout.

Forecasted RPA Impact On Telecommunications Business Professional PDF
Mentioned slide showcases impact of robotic process automation of different industries productivity and growth. It includes key components such as forecasted productivity and predicted businesses revenue growth. Pitch your topic with ease and precision using this Forecasted RPA Impact On Telecommunications Business Professional PDF. This layout presents information on Forecasted Productivity, Predicted Revenue Growth, Telecom Business. It is also available for immediate download and adjustment. So, changes can be made in the color, design, graphics or any other component to create a unique layout.

Startup Market Research Survey Questionnaire Summary Result Report Survey SS
Following slide demonstrates startup survey results which can be used by sales representatives to build brand reputation. It includes components such as customer information and customer product preference. Pitch your topic with ease and precision using this Startup Market Research Survey Questionnaire Summary Result Report Survey SS. This layout presents information on Target Audience, Customer Product Preference, Income Range, Purchase High-Quality Products. It is also available for immediate download and adjustment. So, changes can be made in the color, design, graphics or any other component to create a unique layout.
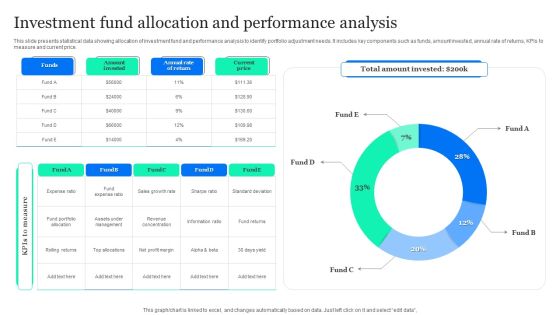
Investment Fund Allocation And Performance Analysis Designs PDF
This slide presents statistical data showing allocation of investment fund and performance analysis to identify portfolio adjustment needs. It includes key components such as funds, amount invested, annual rate of returns, KPIs to measure and current price. Pitch your topic with ease and precision using this Investment Fund Allocation And Performance Analysis Designs PDF. This layout presents information on Amount Invested, Annual Rate Return, Current Price. It is also available for immediate download and adjustment. So, changes can be made in the color, design, graphics or any other component to create a unique layout.
