Organizational Change

Competitor Products Analysis With Price Level Mapping For Fashion Industry Mockup PDF
This slide displays price mapping and competitive analysis for the company to track overall market scenario. It includes details about average price increase, decrease and no change. Pitch your topic with ease and precision using this Competitor Products Analysis With Price Level Mapping For Fashion Industry Mockup PDF. This layout presents information on Company, Increase, Decrease. It is also available for immediate download and adjustment. So, changes can be made in the color, design, graphics or any other component to create a unique layout.

Share Market Dashboard Highlighting Price Moving Average Trend Themes PDF
Following slide outlines stock market dashboard of an industry. The various metrics highlighted in the slide are stock codes, previous day price of stock, percent of price change, maximum and lowest price of stock, moving average trend etc. Pitch your topic with ease and precision using this Share Market Dashboard Highlighting Price Moving Average Trend Themes PDF. This layout presents information on Moving Average, Stock Price, Performing Stocks. It is also available for immediate download and adjustment. So, changes can be made in the color, design, graphics or any other component to create a unique layout.

Share Market Dashboard Indicating Candlestick Time Series Formats PDF
Following slide showcase stock market KPI dashboard which will assist company to understand stock performance. It provides information about open, close, highest and lowest price of stock on particular day, candlestick time series etc. Pitch your topic with ease and precision using this Share Market Dashboard Indicating Candlestick Time Series Formats PDF. This layout presents information on Candlestick Time Series, Stock Change, US Sector. It is also available for immediate download and adjustment. So, changes can be made in the color, design, graphics or any other component to create a unique layout.
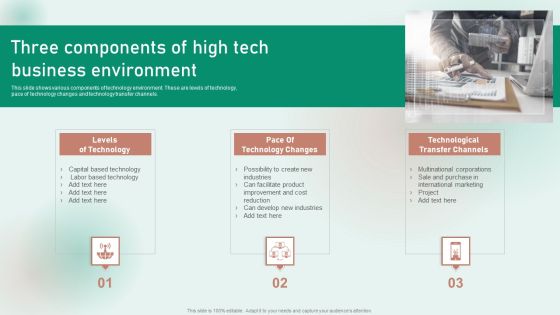
Three Components Of High Tech Business Environment Download PDF
This slide shows various components of technology environment. These are levels of technology, pace of technology changes and technology transfer channels. Presenting Three Components Of High Tech Business Environment Download PDF to dispense important information. This template comprises three stages. It also presents valuable insights into the topics including Pace Of Technology Changes, Technological Transfer Channels, Levels Of Technology. This is a completely customizable PowerPoint theme that can be put to use immediately. So, download it and address the topic impactfully.

Scrm Framework With Key Drivers Ppt PowerPoint Presentation Model Deck PDF
Pitch your topic with ease and precision using this scrm framework with key drivers ppt powerpoint presentation model deck pdf. This layout presents information on analyse past activities, analyse current situation, emergence of new markets, changes in competitive environment, risk identification. It is also available for immediate download and adjustment. So, changes can be made in the colour, design, graphics or any other component to create a unique layout.

Hiring Agency Profile With Financial Charts Ppt Model Example PDF
This graph or chart is linked to excel, and changes automatically based on data. Just left click on it and select edit data. Pitch your topic with ease and precision using this hiring agency profile with financial charts ppt model example pdf. This layout presents information on revenue, operating income, operating margin, satisfaction rate. It is also available for immediate download and adjustment. So, changes can be made in the color, design, graphics or any other component to create a unique layout.

Comparison Analysis For Social Media Marketing Effectiveness Template PDF
This slide represents a comparative assessment for social media effectiveness covering elements such as awareness, engagement, behavior, social norms, and customer well-being.Pitch your topic with ease and precision using this Comparison Analysis For Social Media Marketing Effectiveness Template PDF This layout presents information on Customer Behavioral, Behavioral Response, Individual Changes It is also available for immediate download and adjustment. So, changes can be made in the color, design, graphics or any other component to create a unique layout.
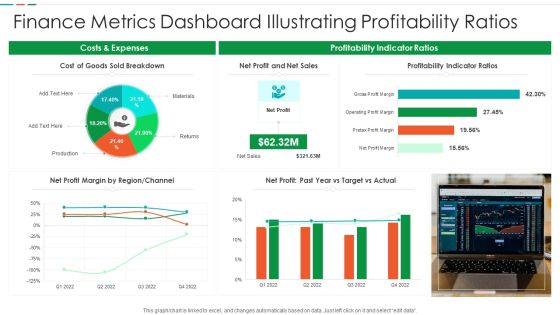
Finance Metrics Dashboard Illustrating Profitability Ratios Diagrams PDF
This graph or chart is linked to excel, and changes automatically based on data. Just left click on it and select edit data. Pitch your topic with ease and precision using this Finance Metrics Dashboard Illustrating Profitability Ratios Diagrams PDF. This layout presents information on Cost Goods Sold, Net Profit Net, Sales Profitability Indicator. It is also available for immediate download and adjustment. So, changes can be made in the color, design, graphics or any other component to create a unique layout.

Finance Metrics Dashboard Indicating Portfolio Performance Microsoft PDF
This graph or chart is linked to excel, and changes automatically based on data. Just left click on it and select edit data. Pitch your topic with ease and precision using this Finance Metrics Dashboard Indicating Portfolio Performance Microsoft PDF. This layout presents information on Portfolio Performance Portfolio, Asset Management Manager, Top 10 Assets. It is also available for immediate download and adjustment. So, changes can be made in the color, design, graphics or any other component to create a unique layout.

Finance Metrics Dashboard Indicating Short Term Assets Download PDF
This graph or chart is linked to excel, and changes automatically based on data. Just left click on it and select edit data. Pitch your topic with ease and precision using this Finance Metrics Dashboard Indicating Short Term Assets Download PDF. This layout presents information on Short Term Assets, Global Financial Performance, Revenue YTD 2022. It is also available for immediate download and adjustment. So, changes can be made in the color, design, graphics or any other component to create a unique layout.
Cash Performance Highlights With Turnover Rate Ppt Ideas Icon PDF
This graph or chart is linked to excel, and changes automatically based on data. Just left click on it and select Edit Data. Pitch your topic with ease and precision using this Cash Performance Highlights With Turnover Rate Ppt Ideas Icon PDF. This layout presents information on Working Capital, Cash Balance, Current Ratio. It is also available for immediate download and adjustment. So, changes can be made in the color, design, graphics or any other component to create a unique layout.

Financial Performance Highlights With Net Profit Margin Ppt Model Ideas PDF
This graph or chart is linked to excel, and changes automatically based on data. Just left click on it and select Edit Data. Pitch your topic with ease and precision using this Financial Performance Highlights With Net Profit Margin Ppt Model Ideas PDF. This layout presents information on Net Profit, Accounts Receivable, Accounts Payable. It is also available for immediate download and adjustment. So, changes can be made in the color, design, graphics or any other component to create a unique layout.

Product Performance Highlights With Key Growth Drivers Ppt Pictures Design Templates PDF
This graph or chart is linked to excel, and changes automatically based on data. Just left click on it and select Edit Data. Pitch your topic with ease and precision using this Product Performance Highlights With Key Growth Drivers Ppt Pictures Design Templates PDF. This layout presents information on Product Performance, Key Growth, Projected Growth. It is also available for immediate download and adjustment. So, changes can be made in the color, design, graphics or any other component to create a unique layout.

Weekly Sales Performance Highlights With Product Share Ppt File Information PDF
This graph or chart is linked to excel, and changes automatically based on data. Just left click on it and select Edit Data. Pitch your topic with ease and precision using this Weekly Sales Performance Highlights With Product Share Ppt File Information PDF. This layout presents information on Dashboard Summary, Weekly Sale, Product Share. It is also available for immediate download and adjustment. So, changes can be made in the color, design, graphics or any other component to create a unique layout.

Client Helpline Dashboard Performance Key Metrics Ppt Outline Deck PDF
This graph or chart is linked to excel, and changes automatically based on data. Just left click on it and select Edit Data. Pitch your topic with ease and precision using this Client Helpline Dashboard Performance Key Metrics Ppt Outline Deck PDF. This layout presents information on Key Metrics, Trend, Compare. It is also available for immediate download and adjustment. So, changes can be made in the color, design, graphics or any other component to create a unique layout.

Client Helpline Dashboard With Product Customer Satisfaction Ppt Slides Graphics Template PDF
This graph or chart is linked to excel, and changes automatically based on data. Just left click on it and select Edit Data. Pitch your topic with ease and precision using this Client Helpline Dashboard With Product Customer Satisfaction Ppt Slides Graphics Template PDF. This layout presents information on Customer Satisfaction, Product, Compare. It is also available for immediate download and adjustment. So, changes can be made in the color, design, graphics or any other component to create a unique layout.

Client Helpline Dashboard With Ticket Resolution Ppt Model Graphics Design PDF
This graph or chart is linked to excel, and changes automatically based on data. Just left click on it and select Edit Data. Pitch your topic with ease and precision using this Client Helpline Dashboard With Ticket Resolution Ppt Model Graphics Design PDF. This layout presents information on Ticket Due Times, Sourcewise Tickets, Open Tickets. It is also available for immediate download and adjustment. So, changes can be made in the color, design, graphics or any other component to create a unique layout.
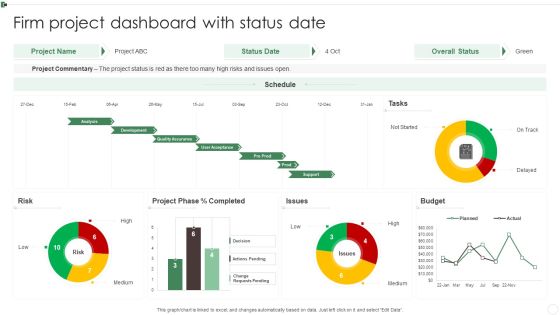
Firm Project Dashboard With Status Date Ppt Infographics Slides PDF
This graph or chart is linked to excel, and changes automatically based on data. Just left click on it and select Edit Data. Pitch your topic with ease and precision using this Firm Project Dashboard With Status Date Ppt Infographics Slides PDF. This layout presents information on Project Commentary, Budget, Project Phase, Risk. It is also available for immediate download and adjustment. So, changes can be made in the color, design, graphics or any other component to create a unique layout.
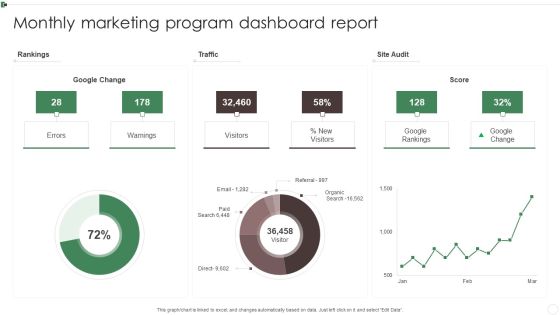
Monthly Marketing Program Dashboard Report Ppt Inspiration Information PDF
This graph or chart is linked to excel, and changes automatically based on data. Just left click on it and select Edit Data. Pitch your topic with ease and precision using this Monthly Marketing Program Dashboard Report Ppt Inspiration Information PDF. This layout presents information on Rankings, Traffic, Site Audit, Warnings. It is also available for immediate download and adjustment. So, changes can be made in the color, design, graphics or any other component to create a unique layout.
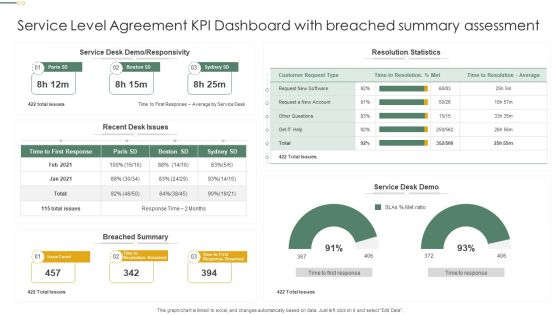
Service Level Agreement KPI Dashboard With Breached Summary Assessment Professional PDF
This graph or chart is linked to excel, and changes automatically based on data. Just left click on it and select Edit Data. Pitch your topic with ease and precision using this Service Level Agreement KPI Dashboard With Breached Summary Assessment Professional PDF. This layout presents information on Resolution Statistics, Service Desk Demo, Breached Summary. It is also available for immediate download and adjustment. So, changes can be made in the color, design, graphics or any other component to create a unique layout.
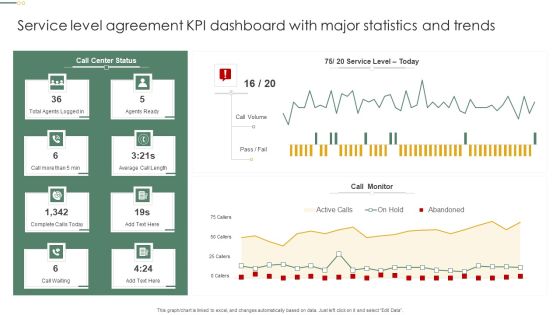
Service Level Agreement KPI Dashboard With Major Statistics And Trends Pictures PDF
This graph or chart is linked to excel, and changes automatically based on data. Just left click on it and select Edit Data. Pitch your topic with ease and precision using this Service Level Agreement KPI Dashboard With Major Statistics And Trends Pictures PDF. This layout presents information on Call Monitor, Call Volume, Agents Ready. It is also available for immediate download and adjustment. So, changes can be made in the color, design, graphics or any other component to create a unique layout.
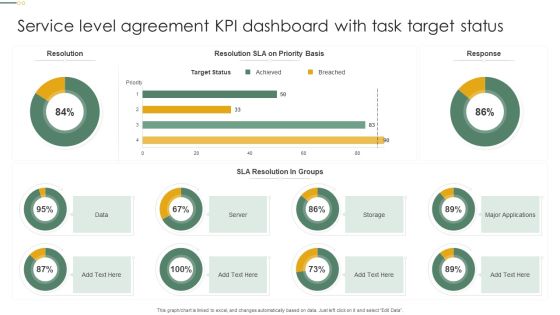
Service Level Agreement KPI Dashboard With Task Target Status Microsoft PDF
This graph or chart is linked to excel, and changes automatically based on data. Just left click on it and select Edit Data. Pitch your topic with ease and precision using this Service Level Agreement KPI Dashboard With Task Target Status Microsoft PDF. This layout presents information on Target Status, Sla Resolution, Groups, Server. It is also available for immediate download and adjustment. So, changes can be made in the color, design, graphics or any other component to create a unique layout.

Chart Illustrating Manufacturing Plant Energy Consumption Statistics Slides PDF
This graph or chart is linked to excel, and changes automatically based on data. Just left click on it and select edit data. Pitch your topic with ease and precision using this Chart Illustrating Manufacturing Plant Energy Consumption Statistics Slides PDF. This layout presents information on Equipment Inefficiency, Process Heating, Energy Export. It is also available for immediate download and adjustment. So, changes can be made in the color, design, graphics or any other component to create a unique layout.
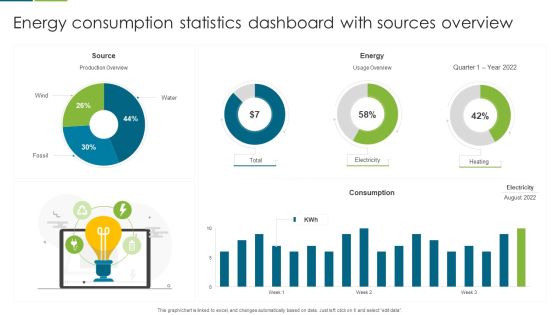
Energy Consumption Statistics Dashboard With Sources Overview Template PDF
This graph or chart is linked to excel, and changes automatically based on data. Just left click on it and select edit data. Pitch your topic with ease and precision using this Energy Consumption Statistics Dashboard With Sources Overview Template PDF. This layout presents information on Source, Energy, Consumption. It is also available for immediate download and adjustment. So, changes can be made in the color, design, graphics or any other component to create a unique layout.
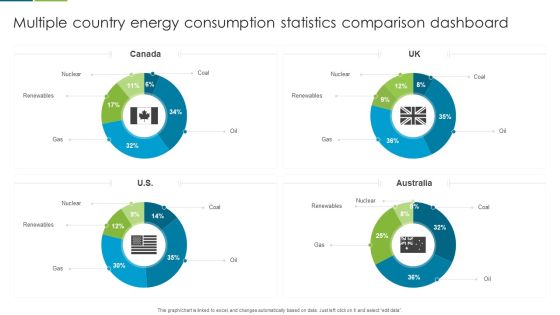
Multiple Country Energy Consumption Statistics Comparison Dashboard Formats PDF
This graph or chart is linked to excel, and changes automatically based on data. Just left click on it and select edit data. Pitch your topic with ease and precision using this Multiple Country Energy Consumption Statistics Comparison Dashboard Formats PDF. This layout presents information on Nuclear, Renewables, Gas. It is also available for immediate download and adjustment. So, changes can be made in the color, design, graphics or any other component to create a unique layout.

Company Group Members Demographics Dashboard Overview Clipart PDF
This graph or chart is linked to excel, and changes automatically based on data. Just left click on it and select Edit Data. Pitch your topic with ease and precision using this Company Group Members Demographics Dashboard Overview Clipart PDF. This layout presents information on Headcount Office, Headcount Tenure Range, Headcount Age Range. It is also available for immediate download and adjustment. So, changes can be made in the color, design, graphics or any other component to create a unique layout.
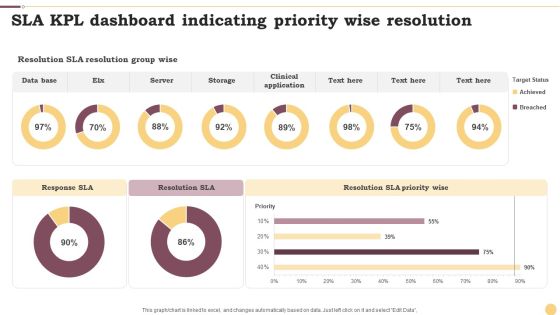
SLA KPL Dashboard Indicating Priority Wise Resolution Ppt Infographics Example File PDF
This graph or chart is linked to excel, and changes automatically based on data. Just left click on it and select Edit Data. Pitch your topic with ease and precision using this SLA KPL Dashboard Indicating Priority Wise Resolution Ppt Infographics Example File PDF. This layout presents information on Data Base, Server, Storage. It is also available for immediate download and adjustment. So, changes can be made in the color, design, graphics or any other component to create a unique layout.

SLA KPL Overview Dashboard Depicting Service Targets Ppt Slides Maker PDF
This graph or chart is linked to excel, and changes automatically based on data. Just left click on it and select Edit Data. Pitch your topic with ease and precision using this SLA KPL Overview Dashboard Depicting Service Targets Ppt Slides Maker PDF. This layout presents information on Monthly Trend, Service Target, Quarterly Trend. It is also available for immediate download and adjustment. So, changes can be made in the color, design, graphics or any other component to create a unique layout.

Doughnut Graph Depicting ROI From Multiple Marketing Activities Rules PDF
This graph or chart is linked to excel, and changes automatically based on data. Just left click on it and select Edit Data. Pitch your topic with ease and precision using this Doughnut Graph Depicting ROI From Multiple Marketing Activities Rules PDF. This layout presents information on Total ROI, Field Campaigns, Print Media, Display Ads. It is also available for immediate download and adjustment. So, changes can be made in the color, design, graphics or any other component to create a unique layout.

Doughnut Graph With Online Employee Recruitment Via Multiple Portals Mockup PDF
This graph or chart is linked to excel, and changes automatically based on data. Just left click on it and select Edit Data. Pitch your topic with ease and precision using this Doughnut Graph With Online Employee Recruitment Via Multiple Portals Mockup PDF. This layout presents information on ABC Employment, Multiple Portals, 2020 To 2022. It is also available for immediate download and adjustment. So, changes can be made in the color, design, graphics or any other component to create a unique layout.
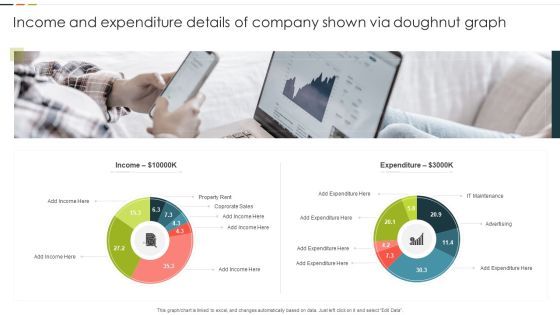
Income And Expenditure Details Of Company Shown Via Doughnut Graph Graphics PDF
This graph or chart is linked to excel, and changes automatically based on data. Just left click on it and select Edit Data. Pitch your topic with ease and precision using this Income And Expenditure Details Of Company Shown Via Doughnut Graph Graphics PDF. This layout presents information on Property Rent, Corporate Sales, Expenditure. It is also available for immediate download and adjustment. So, changes can be made in the color, design, graphics or any other component to create a unique layout.

Kanban Structure For Product Quality Assurance Ppt Portfolio Deck PDF
This graph or chart is linked to excel, and changes automatically based on data. Just left click on it and select Edit Data. Pitch your topic with ease and precision using this Kanban Structure For Product Quality Assurance Ppt Portfolio Deck PDF. This layout presents information on Product Deployment, Quality Assurance, Product, Designing And Development. It is also available for immediate download and adjustment. So, changes can be made in the color, design, graphics or any other component to create a unique layout.
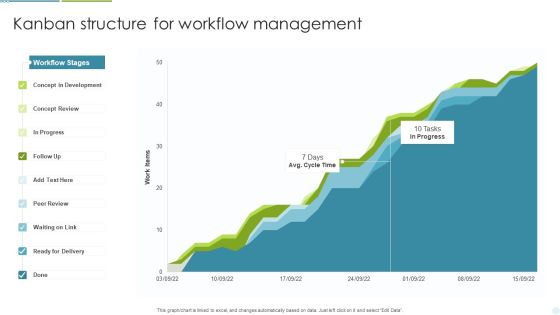
Kanban Structure For Workflow Management Ppt Inspiration Template PDF
This graph or chart is linked to excel, and changes automatically based on data. Just left click on it and select Edit Data. Pitch your topic with ease and precision using this Kanban Structure For Workflow Management Ppt Inspiration Template PDF. This layout presents information on Concept Development, Concept Review, Ready For Delivery. It is also available for immediate download and adjustment. So, changes can be made in the color, design, graphics or any other component to create a unique layout.

Kanban Structure To Manage Weekly Work Activities Ppt Professional Aids PDF
This graph or chart is linked to excel, and changes automatically based on data. Just left click on it and select Edit Data. Pitch your topic with ease and precision using this Kanban Structure To Manage Weekly Work Activities Ppt Professional Aids PDF. This layout presents information on Legend, Ready To Start, In Progress. It is also available for immediate download and adjustment. So, changes can be made in the color, design, graphics or any other component to create a unique layout.

Brand Promotional Program And Campaign Strategy Mockup PDF
This slide defines the brand marketing plan and campaign strategy. It includes information related to strategy, themes, financial benefits , customer experience and technology changes. Pitch your topic with ease and precision using this Brand Promotional Program And Campaign Strategy Mockup PDF. This layout presents information on Strategy, Financial Benefits, Customer Experience. It is also available for immediate download and adjustment. So, changes can be made in the color, design, graphics or any other component to create a unique layout.

Human Capital Metrics For New Hire Ppt Pictures Brochure PDF
This graph or chart is linked to excel, and changes automatically based on data. Just left click on it and select Edit Data. Pitch your topic with ease and precision using this Human Capital Metrics For New Hire Ppt Pictures Brochure PDF. This layout presents information on Active Employee Count, New Hire Count, New Hire. It is also available for immediate download and adjustment. So, changes can be made in the color, design, graphics or any other component to create a unique layout.

Human Capital Metrics With Absenteeism Rate Ppt Infographic Template Ideas PDF
This graph or chart is linked to excel, and changes automatically based on data. Just left click on it and select Edit Data. Pitch your topic with ease and precision using this Human Capital Metrics With Absenteeism Rate Ppt Infographic Template Ideas PDF. This layout presents information on Overall Labor Effectiveness, OLE Department, Absenteeism. It is also available for immediate download and adjustment. So, changes can be made in the color, design, graphics or any other component to create a unique layout.
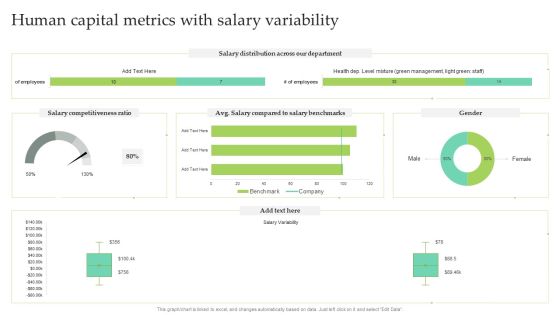
Human Capital Metrics With Salary Variability Ppt Infographic Template Designs PDF
This graph or chart is linked to excel, and changes automatically based on data. Just left click on it and select Edit Data. Pitch your topic with ease and precision using this Human Capital Metrics With Salary Variability Ppt Infographic Template Designs PDF. This layout presents information on Salary Distribution, Salary Competitiveness Ratio, Male. It is also available for immediate download and adjustment. So, changes can be made in the color, design, graphics or any other component to create a unique layout.
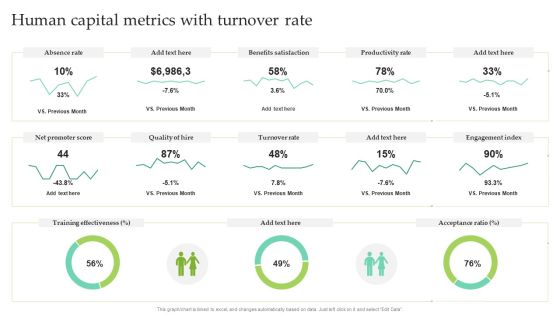
Human Capital Metrics With Turnover Rate Ppt Pictures Outline PDF
This graph or chart is linked to excel, and changes automatically based on data. Just left click on it and select Edit Data. Pitch your topic with ease and precision using this Human Capital Metrics With Turnover Rate Ppt Pictures Outline PDF. This layout presents information on Absence Rate, Benefits Satisfaction, Productivity Rate. It is also available for immediate download and adjustment. So, changes can be made in the color, design, graphics or any other component to create a unique layout.

Various Project Budget Forecast Of IT Company Ppt Styles Ideas PDF
This slide represents the cost estimation table of various IT projects. It shows details like project name, budget, forecast, variance and status of portfolio changes. Pitch your topic with ease and precision using this Various Project Budget Forecast Of IT Company Ppt Styles Ideas PDF. This layout presents information on Budget, Forecast, Variance, Project. It is also available for immediate download and adjustment. So, changes can be made in the color, design, graphics or any other component to create a unique layout.
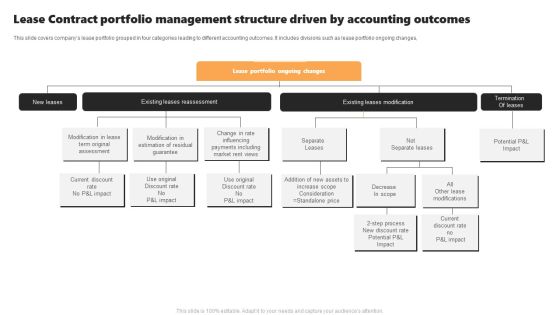
Lease Contract Portfolio Management Structure Driven By Accounting Outcomes Introduction PDF
This slide covers companys lease portfolio grouped in four categories leading to different accounting outcomes. It includes divisions such as lease portfolio ongoing changes, Pitch your topic with ease and precision using this Lease Contract Portfolio Management Structure Driven By Accounting Outcomes Introduction PDF. This layout presents information on Market Rent, Difference, Lease Rent. It is also available for immediate download and adjustment. So, changes can be made in the color, design, graphics or any other component to create a unique layout.

Scrum Task Project Management Dashboard Information PDF
The following slide demonstrates scrum project task management dashboard. It includes information about sprint velocity, scope changes, tasks category, tasks progress, planned, finished, added, removed, bug, story, etc. Pitch your topic with ease and precision using this Scrum Task Project Management Dashboard Information PDF. This layout presents information on Scrum Task Project, Management Dashboard. It is also available for immediate download and adjustment. So, changes can be made in the color, design, graphics or any other component to create a unique layout.

Work Stress Causes With Management Efforts And Benefits Download PDF
This slide illustrates work related stressors and preventive management. It includes causes of stress, self help, management efforts, benefits, comments, etc.Pitch your topic with ease and precision using this Work Stress Causes With Management Efforts And Benefits Download PDF. This layout presents information on Changes Organization, Stress Management, Work Environment. It is also available for immediate download and adjustment. So, changes can be made in the color, design, graphics or any other component to create a unique layout.
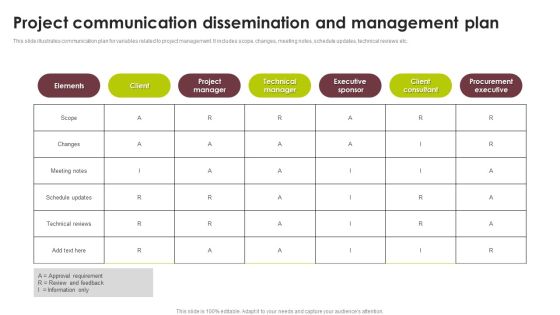
Project Communication Dissemination And Management Plan Template PDF
This slide illustrates communication plan for variables related to project management. It includes scope, changes, meeting notes, schedule updates, technical reviews etc.Pitch your topic with ease and precision using this Project Communication Dissemination And Management Plan Template PDF. This layout presents information on Technical Manager, Executive Sponsor, Client Consultant. It is also available for immediate download and adjustment. So, changes can be made in the color, design, graphics or any other component to create a unique layout.
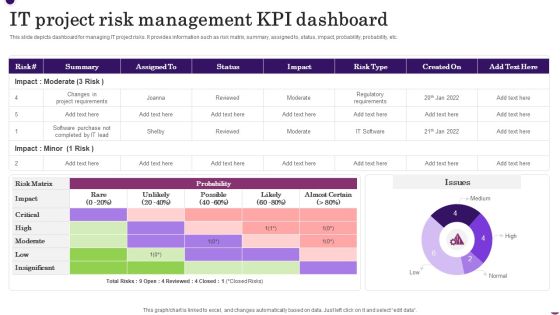
IT Project Risk Management KPI Dashboard Clipart PDF
This slide depicts dashboard for managing IT project risks. It provides information such as risk matrix, summary, assigned to, status, impact, probability, probability, etc. Pitch your topic with ease and precision using this IT Project Risk Management KPI Dashboard Clipart PDF. This layout presents information on Regulatory Requirements, Changes In Project Requirements. It is also available for immediate download and adjustment. So, changes can be made in the color, design, graphics or any other component to create a unique layout.

Prior And Current Warehouse Technology Implementation Inspiration PDF
The slide showcases how communication changed after technology implementation. It compares aspects like processes, handling, real time access , traceability and speed. Pitch your topic with ease and precision using this Prior And Current Warehouse Technology Implementation Inspiration PDF. This layout presents information on Process Automation, Inventory Data, Required. It is also available for immediate download and adjustment. So, changes can be made in the color, design, graphics or any other component to create a unique layout.
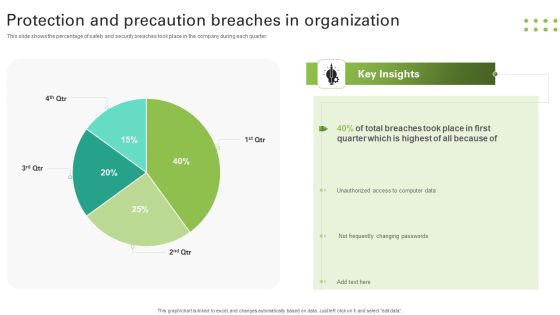
Protection And Precaution Breaches In Organization Slides PDF
This slide shows the percentage of safety and security breaches took place in the company during each quarter. Pitch your topic with ease and precision using this Protection And Precaution Breaches In Organization Slides PDF. This layout presents information on Breaches Took, Quarter, Unauthorized, Changing Passwords. It is also available for immediate download and adjustment. So, changes can be made in the color, design, graphics or any other component to create a unique layout.

Rebranding Techniques Timeline Of Account Based Marketing Firm Slides PDF
Following slide is about the rebranding strategy timeline of account based firm which raised its market share through rebranding, making changes in the product etc. Such strategies help firms to attract more and better customers. Pitch your topic with ease and precision using this Rebranding Techniques Timeline Of Account Based Marketing Firm Slides PDF. This layout presents information on Asset Management, Design, Competitive Analysis. It is also available for immediate download and adjustment. So, changes can be made in the color, design, graphics or any other component to create a unique layout.

Situation When Customers Can Claim Product Replacement Background PDF
This slide covers various causes against which product replacement can be claimed. It includes reasons based on product, consumer, and supplier, such as physical durability, physical resilience, changing tastes, changing needs, service limitations, and component limitations. This Situation When Customers Can Claim Product Replacement Background PDF from Slidegeeks makes it easy to present information on your topic with precision. It provides customization options, so you can make changes to the colors, design, graphics, or any other component to create a unique layout. It is also available for immediate download, so you can begin using it right away. Slidegeeks has done good research to ensure that you have everything you need to make your presentation stand out. Make a name out there for a brilliant performance.

Youtube Advertising Techniques Problems Related To Digital Marketing Download PDF
This slide highlights the problems that company is facing from Facebook and Twitter marketing which includes changing trends, wrong targeting, security risks and expensive Ads. This is a Youtube Advertising Techniques Problems Related To Digital Marketing Download PDF template with various stages. Focus and dispense information on four stages using this creative set, that comes with editable features. It contains large content boxes to add your information on topics like Changing Trends, Wrong Targeting, Security Risks. You can also showcase facts, figures, and other relevant content using this PPT layout. Grab it now.

Business Strategy Consulting Solutions Company Outline Research And Development R And D Expenses Template PDF
This slide shows the research and development expenses incurred by our company in last five years in various areas such as technological change, software implementation, etc. to improve productivity and reduce additional costs. This Business Strategy Consulting Solutions Company Outline Research And Development R And D Expenses Template PDF from Slidegeeks makes it easy to present information on your topic with precision. It provides customization options, so you can make changes to the colors, design, graphics, or any other component to create a unique layout. It is also available for immediate download, so you can begin using it right away. Slidegeeks has done good research to ensure that you have everything you need to make your presentation stand out. Make a name out there for a brilliant performance.

Utilization Of Current Techniques To Improve Efficiency Case Competition Market Size Of ADC Cosmetics Company For Past 5 Years Portrait PDF
This slide shows declining market share of ADC Cosmetics Company. This decline is due to Absence of latest trends in the company, Changes in Customer Preferences, Decline in revenue, Intense Competition etc. Deliver an awe inspiring pitch with this creative utilization of current techniques to improve efficiency case competition market size of adc cosmetics company for past 5 years portrait pdf bundle. Topics like absence of latest trends in the company, changes in customer preferences, decline in revenue can be discussed with this completely editable template. It is available for immediate download depending on the needs and requirements of the user.
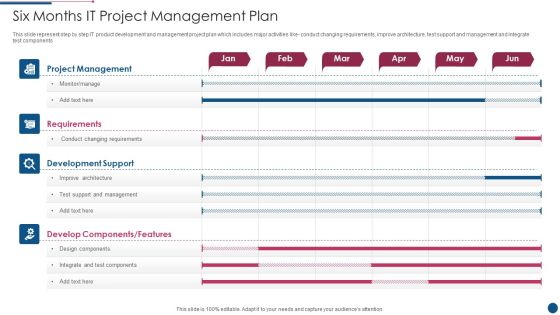
Six Months It Project Management Plan Mockup PDF
This slide represent step by step IT product development and management project plan which includes major activities like conduct changing requirements, improve architecture, test support and management and integrate test components. Pitch your topic with ease and precision using this Six Months It Project Management Plan Mockup PDF. This layout presents information on Development Support, Requirements, Project Management. It is also available for immediate download and adjustment. So, changes can be made in the color, design, graphics or any other component to create a unique layout.

Business Term User Onboarding Procedure For Organization Brochure PDF
This slide depicts the onboarding workflow of a business term in a company, including its working. The purpose of this slide is to represent the business term onboarding process. The workflow components include setting up initial variables and community manager, moving assets to the domain, verifying information, committing changes, and so on. Pitch your topic with ease and precision using this Business Term User Onboarding Procedure For Organization Brochure PDF This layout presents information on Community Manager, Subject Matter Expert, Working. It is also available for immediate download and adjustment. So, changes can be made in the color, design, graphics or any other component to create a unique layout.
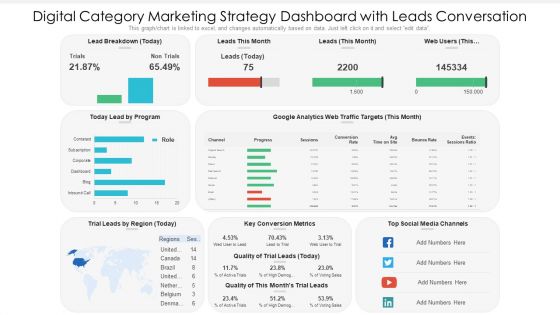
Digital Category Marketing Strategy Dashboard With Leads Conversation Ppt PowerPoint Presentation Slides Information PDF
This graph chart is linked to excel, and changes automatically based on data. Just left click on it and select edit data. Pitch your topic with ease and precision using this digital category marketing strategy dashboard with leads conversation ppt powerpoint presentation slides information pdf. This layout presents information on key conversion metrics, social media channels, lead by program. It is also available for immediate download and adjustment. So, changes can be made in the color, design, graphics or any other component to create a unique layout.
Finance Metrics Dashboard Illustrating Account Payables Icons PDF
This graph or chart is linked to excel, and changes automatically based on data. Just left click on it and select edit data. Pitch your topic with ease and precision using this Total Income Budget, Total Expenses Balance, Net Profit Quick, Ratio Current Ratio. This layout presents information on Account Payable Age, Average Creditor Days, Cash On Hand. It is also available for immediate download and adjustment. So, changes can be made in the color, design, graphics or any other component to create a unique layout.

Finance Metrics Dashboard Illustrating Income And Cash Flow Template PDF
This graph or chart is linked to excel, and changes automatically based on data. Just left click on it and select edit data. Pitch your topic with ease and precision using this Finance Metrics Dashboard Illustrating Income And Cash Flow Template PDF. This layout presents information on Current Accounts Receivable, Current Account Payable, Cash End Period, Account Receivable Account. It is also available for immediate download and adjustment. So, changes can be made in the color, design, graphics or any other component to create a unique layout.
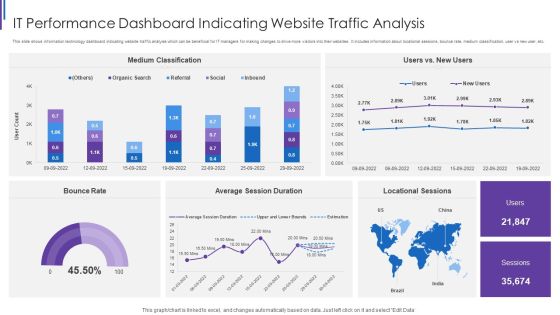
IT Performance Dashboard Indicating Website Traffic Analysis Background PDF
This slide shows information technology dashboard indicating website traffic analysis which can be beneficial for IT managers for making changes to drive more visitors into their websites. It includes information about locational sessions, bounce rate, medium classification, user vs new user, etc. Pitch your topic with ease and precision using this IT Performance Dashboard Indicating Website Traffic Analysis Background PDF. This layout presents information on Medium Classification Rate, Average Session Duration, Locational Sessions Bounce. It is also available for immediate download and adjustment. So, changes can be made in the color, design, graphics or any other component to create a unique layout.
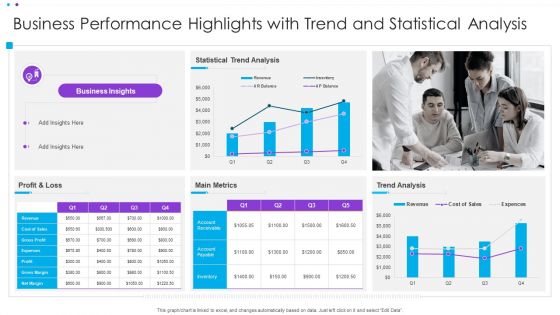
Business Performance Highlights With Trend And Statistical Analysis Ppt Infographic Template Display PDF
This graph or chart is linked to excel, and changes automatically based on data. Just left click on it and select Edit Data. Pitch your topic with ease and precision using this Business Performance Highlights With Trend And Statistical Analysis Ppt Infographic Template Display PDF. This layout presents information on Statistical Trend Analysis, Main Metrics, Profit And Loss. It is also available for immediate download and adjustment. So, changes can be made in the color, design, graphics or any other component to create a unique layout.

Retail Industry Examination For Footwear Company Infographics PDF
This slide covers retail sector analysis of a footwear company . It includes analysis based on product usage type, end users, distribution channel, key challenges and future opportunities for footwear industry. Pitch your topic with ease and precision using this Retail Industry Examination For Footwear Company Infographics PDF. This layout presents information on Changing Consumers, Shopping Patterns, Distribution Channel. It is also available for immediate download and adjustment. So, changes can be made in the color, design, graphics or any other component to create a unique layout.

 Home
Home