AI PPT Maker
Templates
PPT Bundles
Design Services
Business PPTs
Business Plan
Management
Strategy
Introduction PPT
Roadmap
Self Introduction
Timelines
Process
Marketing
Agenda
Technology
Medical
Startup Business Plan
Cyber Security
Dashboards
SWOT
Proposals
Education
Pitch Deck
Digital Marketing
KPIs
Project Management
Product Management
Artificial Intelligence
Target Market
Communication
Supply Chain
Google Slides
Research Services
 One Pagers
All Categories
-
Home
- Customer Favorites
- Order Management Dashboard
Order Management Dashboard
Storage Facility Productivity Tracking KPI Dashboard Graphics PDF
This slide showcases a dashboard for tracking and managing warehouse productivity to optimize logistics operations. It includes key components such as warehouse operating costs, perfect order rate, total shipments by country and on time shipments. Showcasing this set of slides titled Storage Facility Productivity Tracking KPI Dashboard Graphics PDF. The topics addressed in these templates are Warehouse Operating Costs, Perfect Order Rate, Total Shipment Country. All the content presented in this PPT design is completely editable. Download it and make adjustments in color, background, font etc. as per your unique business setting.
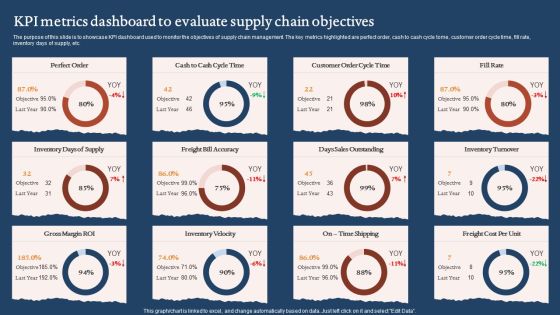
KPI Metrics Dashboard To Evaluate Supply Chain Objectives Graphics PDF
The purpose of this slide is to showcase KPI dashboard used to monitor the objectives of supply chain management. The key metrics highlighted are perfect order, cash to cash cycle tome, customer order cycle time, fill rate, inventory days of supply, etc. Pitch your topic with ease and precision using this KPI Metrics Dashboard To Evaluate Supply Chain Objectives Graphics PDF. This layout presents information on Days Sales Outstanding, Inventory Velocity, Gross Margin Roi. It is also available for immediate download and adjustment. So, changes can be made in the color, design, graphics or any other component to create a unique layout.
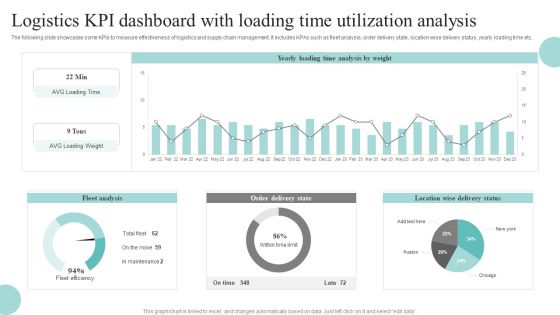
Logistics KPI Dashboard With Loading Time Utilization Analysis Download PDF
The following slide showcases some KPIs to measure effectiveness of logistics and supply chain management. It includes KPAs such as fleet analysis, order delivery state, location wise delivery status, yearly loading time etc. Pitch your topic with ease and precision using this Logistics KPI Dashboard With Loading Time Utilization Analysis Download PDF. This layout presents information on Fleet Analysis, Order Delivery State, Location Wise Delivery Status. It is also available for immediate download and adjustment. So, changes can be made in the color, design, graphics or any other component to create a unique layout.

Crm Marketing Dashboard Ppt PowerPoint Presentation Icon Graphic Tips
This is a crm marketing dashboard ppt powerpoint presentation icon graphic tips. This is a two stage process. The stages in this process are leads per week, leads this week.
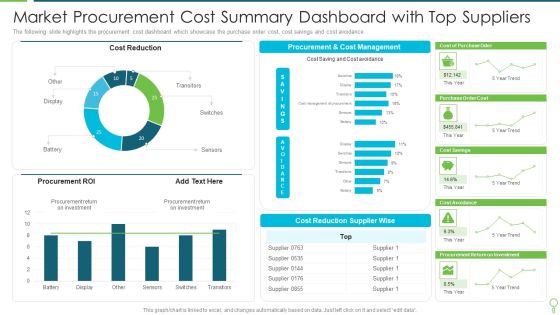
Market Procurement Cost Summary Dashboard With Top Suppliers Portrait PDF
The following slide highlights the procurement cost dashboard which showcase the purchase order cost, cost savings and cost avoidance. Pitch your topic with ease and precision using this Market Procurement Cost Summary Dashboard With Top Suppliers Portrait PDF. This layout presents information on Cost Reduction, Supplier, Management. It is also available for immediate download and adjustment. So, changes can be made in the color, design, graphics or any other component to create a unique layout.
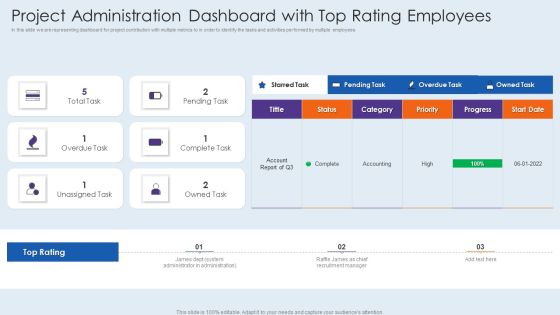
Project Administration Dashboard With Top Rating Employees Information PDF
In this slide we are representing dashboard for project contribution with multiple metrics to in order to identify the tasks and activities performed by multiple employees. Showcasing this set of slides titled project administration dashboard with top rating employees information pdf. The topics addressed in these templates are project administration dashboard with top rating employees. All the content presented in this PPT design is completely editable. Download it and make adjustments in color, background, font etc. as per your unique business setting.

Building Projects Risk Landscape Vendor Supplier Analysis Dashboard Guidelines PDF
Here in this slide we include Dashboard covering supplier order value, defect rate, and quality score for making decisions regarding supplier selection. Deliver and pitch your topic in the best possible manner with this building projects risk landscape vendor supplier analysis dashboard guidelines pdf. Use them to share invaluable insights on vendor supplier analysis dashboard and impress your audience. This template can be altered and modified as per your expectations. So, grab it now.

Capital Investment Options Vendor Compliance Kpi Dashboard Designs PDF
Mentioned slide displays vendor compliance KPI dashboard. KPIs covered are top supplier by partner status, average procurement cycle time and average procurement cycle. Deliver an awe inspiring pitch with this creative Capital Investment Options Vendor Compliance Kpi Dashboard Designs PDF bundle. Topics like Average Procurement, Cycle Time, Confirmation, Order Placement can be discussed with this completely editable template. It is available for immediate download depending on the needs and requirements of the user.

Vendor Compliance KPI Dashboard Real Estate Project Funding Inspiration PDF
Mentioned slide displays vendor compliance KPI dashboard. Kips covered are top supplier by partner status, average procurement cycle time and average procurement cycle.Deliver and pitch your topic in the best possible manner with this Vendor Compliance KPI Dashboard Real Estate Project Funding Inspiration PDF. Use them to share invaluable insights on Contract Compliance, Average Procurement, Order Placement and impress your audience. This template can be altered and modified as per your expectations. So, grab it now.

Customer Retention Dashboard For Cnn E Commerce Company Background PDF
The slide shows the Customer Retention Rate dashboard in order to measure variables such as churn rate, net customer gained, net promotor score, retention rate etc. Deliver an awe-inspiring pitch with this creative customer retention dashboard for cnn e commerce company background pdf bundle. Topics like customer retention rate, net promoter score, target can be discussed with this completely editable template. It is available for immediate download depending on the needs and requirements of the user.
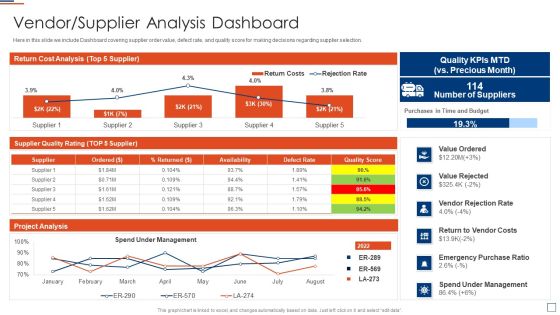
Risk Evaluation And Mitigation Vendor Supplier Analysis Dashboard Clipart PDF
Here in this slide we include Dashboard covering supplier order value, defect rate, and quality score for making decisions regarding supplier selection. Deliver an awe inspiring pitch with this creative Risk Evaluation And Mitigation Vendor Supplier Analysis Dashboard Clipart PDF bundle. Topics like Cost Analysis, Project Analysis, Supplier Quality can be discussed with this completely editable template. It is available for immediate download depending on the needs and requirements of the user.

Crm Dashboard Template Ppt PowerPoint Presentation Gallery Shapes
This is a crm dashboard template ppt powerpoint presentation gallery shapes. This is a four stage process. The stages in this process are open tickets, closed tickets, new orders, new clients.
Icon For Risk Metrics Performance Indicators Dashboard Designs PDF
Persuade your audience using this Icon For Risk Metrics Performance Indicators Dashboard Designs PDF. This PPT design covers four stages, thus making it a great tool to use. It also caters to a variety of topics including Icon For Risk Metrics Performance Indicators Dashboard. Download this PPT design now to present a convincing pitch that not only emphasizes the topic but also showcases your presentation skills.

Sales Performance Dashboard Ppt PowerPoint Presentation Gallery Background
This is a sales performance dashboard ppt powerpoint presentation gallery backgroun. This is a six stage process. The stages in this process are sales comparison, sales by product category, rankings, revenue, new customers.

Nps Reports And Dashboard Roadmap Ppt Infographic Template Maker PDF
This is a nps reports and dashboard roadmap ppt infographic template maker pdf template with various stages. Focus and dispense information on five stages using this creative set, that comes with editable features. It contains large content boxes to add your information on topics like roadmap. You can also showcase facts, figures, and other relevant content using this PPT layout. Grab it now.

Bookkeeping Payable Automation Invoice Processing Dashboard Summary PDF
The following slide highlights dashboard for accounts payable automation. It includes components such as purchase order invoices, approval pending, approved, invoice status, processed status, total invoice scanned, top 5 exceptions etc. Showcasing this set of slides titled Bookkeeping Payable Automation Invoice Processing Dashboard Summary PDF. The topics addressed in these templates are Processor Productivity, Bookkeeping Payable Automation, Invoice Processing Dashboard. All the content presented in this PPT design is completely editable. Download it and make adjustments in color, background, font etc. as per your unique business setting.

HR Analytical Workforce Administration Kpi Dashboard Introduction PDF
The below slide provides an insights to various KPAs of HR analytics. It includes elements such as extra time worked, leave hours, job order wise workforce expenses, expected versus actual hours etc. Showcasing this set of slides titled HR Analytical Workforce Administration Kpi Dashboard Introduction PDF. The topics addressed in these templates are Workforce Expenses, Administration KPI Dashboard. All the content presented in this PPT design is completely editable. Download it and make adjustments in color, background, font etc. as per your unique business setting.

Customer Retention Dashboard For CNN E Commerce Company Sample PDF
The slide shows the Customer Retention Rate dashboard in order to measure variables such as churn rate, net customer gained, net promotor score, retention rate etc. Deliver and pitch your topic in the best possible manner with this customer retention dashboard for CNN e commerce company sample pdf. Use them to share invaluable insights on customer retention rate, net customers gained this month, net promoter score and impress your audience. This template can be altered and modified as per your expectations. So, grab it now.

Customer Retention Dashboard For CNN E Commerce Company Ideas PDF
The slide shows the Customer Retention Rate dashboard in order to measure variables such as churn rate, net customer gained, net promotor score, retention rate etc. Deliver and pitch your topic in the best possible manner with this customer retention dashboard for CNN e commerce company ideas pdf. Use them to share invaluable insights on net promoter score, current month to date, current month to date, customer retention rate and impress your audience. This template can be altered and modified as per your expectations. So, grab it now.

Customer Retention Dashboard For CNN E Commerce Company Brochure PDF
The slide shows the Customer Retention Rate dashboard in order to measure variables such as churn rate, net customer gained, net promotor score, retention rate etc. Deliver and pitch your topic in the best possible manner with this customer retention dashboard for CNN e commerce company brochure pdf. Use them to share invaluable insights on net promoter score, current month to date, current month to date, customer retention rate and impress your audience. This template can be altered and modified as per your expectations. So, grab it now.

Manufactured Products Sales Performance Monitoring Dashboard Information PDF
This slide shows the dashboard the data related to the sales performance of the products manufactured by the organization in order to effectively measure and monitor the performance of the sales team. It shows details related to revenue generated and units sold etc.Pitch your topic with ease and precision using this Manufactured Products Sales Performance Monitoring Dashboard Information PDF. This layout presents information on Monthly Revenue, Manufactured Products, Sales Performance Monitoring. It is also available for immediate download and adjustment. So, changes can be made in the color, design, graphics or any other component to create a unique layout.

Dashboard To Track Ecommerce Website Revenue And Traffic Rules PDF
This slide showcases dashboard that can help organization to track the traffic and revenue of ecommerce website. Its key elements are ecommerce conversion rate, average order value, performance by traffic source, top product, performance by device category. There are so many reasons you need a Dashboard To Track Ecommerce Website Revenue And Traffic Rules PDF. The first reason is you can not spend time making everything from scratch, Thus, Slidegeeks has made presentation templates for you too. You can easily download these templates from our website easily.

Crm Dashboard Top Customers Ppt PowerPoint Presentation Graphics
This is a crm dashboard top customers ppt powerpoint presentation graphics. This is a ten stage process. The stages in this process are top customers, business, marketing, process, management.

Brand Performance Dashboard Template 1 Ppt PowerPoint Presentation Inspiration
This is a brand performance dashboard template 1 ppt powerpoint presentation inspiration. This is a ten stage process. The stages in this process are new customer, film, dollars, amazon.

Brand Performance Dashboard Ppt PowerPoint Presentation Professional Grid
This is a brand performance dashboard ppt powerpoint presentation professional grid. This is a three stage process. The stages in this process are customer recognition, enhanced sales, competitive edge, dashboard, business.

Brand Performance Dashboard Ppt PowerPoint Presentation Layouts Summary
This is a brand performance dashboard ppt powerpoint presentation layouts summary. This is a three stage process. The stages in this process are customer recognition, enhanced sales, competitive edge, dashboard, business.

Brand Performance Dashboard Ppt PowerPoint Presentation Show Graphic Tips
This is a brand performance dashboard ppt powerpoint presentation show graphic tips. This is a three stage process. The stages in this process are customer recognition, enhanced sales, competitive edge, dashboard, business, percentage.
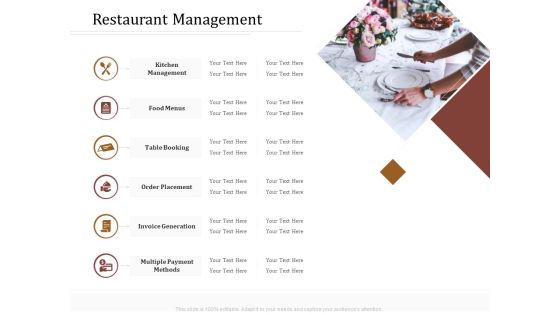
Key Metrics Hotel Administration Management Restaurant Management Template PDF
Presenting this set of slides with name key metrics hotel administration management restaurant management template pdf. The topics discussed in these slides are kitchen management, food menus, table booking, order placement, invoice generation. This is a completely editable PowerPoint presentation and is available for immediate download. Download now and impress your audience.
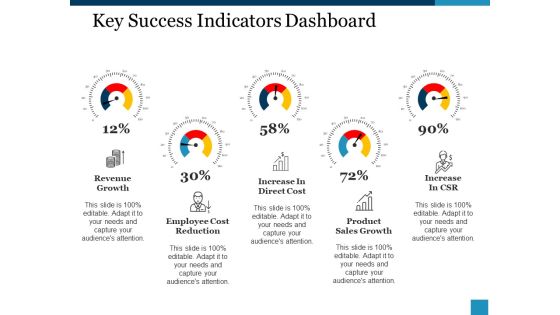
Key Success Indicators Dashboard Ppt PowerPoint Presentation Inspiration Guide
This is a key success indicators dashboard ppt powerpoint presentation inspiration guide. This is a five stage process. The stages in this process are revenue growth, increase in direct cost, increase in csr, employee cost reduction, product, sales growth.

Brand Performance Dashboard Ppt PowerPoint Presentation Infographics Shapes
This is a brand performance dashboard ppt powerpoint presentation infographics shapes. This is a three stage process. The stages in this process are customer recognition, enhanced sales, competitive edge.

Brand Performance Dashboard Ppt PowerPoint Presentation Infographic Template Designs
This is a brand performance dashboard ppt powerpoint presentation infographic template designs. This is a three stage process. The stages in this process are customer recognition, enhanced sales, competitive edge.
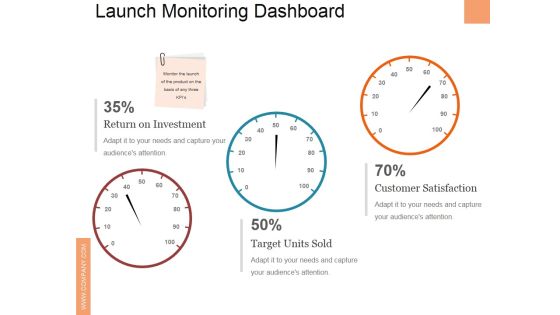
Launch Monitoring Dashboard Ppt PowerPoint Presentation File Clipart
This is a launch monitoring dashboard ppt powerpoint presentation file clipart. This is a three stage process. The stages in this process are return on investment, target units sold, customer satisfaction.
Launch Monitoring Dashboard Ppt PowerPoint Presentation Gallery Professional
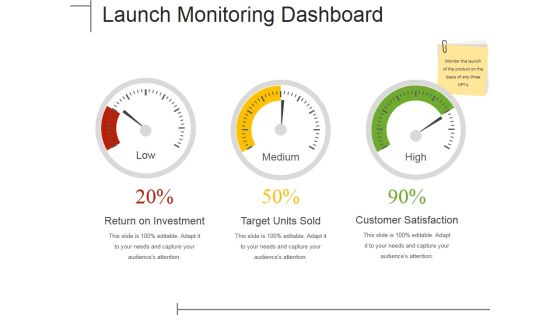
This is a launch monitoring dashboard ppt powerpoint presentation gallery professional. This is a three stage process. The stages in this process are return on investment, target units sold, customer satisfaction.

Launch Monitoring Dashboard Ppt PowerPoint Presentation Professional Inspiration
This is a launch monitoring dashboard ppt powerpoint presentation professional inspiration. This is a three stage process. The stages in this process are return on investment, target units sold, customer satisfaction.

Brand Performance Dashboard Ppt PowerPoint Presentation Icon Microsoft
This is a brand performance dashboard ppt powerpoint presentation icon microsoft. This is a three stage process. The stages in this process are customer recognition, enhanced sales, competitive edge.

Customer Service Bench Marking Dashboard Ppt PowerPoint Presentation Summary Format
This is a customer service bench marking dashboard ppt powerpoint presentation summary format. This is a four stage process. The stages in this process are business, marketing, dashboard, management.

Dashboard To Measure Display Advertising Campaigns Performance Graphics PDF
This slide provides a dashboard to monitor the display advertising campaign performance in order to reduce overall marketing cost. It incorporates advertising cost, average number of clicks and impressions, clicks per day, revenue by campaign, etc. Formulating a presentation can take up a lot of effort and time, so the content and message should always be the primary focus. The visuals of the PowerPoint can enhance the presenters message, so our Dashboard To Measure Display Advertising Campaigns Performance Graphics PDF was created to help save time. Instead of worrying about the design, the presenter can concentrate on the message while our designers work on creating the ideal templates for whatever situation is needed. Slidegeeks has experts for everything from amazing designs to valuable content, we have put everything into Dashboard To Measure Display Advertising Campaigns Performance Graphics PDF

Crm Dashboard Top Customers Ppt PowerPoint Presentation Infographics Format
This is a crm dashboard top customers ppt powerpoint presentation infographics format. This is a ten stage process. The stages in this process are top customers, people, management, business, marketing.
Predictive Analytics Dashboard To Track Manufacturing Operations Rules PDF
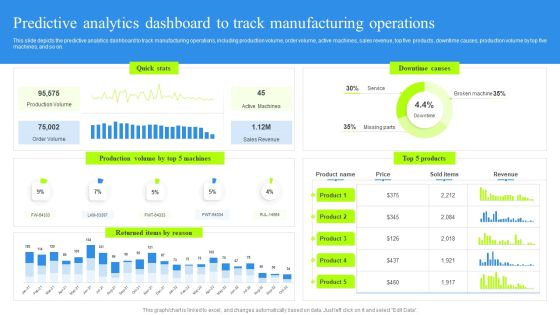
This slide depicts the predictive analytics dashboard to track manufacturing operations, including production volume, order volume, active machines, sales revenue, top five products, downtime causes, production volume by top five machines, and so on. Present like a pro with Predictive Analytics Dashboard To Track Manufacturing Operations Rules PDF Create beautiful presentations together with your team, using our easy-to-use presentation slides. Share your ideas in real-time and make changes on the fly by downloading our templates. So whether you are in the office, on the go, or in a remote location, you can stay in sync with your team and present your ideas with confidence. With Slidegeeks presentation got a whole lot easier. Grab these presentations today.
Customer Service Team Review Dashboard Powerpoint Slide Rules
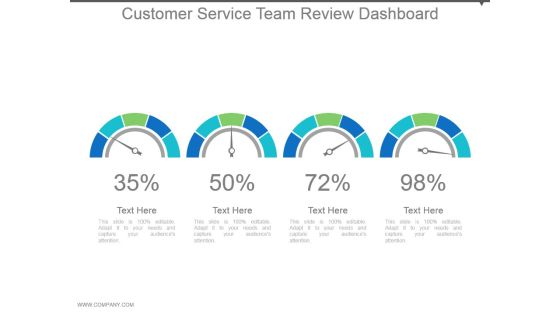
This is a customer service team review dashboard powerpoint slide rules. This is a four stage process. The stages in this process are dashboard, meter, financials, speed, measure.
Supplier Association Management Techniques Suppliers Management Process Introduction PDF
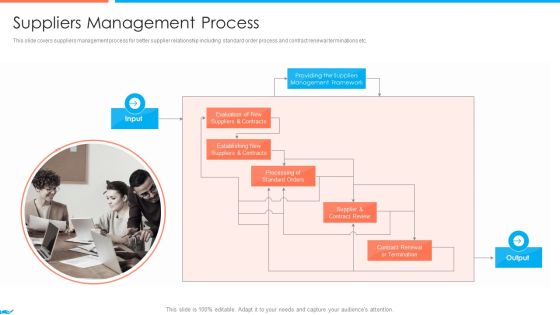
This slide covers suppliers management process for better supplier relationship including standard order process and contract renewal terminations etc. This is a supplier association management techniques supplier performance management kpi dashboards guidelines pdf template with various stages. Focus and dispense information on two stages using this creative set, that comes with editable features. It contains large content boxes to add your information on topics like transactional level, review of performance, strategic alliance. You can also showcase facts, figures, and other relevant content using this PPT layout. Grab it now.

Key Success Indicators Dashboard Ppt PowerPoint Presentation Model Gallery
This is a key success indicators dashboard ppt powerpoint presentation model gallery. This is a five stage process. The stages in this process are business, strategy, marketing, analysis, finance, dashboard.

Organization IT Service Desk Administration Performance Dashboard Infographics PDF
This slide represents the dashboard showing the performance of the service desk management team of the organization. It shows details related to benchmark achieved, customer satisfaction, contracts by type and manufacturer, incidents by category, computer by status, service level management etc. Showcasing this set of slides titled Organization IT Service Desk Administration Performance Dashboard Infographics PDF. The topics addressed in these templates are Service, Management, Manufacturer. All the content presented in this PPT design is completely editable. Download it and make adjustments in color, background, font etc. as per your unique business setting.
Project Metrics Dashboard With Revenues And Expenses Icons PDF
This slide shows the project management dashboard which covers the name, priorities, indicators and status which includes strategic priorities, research and development, administration, performance management, etc. With purchases in last 30 days and tasks. Showcasing this set of slides titled Project Metrics Dashboard With Revenues And Expenses Icons PDF. The topics addressed in these templates are Performance Management, Research And Development, Strategic Priorities. All the content presented in this PPT design is completely editable. Download it and make adjustments in color, background, font etc. as per your unique business setting.

Effective Outcome Launch Roadmap Dashboard Ppt Professional Files PDF
Presenting this set of slides with name effective outcome launch roadmap dashboard ppt professional files pdf. This is a one stage process. The stages in this process are dashboard. This is a completely editable PowerPoint presentation and is available for immediate download. Download now and impress your audience.
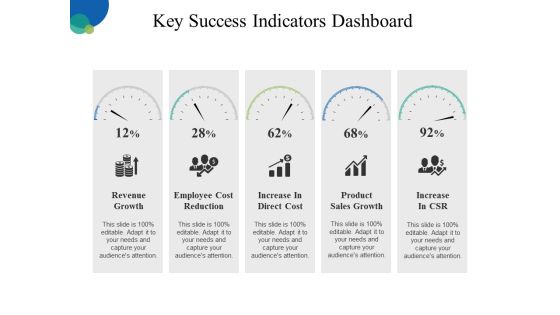
Key Success Indicators Dashboard Ppt PowerPoint Presentation Outline Slideshow
This is a key success indicators dashboard ppt powerpoint presentation outline slideshow. This is a five stage process. The stages in this process are revenue growth, employee cost reduction, increase in direct cost, product sales growth, increase in csr.

Launch Monitoring Dashboard Ppt PowerPoint Presentation Slides Structure
This is a launch monitoring dashboard ppt powerpoint presentation slides structure. This is a three stage process. The stages in this process are return on investment, target units sold, customer satisfaction.
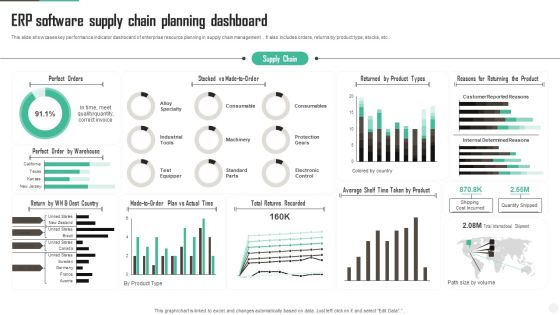
ERP Software Supply Chain Planning Dashboard Diagrams PDF
This slide showcases key performance indicator dashboard of enterprise resource planning in supply chain management . It also includes orders, returns by product type, stocks, etc. Showcasing this set of slides titled ERP Software Supply Chain Planning Dashboard Diagrams PDF Sample. The topics addressed in these templates are Perfect Orders, Dest Country, Actual Time. All the content presented in this PPT design is completely editable. Download it and make adjustments in color, background, font etc. as per your unique business setting.

Customer Attrition Rate Dashboard For IBN Outsourcing Company Infographics PDF
This slide shows a Customer Attrition Rate Dashboard with KPIs such as Company Revenue , Customer Attrition Rate in 2021 , Annual Growth Rate , Average Customer Queue Time , Onboarding Process Effectiveness etc. This is a customer attrition rate dashboard for ibn outsourcing company infographics pdf template with various stages. Focus and dispense information on eight stages using this creative set, that comes with editable features. It contains large content boxes to add your information on topics like company revenue, annual growth, customer satisfaction, onboarding process, service adoption. You can also showcase facts, figures, and other relevant content using this PPT layout. Grab it now.

Dashboard Of Customer Satisfaction At BPO Ppt Outline Mockup PDF
Presenting dashboard of customer satisfaction at bpo ppt outline mockup pdf to dispense important information. This template comprises two stages. It also presents valuable insights into the topics including customer retention, net promoter score. This is a completely customizable PowerPoint theme that can be put to use immediately. So, download it and address the topic impactfully.

Brand Building Brand Performance Dashboard Ppt Icon Diagrams PDF
Presenting this set of slides with name brand building brand performance dashboard ppt icon diagrams pdf. This is a three stage process. The stages in this process are customer recognition, enhanced sales, competitive edge. This is a completely editable PowerPoint presentation and is available for immediate download. Download now and impress your audience.

TCM For Technical Analysis Dashboard Indicating Intervention Time Background PDF
This Slide shows technology change management dashboard indicating Change and Release Management which can be referred by It managers for effective handling of technical change. It includes information about operational, unassigned, overhead, hold, conflicts and rejected change. Showcasing this set of slides titled TCM For Technical Analysis Dashboard Indicating Intervention Time Background PDF. The topics addressed in these templates are Operational Change, Unassigned Changes, Change Overhead. All the content presented in this PPT design is completely editable. Download it and make adjustments in color, background, font etc. as per your unique business setting.

Loyalty Program Performance Dashboard Ppt PowerPoint Presentation Summary Grid
This is a loyalty program performance dashboard ppt powerpoint presentation summary grid. This is a six stage process. The stages in this process are average sale by loyalty member type, average award by customer, all orders by promotions, average sale by loyalty segment, sales by channel.

KPI Dashboard For Modernizing Hospitality Business Inspiration PDF
The following slide showcases dashboard to track data and perform analytics for managing staff, ordering supplies and to maintain customer satisfaction. It presents information related to expenses, sales, etc. Pitch your topic with ease and precision using this KPI Dashboard For Modernizing Hospitality Business Inspiration PDF. This layout presents information on Fiscal Year, Labor, Modernizing Hospitality. It is also available for immediate download and adjustment. So, changes can be made in the color, design, graphics or any other component to create a unique layout.

Crm Software Dashboard With Team Performance Topics PDF
This slide shows the using customer relationship management tool for managing their database which includes name of customer, bio, social profiles, creation date, last seen, country, total visits and plan. Showcasing this set of slides titled Crm Software Dashboard With Team Performance Topics PDF. The topics addressed in these templates are Competitive Customer Relationship Tool, Customer Database Management. All the content presented in this PPT design is completely editable. Download it and make adjustments in color, background, font etc. as per your unique business setting.

Project Status Visual Dashboard Indicator Ppt Images Gallery
This is a project status visual dashboard indicator ppt images gallery. This is a four stage process. The stages in this process are business, marketing, dashboard, measure, presentation.

Agile PM Dashboard With Budget Allocation Guidelines PDF
This template covers dashboard to show details for agile project management which includes cost performance index, scheduled performance index, project completion with net change. Showcasing this set of slides titled Agile PM Dashboard With Budget Allocation Guidelines PDF. The topics addressed in these templates are Actual Cost, Budget Allocation, Agile Pm Dashboard. All the content presented in this PPT design is completely editable. Download it and make adjustments in color, background, font etc. as per your unique business setting.
Information Technology Transformation Organization Inventory Dashboard Icons PDF
Following slide shows inventory management dashboard. It includes the status of total inventories along with information on how much was received, on hold and shipped. Deliver and pitch your topic in the best possible manner with this information technology transformation organization inventory dashboard icons pdf. Use them to share invaluable insights on inventory dashboard and impress your audience. This template can be altered and modified as per your expectations. So, grab it now.

Finance Metrics Dashboard Indicating Portfolio Performance Microsoft PDF
This graph or chart is linked to excel, and changes automatically based on data. Just left click on it and select edit data. Pitch your topic with ease and precision using this Finance Metrics Dashboard Indicating Portfolio Performance Microsoft PDF. This layout presents information on Portfolio Performance Portfolio, Asset Management Manager, Top 10 Assets. It is also available for immediate download and adjustment. So, changes can be made in the color, design, graphics or any other component to create a unique layout.

Information Technology Sales Team Accomplishment Evaluation Dashboard Rules PDF
This slide shows IT team performance management dashboard. It provides information about person, design, research and development, testing, launch, timeline, etc.Showcasing this set of slides titled information technology sales team accomplishment evaluation dashboard rules pdf The topics addressed in these templates are information technology sales team accomplishment evaluation dashboard All the content presented in this PPT design is completely editable. Download it and make adjustments in color, background, font etc. as per your unique business setting.
