Order Management Dashboard

Content Delivery Network Edge Server Key CDN Metrics To Watch Structure PDF
This slide represents the key CDN metrics to watch while looking for a CDN provider, such as the time it takes DNS to reply. Presenting Content Delivery Network Edge Server Key CDN Metrics To Watch Structure PDF to provide visual cues and insights. Share and navigate important information on seven stages that need your due attention. This template can be used to pitch topics like Key CDN Metrics, Potential. In addtion, this PPT design contains high resolution images, graphics, etc, that are easily editable and available for immediate download.
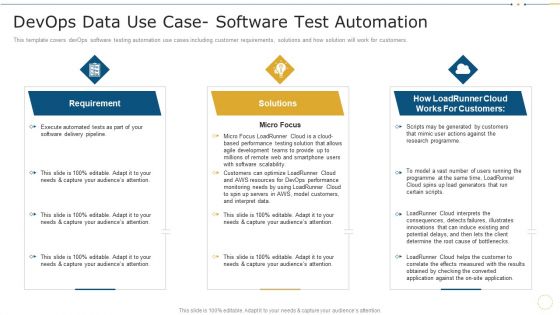
Devops Data Use Case Software Test Automation Data Record Cases Of Devops IT Brochure PDF
This template covers devOps software testing automation use cases including customer requirements, solutions and how solution will work for customers. Presenting devops data use case software test automation data record cases of devops it brochure pdf to provide visual cues and insights. Share and navigate important information on three stages that need your due attention. This template can be used to pitch topics like requirement, customers, development, performance, resources. In addtion, this PPT design contains high resolution images, graphics, etc, that are easily editable and available for immediate download.

Business Men PowerPoint Templates Download Man Standing Near Big Calculator Slides
We present our business men powerpoint templates download man standing near big calculator Slides.Present our Business PowerPoint Templates because Timeline crunches are a fact of life. Meet all deadlines using our PowerPoint Templates and Slides. Use our Finance PowerPoint Templates because Our PowerPoint Templates and Slides are focused like a searchlight beam. They highlight your ideas for your target audience. Download our Success PowerPoint Templates because Our PowerPoint Templates and Slides are a sure bet. Gauranteed to win against all odds. Download our Marketing PowerPoint Templates because You can Bait your audience with our PowerPoint Templates and Slides. They will bite the hook of your ideas in large numbers. Download and present our Future PowerPoint Templates because Our PowerPoint Templates and Slides help you meet the demand of the Market. Just browse and pick the slides that appeal to your intuitive senses.Use these PowerPoint slides for presentations relating to 3d, abstract, accountant, add, analyzing, balance, banking, business,businessman, calculator, character, computer, concept, data, digital,display, economy, equal, finance, financial, human, idea, illustration, image,isolated, job, male, man, manager, math, mathematical, mind, minus, number,office, people, person, plastic, professional, render, science, sign, small,subtraction, technology, white, work. The prominent colors used in the PowerPoint template are Blue, Gray, Black.

Content Marketing Strategy Website Visitor Scoring To Identify Potential Leads Topics PDF
This slide shows the website visitor scoring system to identify potential leads on the basis of parameters such as products added to shopping cart, visited pricing page, read blog post, visited about page, etc. The Content Marketing Strategy Website Visitor Scoring To Identify Potential Leads Topics PDF is a compilation of the most recent design trends as a series of slides. It is suitable for any subject or industry presentation, containing attractive visuals and photo spots for businesses to clearly express their messages. This template contains a variety of slides for the user to input data, such as structures to contrast two elements, bullet points, and slides for written information. Slidegeeks is prepared to create an impression.

Medical Services Market Intelligence Reporting Process Four Quarter Roadmap Graphics
Presenting our innovatively structured medical services market intelligence reporting process four quarter roadmap graphics Template. Showcase your roadmap process in different formats like PDF, PNG, and JPG by clicking the download button below. This PPT design is available in both Standard Screen and Widescreen aspect ratios. It can also be easily personalized and presented with modified font size, font type, color, and shapes to measure your progress in a clear way.
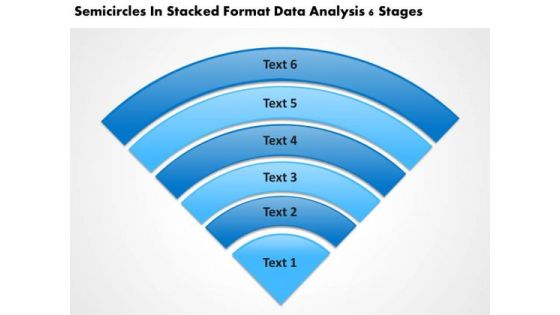
In Stacked Format Data Analysis 6 Stages Agency Business Plan PowerPoint Templates
We present our in stacked format data analysis 6 stages agency business plan PowerPoint templates.Use our Business PowerPoint Templates because You are working at that stage with an air of royalty. Let our PowerPoint Templates and Slides be the jewels in your crown. Download and present our Leadership PowerPoint Templates because Our PowerPoint Templates and Slides offer you the needful to organise your thoughts. Use them to list out your views in a logical sequence. Present our Layers PowerPoint Templates because Your audience will believe you are the cats whiskers. Download our Shapes PowerPoint Templates because Our PowerPoint Templates and Slides has conjured up a web of all you need with the help of our great team. Use them to string together your glistening ideas. Download and present our Triangles PowerPoint Templates because They will Put your wonderful verbal artistry on display. Our PowerPoint Templates and Slides will provide you the necessary glam and glitter.Use these PowerPoint slides for presentations relating to layers, icon, stratum, 3d, surface, isolated, segment, grow, blank, presentation, illustration, section, cutting, coat, set, background, thickness, spread, multiple. The prominent colors used in the PowerPoint template are Blue light, Blue navy, White.
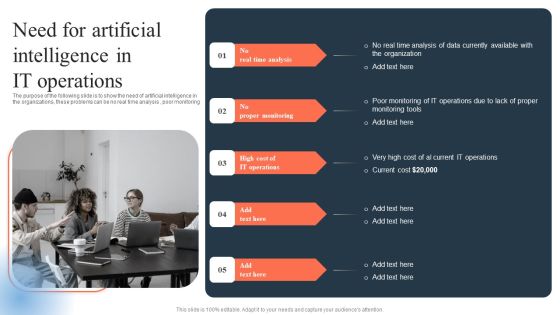
Ml And Big Data In Information Technology Processes Need For Artificial Intelligence In IT Operations Structure PDF
The purpose of the following slide is to show the need of artificial intelligence in the organizations, these problems can be no real time analysis , poor monitoring From laying roadmaps to briefing everything in detail, our templates are perfect for you. You can set the stage with your presentation slides. All you have to do is download these easy to edit and customizable templates. Ml And Big Data In Information Technology Processes Need For Artificial Intelligence In IT Operations Structure PDF will help you deliver an outstanding performance that everyone would remember and praise you for. Do download this presentation today.

Booting Brand Image By Tracking KPI Metrics Diagrams PDF
This slide consists of key performance indicators to be used by mangers to track the brand awareness . Key metrices covered are content reach, brand mention, blog shares, search volume data, repeat purchase and organic traffic. Showcasing this set of slides titled Booting Brand Image By Tracking KPI Metrics Diagrams PDF. The topics addressed in these templates are Content Reach, Brand Mentions, Blog Shares. All the content presented in this PPT design is completely editable. Download it and make adjustments in color, background, font etc. as per your unique business setting.

Medical Services Market Intelligence Reporting Process Half Yearly Roadmap Download
Introducing our medical services market intelligence reporting process half yearly roadmap download. This PPT presentation is Google Slides compatible, therefore, you can share it easily with the collaborators for measuring the progress. Also, the presentation is available in both standard screen and widescreen aspect ratios. So edit the template design by modifying the font size, font type, color, and shapes as per your requirements. As this PPT design is fully editable it can be presented in PDF, JPG and PNG formats.
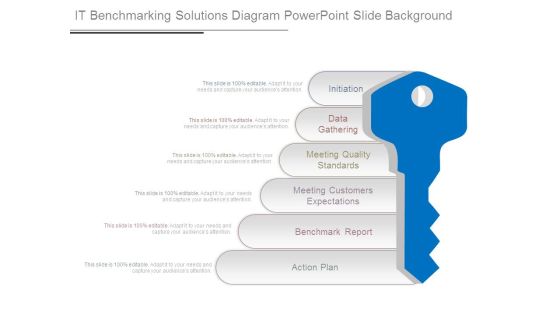
It Benchmarking Solutions Diagram Powerpoint Slide Background
This is a it benchmarking solutions diagram powerpoint slide background. This is a six stage process. The stages in this process are initiation, data gathering, meeting quality standards, meeting customers expectations, benchmark report, action plan.
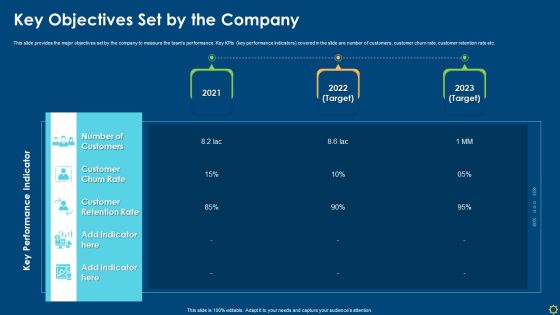
Improving Organizational Process Client Induction Procedure Key Objectives Set By The Company Mockup PDF
This slide provides the major objectives set by the company to measure the teams performance. Key KPIs key performance Indicators covered in the slide are number of customers, customer churn rate, customer retention rate etc. Deliver an awe inspiring pitch with this creative improving organizational process client induction procedure key objectives set by the company mockup pdf bundle. Topics like customer retention rate, customer churn rate, target can be discussed with this completely editable template. It is available for immediate download depending on the needs and requirements of the user.

Biomarker Categorization Hurdles Before Data Becomes An Insightful Digital Biomarker Pictures PDF
This slide represents the hurdles before data becomes an insightful digital biomarker and includes three stages assessment, cleaning, and application. These three stages are categorized into sections, including collecting data measurements, analyzing collected data, data parsing, and so on. Make sure to capture your audiences attention in your business displays with our gratis customizable Biomarker Categorization Hurdles Before Data Becomes An Insightful Digital Biomarker Pictures PDF. These are great for business strategies, office conferences, capital raising or task suggestions. If you desire to acquire more customers for your tech business and ensure they stay satisfied, create your own sales presentation with these plain slides.
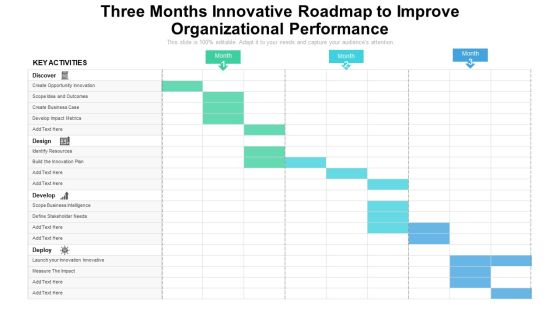
Three Months Innovative Roadmap To Improve Organizational Performance Infographics
We present our three months innovative roadmap to improve organizational performance infographics. This PowerPoint layout is easy to edit so you can change the font size, font type, color, and shape conveniently. In addition to this, the PowerPoint layout is Google Slides compatible, so you can share it with your audience and give them access to edit it. Therefore, download and save this well researched three months innovative roadmap to improve organizational performance infographics in different formats like PDF, PNG, and JPG to smoothly execute your business plan.

Customer Engagement Acquisition And Progress Tactics Ppt PowerPoint Presentation Icon Layout Ideas PDF
Presenting customer engagement acquisition and progress tactics ppt powerpoint presentation icon layout ideas pdf to dispense important information. This template comprises one stages. It also presents valuable insights into the topics including social, ecommerce, emerging technologies, listening data analytics platform, holistic customer profile, transactional data. This is a completely customizable PowerPoint theme that can be put to use immediately. So, download it and address the topic impactfully.

Comprehensive Guide For Storytelling Promotion Brand Storytelling Podcast Performance Indicators Infographics PDF
This slide mentions metrics that can be evaluated to track performance of brands podcast and practices to improve the same. The metrics discussed include number of downloads, number of listeners, podcast subscription, backlinks and podcast ranking. Present like a pro with Comprehensive Guide For Storytelling Promotion Brand Storytelling Podcast Performance Indicators Infographics PDF Create beautiful presentations together with your team, using our easy to use presentation slides. Share your ideas in real time and make changes on the fly by downloading our templates. So whether you are in the office, on the go, or in a remote location, you can stay in sync with your team and present your ideas with confidence. With Slidegeeks presentation got a whole lot easier. Grab these presentations today.

Financial Reporting Considerations For The Shipping Industry Impairment Download PDF
This template covers the details on impact of COVID on vessels and goodwill of the company such as a decline in potential charter rates, rises in off hire days, changes in fuel prices, rises decreases in operating costs, increase in inflation.This is a financial reporting considerations for the shipping industry impairment download pdf. template with various stages. Focus and dispense information on four stages using this creative set, that comes with editable features. It contains large content boxes to add your information on topics like volatility should be expressed in schedules, projections and other expectations, global stock markets are witnessing extreme, organization has to determine. You can also showcase facts, figures, and other relevant content using this PPT layout. Grab it now.
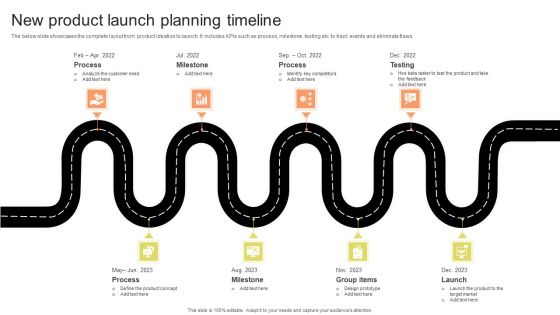
New Product Launch Planning Timeline Portrait PDF
The below slide showcases the complete layout from product ideation to launch. It includes KPIs such as process, milestone, testing etc. to track events and eliminate flaws. Presenting New Product Launch Planning Timeline Portrait PDF to dispense important information. This template comprises Eight stages. It also presents valuable insights into the topics including Process, Milestone, Testing. This is a completely customizable PowerPoint theme that can be put to use immediately. So, download it and address the topic impactfully.

Effective Data Arrangement For Data Accessibility And Processing Readiness Ppt PowerPoint Presentation Complete Deck With Slides
This complete deck covers various topics and highlights important concepts. It has PPT slides which cater to your business needs. This complete deck presentation emphasizes effective data arrangement for data accessibility and processing readiness ppt powerpoint presentation complete deck with slides and has templates with professional background images and relevant content. This deck consists of total of sixty slides. Our designers have created customizable templates, keeping your convenience in mind. You can edit the colour, text and font size with ease. Not just this, you can also add or delete the content if needed. Get access to this fully editable complete presentation by clicking the download button below.
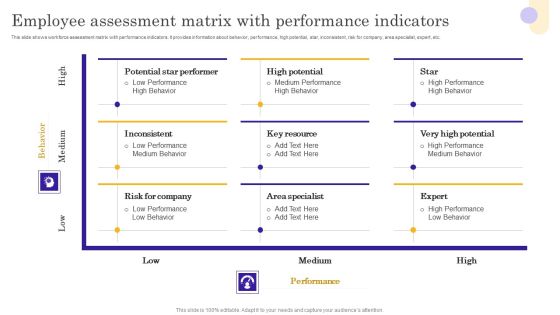
Vendor Performance Assessment Matrix With Scoring Metrics Infographics PDF
This slide shows workforce assessment matrix with performance indicators. It provides information about behavior, performance, high potential, star, inconsistent, risk for company, area specialist, expert, etc. Showcasing this set of slides titled Vendor Performance Assessment Matrix With Scoring Metrics Infographics PDF. The topics addressed in these templates are Potential Star Performer, High Potential, Inconsistent. All the content presented in this PPT design is completely editable. Download it and make adjustments in color, background, font etc. as per your unique business setting.

Overview And Types Of Traditional Outbound Marketing Strategies Graphics PDF
This slide showcases traditional outbound marketing strategy overview that can help organization to target local potential customers and increase sales. It also showcases benefits of implementing traditional outbound marketing strategy for business. The Overview And Types Of Traditional Outbound Marketing Strategies Graphics PDF is a compilation of the most recent design trends as a series of slides. It is suitable for any subject or industry presentation, containing attractive visuals and photo spots for businesses to clearly express their messages. This template contains a variety of slides for the user to input data, such as structures to contrast two elements, bullet points, and slides for written information. Slidegeeks is prepared to create an impression.

Medical Services Market Intelligence Reporting Process Five Year Roadmap Professional
We present our medical services market intelligence reporting process five year roadmap professional. This PowerPoint layout is easy to edit so you can change the font size, font type, color, and shape conveniently. In addition to this, the PowerPoint layout is Google Slides compatible, so you can share it with your audience and give them access to edit it. Therefore, download and save this well researched medical services market intelligence reporting process five year roadmap professional in different formats like PDF, PNG, and JPG to smoothly execute your business plan.
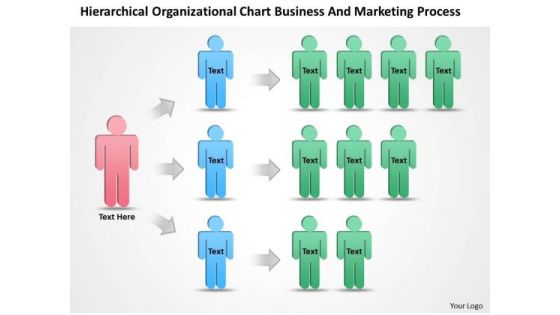
Organizational Development Chart Business And Marketing Process PowerPoint Templates
We present our organizational development chart business and marketing process powerpoint templates.Present our Advertising PowerPoint Templates because you can Set pulses racing with our PowerPoint Templates and Slides. They will raise the expectations of your team. Download our Leadership PowerPoint Templates because You have gained great respect for your brilliant ideas. Use our PowerPoint Templates and Slides to strengthen and enhance your reputation. Download our Arrows PowerPoint Templates because You can Stir your ideas in the cauldron of our PowerPoint Templates and Slides. Cast a magic spell on your audience. Present our Org Charts PowerPoint Templates because Your ideas provide food for thought. Our PowerPoint Templates and Slides will help you create a dish to tickle the most discerning palate. Download our Business PowerPoint Templates because Your audience will believe you are the cats whiskers.Use these PowerPoint slides for presentations relating to Chart, flow, organization, flowchart, diagram, sitemap, process, box, arrow, graph, business, graphical, data, design, important, rectangle, corporate, plan, president, concept, hierarchy, glossy, teamwork, tier, chain, supervisor, relation, steps, glassy, connection, ladder, administration, group, connect, organize, connectivity, site-map, office, financial, structure, officer, glass. The prominent colors used in the PowerPoint template are Green, Blue, Pink.
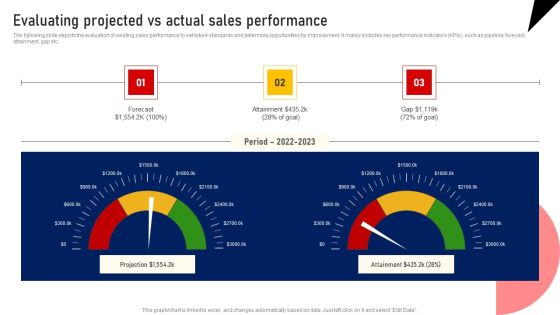
Performing Sales Risk Analysis Procedure Evaluating Projected Vs Actual Sales Performance Pictures PDF
The following slide depicts the evaluation of existing sales performance to set future standards and determine opportunities for improvement. It mainly includes key performance indicators KPIs such as pipeline, forecast, attainment, gap etc. There are so many reasons you need a Performing Sales Risk Analysis Procedure Evaluating Projected Vs Actual Sales Performance Pictures PDF. The first reason is you can not spend time making everything from scratch, Thus, Slidegeeks has made presentation templates for you too. You can easily download these templates from our website easily.

New Marketing Initiatives To Expand Customer Outreach Ppt PowerPoint Presentation File Diagrams PDF
This slide provides information regarding future predictions for Amazon platform through marketing initiatives to increase customer outreach. The predictions include rise in sponsored ads, expanding video content, use of voice search, etc. The New Marketing Initiatives To Expand Customer Outreach Ppt PowerPoint Presentation File Diagrams PDF is a compilation of the most recent design trends as a series of slides. It is suitable for any subject or industry presentation, containing attractive visuals and photo spots for businesses to clearly express their messages. This template contains a variety of slides for the user to input data, such as structures to contrast two elements, bullet points, and slides for written information. Slidegeeks is prepared to create an impression.
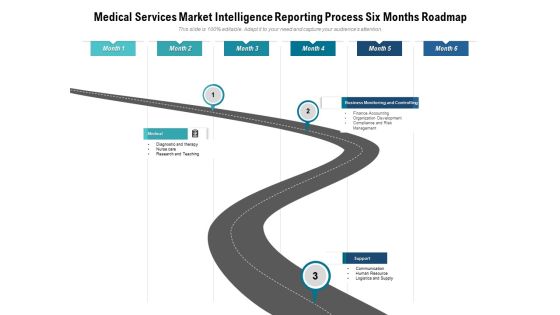
Medical Services Market Intelligence Reporting Process Six Months Roadmap Microsoft
Presenting the medical services market intelligence reporting process six months roadmap microsoft. The template includes a roadmap that can be used to initiate a strategic plan. Not only this, the PowerPoint slideshow is completely editable and you can effortlessly modify the font size, font type, and shapes according to your needs. This PPT slide can be easily reached in standard screen and widescreen aspect ratios. The set is also available in various formats like PDF, PNG, and JPG. So download and use it multiple times as per your knowledge.
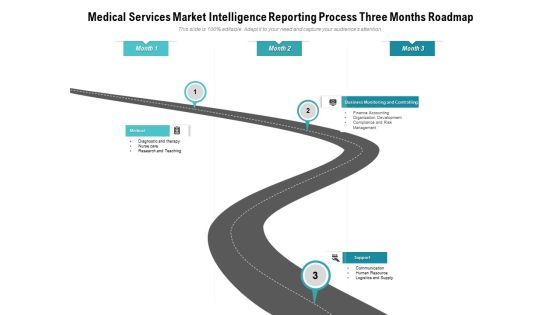
Medical Services Market Intelligence Reporting Process Three Months Roadmap Demonstration
Presenting our jaw dropping medical services market intelligence reporting process three months roadmap demonstration. You can alternate the color, font size, font type, and shapes of this PPT layout according to your strategic process. This PPT presentation is compatible with Google Slides and is available in both standard screen and widescreen aspect ratios. You can also download this well researched PowerPoint template design in different formats like PDF, JPG, and PNG. So utilize this visually appealing design by clicking the download button given below.

Predictive Data Model Why Is Predictive Analytics Important Mockup PDF
This slide depicts the importance of predictive analytics in different industries. It includes the rise of big data, using cutting-edge technologies for big data and machine learning to extract meaningful insights and increasing competition. Make sure to capture your audiences attention in your business displays with our gratis customizable Predictive Data Model Why Is Predictive Analytics Important Mockup PDF. These are great for business strategies, office conferences, capital raising or task suggestions. If you desire to acquire more customers for your tech business and ensure they stay satisfied, create your own sales presentation with these plain slides.
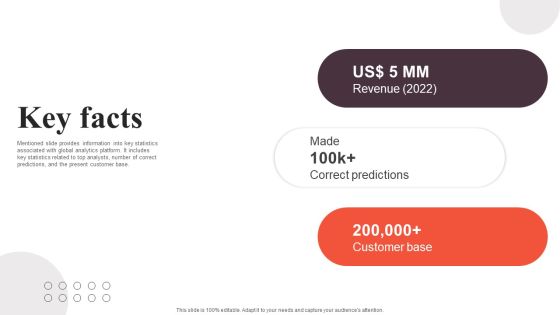
Financial Analytics Solution Investor Funding Elevator Pitch Deck Key Facts Themes PDF
Mentioned slide provides information into key statistics associated with global analytics platform. It includes key statistics related to top analysts, number of correct predictions, and the present customer base. The Financial Analytics Solution Investor Funding Elevator Pitch Deck Key Facts Themes PDF is a compilation of the most recent design trends as a series of slides. It is suitable for any subject or industry presentation, containing attractive visuals and photo spots for businesses to clearly express their messages. This template contains a variety of slides for the user to input data, such as structures to contrast two elements, bullet points, and slides for written information. Slidegeeks is prepared to create an impression.

Successful Risk Administration Top Cyber Risks Faced By The Real Estate Company Pictures PDF
The following slide exhibits four cyber risks which are faced by the real estate organization. It provides key information about the ransomware, phishing, web-based attack and email fraud attack. The Successful Risk Administration Top Cyber Risks Faced By The Real Estate Company Pictures PDF is a compilation of the most recent design trends as a series of slides. It is suitable for any subject or industry presentation, containing attractive visuals and photo spots for businesses to clearly express their messages. This template contains a variety of slides for the user to input data, such as structures to contrast two elements, bullet points, and slides for written information. Slidegeeks is prepared to create an impression.

Analyzing B2B And B2C Conversational Marketing Trends Clipart PDF
Presenting Analyzing B2B And B2C Conversational Marketing Trends Clipart PDF to provide visual cues and insights. Share and navigate important information on five stages that need your due attention. This template can be used to pitch topics like Customer Focused Data, Audio Driven Interface, Artificial Intelligence. In addtion, this PPT design contains high resolution images, graphics, etc, that are easily editable and available for immediate download.
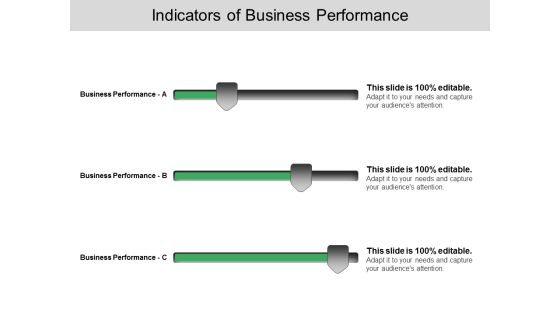
Indicators Of Busines Performance Ppt PowerPoint Presentation Infographics Influencers
This is a indicators of busines performance ppt powerpoint presentation infographics influencers. This is a three stage process. The stages in this process are cost reduction strategies.

Launching Successful Flash Sale To Attract New Customers Brochure PDF
The following slide outlines flash sale campaign through which marketers can boost the sales of various products and attract potential customers. Information covered in this slide is related to sale goals, selecting the products, creating sense of urgency, advertisement, and key metrics. The Launching Successful Flash Sale To Attract New Customers Brochure PDF is a compilation of the most recent design trends as a series of slides. It is suitable for any subject or industry presentation, containing attractive visuals and photo spots for businesses to clearly express their messages. This template contains a variety of slides for the user to input data, such as structures to contrast two elements, bullet points, and slides for written information. Slidegeeks is prepared to create an impression.

Data Lake Architecture How Does Central Repository Data Lake Works Guidelines PDF
This slide represents the working of the data lakes, including how different types of data are stored at a centralized place, extracted and performed operations on the data. Presenting Data Lake Architecture How Does Central Repository Data Lake Works Guidelines PDF to provide visual cues and insights. Share and navigate important information on six stages that need your due attention. This template can be used to pitch topics like Data Storage And Processing, Data Sources, Business Insights, Advanced Analytics, Structured Data, Unstructured Data. In addtion, this PPT design contains high resolution images, graphics, etc, that are easily editable and available for immediate download.
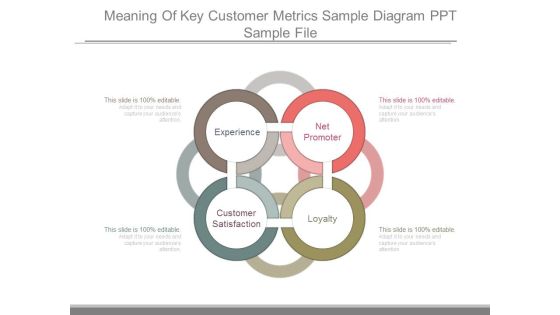
Meaning Of Key Customer Metrics Sample Diagram Ppt Sample File
This is a meaning of key customer metrics sample diagram ppt sample file. This is a four stage process. The stages in this process are net promoter, loyalty, customer satisfaction, experience.
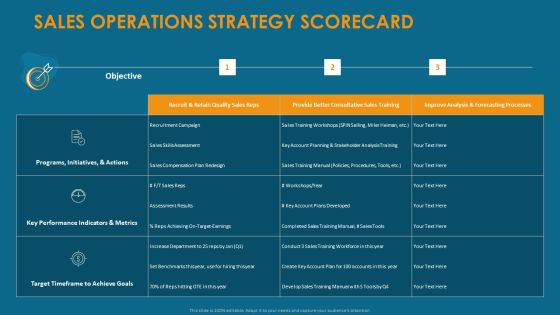
Formulating And Implementing Organization Sales Action Plan Sales Operations Strategy Scorecard Ideas PDF
Deliver an awe-inspiring pitch with this creative formulating and implementing organization sales action plan sales operations strategy scorecard ideas pdf bundle. Topics like programs, initiatives and actions, key performance indicators and metrics, target timeframe to achieve goals can be discussed with this completely editable template. It is available for immediate download depending on the needs and requirements of the user.

Industry Report Of Packaged Food Products Part 2 General Mills Marketing Strategy Product Diagrams PDF
This Industry Report Of Packaged Food Products Part 2 General Mills Marketing Strategy Product Diagrams PDF is perfect for any presentation, be it in front of clients or colleagues. It is a versatile and stylish solution for organizing your meetings. The product features a modern design for your presentation meetings. The adjustable and customizable slides provide unlimited possibilities for acing up your presentation. Slidegeeks has done all the homework before launching the product for you. So, do not wait, grab the presentation templates today

Explain Parallel Processing 9 Stages Arrow Data Diagram PowerPoint Slides
We present our explain parallel processing 9 stages arrow data diagram PowerPoint Slides.Download our Arrows PowerPoint Templates because our bewitching PowerPoint Templates and Slides will delight your audience with the magic of your words. Download our Marketing PowerPoint Templates because Our PowerPoint Templates and Slides will let your team Walk through your plans. See their energy levels rise as you show them the way. Download our Business PowerPoint Templates because You should Throw the gauntlet with our PowerPoint Templates and Slides. They are created to take up any challenge. Download and present our Signs PowerPoint Templates because You can Inspire your team with our PowerPoint Templates and Slides. Let the force of your ideas flow into their minds. Download and present our Shapes PowerPoint Templates because our PowerPoint Templates and Slides are the string of your bow. Fire of your ideas and conquer the podium.Use these PowerPoint slides for presentations relating to Advertising, Arrow, Banner, Card, Choice, Concept, Creative, Design, Direction, Flow, Illustration,Graphic, Instruction, Label, Layout, Manual, Marketing, Modern, Next, Number, Offer, Options, Paper, Pointer, Process, Product, Promotion, Sequence, Special, Step, Symbol, Tab, Tag, Template, Tutorial, Vector, Version, Website. The prominent colors used in the PowerPoint template are Brown, Green, Yellow. Customers tell us our explain parallel processing 9 stages arrow data diagram PowerPoint Slides will make you look like a winner. We assure you our Design PowerPoint templates and PPT Slides will generate and maintain the level of interest you desire. They will create the impression you want to imprint on your audience. Use our explain parallel processing 9 stages arrow data diagram PowerPoint Slides are the best it can get when it comes to presenting. You can be sure our Choice PowerPoint templates and PPT Slides are effectively colour coded to prioritise your plans They automatically highlight the sequence of events you desire. PowerPoint presentation experts tell us our explain parallel processing 9 stages arrow data diagram PowerPoint Slides are topically designed to provide an attractive backdrop to any subject. The feedback we get is that our Design PowerPoint templates and PPT Slides will make the presenter look like a pro even if they are not computer savvy.

NLP Applications Methodology Business Applications Sentiment Analysis Infographics PDF
This slide represents the sentiment analysis in NLP business applications and how online generated data is interpreted by NLP to generate useful insights. From laying roadmaps to briefing everything in detail, our templates are perfect for you. You can set the stage with your presentation slides. All you have to do is download these easy-to-edit and customizable templates. NLP Applications Methodology Business Applications Sentiment Analysis Infographics PDF will help you deliver an outstanding performance that everyone would remember and praise you for. Do download this presentation today.
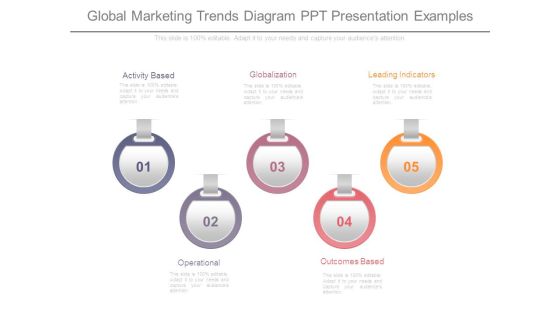
Global Marketing Trends Diagram Ppt Presentation Examples
This is a global marketing trends diagram ppt presentation examples. This is a five stage process. The stages in this process are activity based, globalization, leading indicators, outcomes based, operational.

Components Of Cost Analysis Process For E Commerce Portrait PDF
This slide showcases various elements of pricing analysis process to determine economic price for a product or service in an e-commerce industry. It includes key components like calculate price index, utilize historical price data and use pricing software. Persuade your audience using this Components Of Cost Analysis Process For E Commerce Portrait PDF. This PPT design covers three stages, thus making it a great tool to use. It also caters to a variety of topics including Calculate Price Index, Utilize Historical Price Data, Pricing Software. Download this PPT design now to present a convincing pitch that not only emphasizes the topic but also showcases your presentation skills.
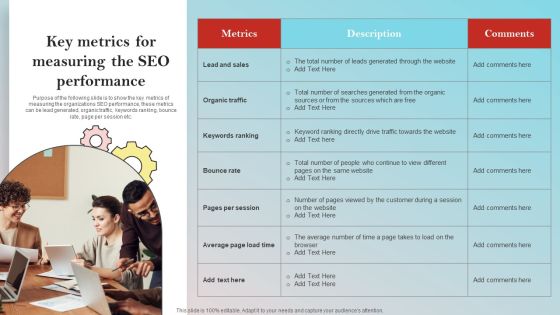
Implementing On Site Seo Strategy To Expand Customer Reach Key Metrics Measuring Seo Clipart PDF
Purpose of the following slide is to show the key metrics of measuring the organizations SEO performance, these metrics can be lead generated, organic traffic, keywords ranking, bounce rate, page per session etc. There are so many reasons you need a Implementing On Site Seo Strategy To Expand Customer Reach Key Metrics Measuring Seo Clipart PDF. The first reason is you cannot spend time making everything from scratch, Thus, Slidegeeks has made presentation templates for you too. You can easily download these templates from our website easily.

Agenda Of Kaizen Process Meeting With Preparation Work Ppt PowerPoint Presentation File Visuals PDF
This slide covers the Kaizen event meeting agenda which includes five day agenda that focuses on creating charter, identifying metrics, collecting information, data analysis, providing training, process mapping, rapid testing, implementing necessary changes, etc. Presenting Agenda Of Kaizen Process Meeting With Preparation Work Ppt PowerPoint Presentation File Visuals PDF to dispense important information. This template comprises five stages. It also presents valuable insights into the topics including Preparation Work, Conducting Rapid, Continuing Rapid Testing. This is a completely customizable PowerPoint theme that can be put to use immediately. So, download it and address the topic impactfully.
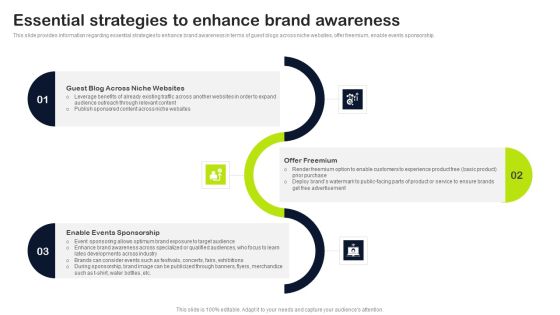
Key Elements Of Strategic Brand Administration Essential Strategies To Enhance Brand Awareness Pictures PDF
This slide provides information regarding essential strategies to enhance brand awareness in terms of guest blogs across niche websites, offer freemium, enable events sponsorship. The Key Elements Of Strategic Brand Administration Essential Strategies To Enhance Brand Awareness Pictures PDF is a compilation of the most recent design trends as a series of slides. It is suitable for any subject or industry presentation, containing attractive visuals and photo spots for businesses to clearly express their messages. This template contains a variety of slides for the user to input data, such as structures to contrast two elements, bullet points, and slides for written information. Slidegeeks is prepared to create an impression.

Food Processing Technology Industry Report And Market Analysis Brochure PDF
The following slide highlights market analysis and industry report of food technology industry recording market CAGR, market share of united states, yearly growth rate, market value, market share of several companies and advanced technology driving market growth, global food analysis etc. Pitch your topic with ease and precision using this Food Processing Technology Industry Report And Market Analysis Brochure PDF. This layout presents information on Market CAGR, Market Share Accounted, Global Food, Market Analysis. It is also available for immediate download and adjustment. So, changes can be made in the color, design, graphics or any other component to create a unique layout.
Restaurant Marketing Action Plan For Fast Food Report Infographics PDF
This slide presents an action plan report which gives a brief overview of an action plan which can lead to the achievement of specific outcomes. Key elements include objective, assigned to, action plan, end date, and outcome. Pitch your topic with ease and precision using this Restaurant Marketing Action Plan For Fast Food Report Infographics PDF. This layout presents information on Increase Social Media, Increase Customer Retention, Action Plan. It is also available for immediate download and adjustment. So, changes can be made in the color, design, graphics or any other component to create a unique layout.
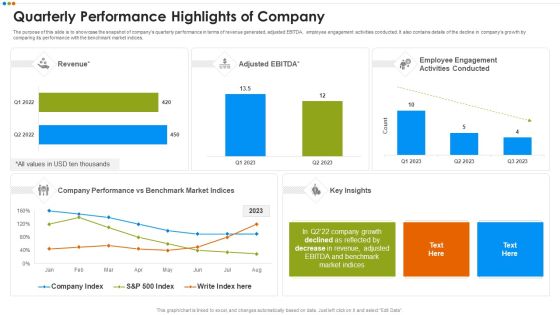
Quarterly Budget Analysis Of Business Organization Quarterly Performance Highlights Of Company Graphics PDF
The purpose of this slide is to showcase the snapshot of companys quarterly performance in terms of revenue generated, adjusted EBITDA, employee engagement activities conducted. It also contains details of the decline in companys growth by comparing its performance with the benchmark market indices.This is a Quarterly Budget Analysis Of Business Organization Quarterly Performance Highlights Of Company Graphics PDF template with various stages. Focus and dispense information on two stages using this creative set, that comes with editable features. It contains large content boxes to add your information on topics like Quarterly Performance Highlights Of Company You can also showcase facts, figures, and other relevant content using this PPT layout. Grab it now.

Predictive Data Model Outliers Model For Predictive Analytics Introduction PDF
This slide talks about the outliers model used for predictive analytics, including its use cases, impact and algorithm used in it, such as the generalized linear model for two values. This model helps banking, finance, and cyber security organizations to detect fraud and cyber crimes. Make sure to capture your audiences attention in your business displays with our gratis customizable Predictive Data Model Outliers Model For Predictive Analytics Introduction PDF. These are great for business strategies, office conferences, capital raising or task suggestions. If you desire to acquire more customers for your tech business and ensure they stay satisfied, create your own sales presentation with these plain slides.

New Brand Introduction Plan Marketing Channels With Kpis To Be Tracked Sample PDF
This template covers brand launch success tracking key performance indicators such as Engagement Likes, Comments, and Share, Followers growth, Story metrices Story Replies, Story Tap back and Forward, Story Impression etc.Are you in need of a template that can accommodate all of your creative concepts This one is crafted professionally and can be altered to fit any style. Use it with Google Slides or PowerPoint. Include striking photographs, symbols, depictions, and other visuals. Fill, move around, or remove text boxes as desired. Test out color palettes and font mixtures. Edit and save your work, or work with colleagues. Download New Brand Introduction Plan Marketing Channels With Kpis To Be Tracked Sample PDF and observe how to make your presentation outstanding. Give an impeccable presentation to your group and make your presentation unforgettable.

Data Driven Marketing Solutions Firm Company Profile Research Services Infographics PDF
The following slide highlights the research services offered by Pureprofile. It provides high-quality data insights in the form of product concept testing, customer loyalty measurement, and creative add testing This Data Driven Marketing Solutions Firm Company Profile Research Services Infographics PDF from Slidegeeks makes it easy to present information on your topic with precision. It provides customization options, so you can make changes to the colors, design, graphics, or any other component to create a unique layout. It is also available for immediate download, so you can begin using it right away. Slidegeeks has done good research to ensure that you have everything you need to make your presentation stand out. Make a name out there for a brilliant performance.
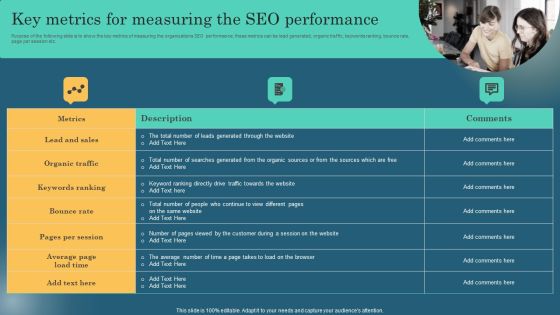
Key Metrics For Measuring The SEO Performance Clipart PDF
Purpose of the following slide is to show the key metrics of measuring the organizations SEO performance, these metrics can be lead generated, organic traffic, keywords ranking, bounce rate, page per session etc. Create an editable Key Metrics For Measuring The SEO Performance Clipart PDF that communicates your idea and engages your audience. Whether you are presenting a business or an educational presentation, pre designed presentation templates help save time. Key Metrics For Measuring The SEO Performance Clipart PDF is highly customizable and very easy to edit, covering many different styles from creative to business presentations. Slidegeeks has creative team members who have crafted amazing templates. So, go and get them without any delay.

Registrants And Attendees KPIS To Track Success Of Event Stakeholder Engagement Plan For Launch Event Icons PDF
This slide provides an overview of attendee related key metrics. The indicators covered are number of total registrants, attendee retention, turnout percentage, pageviews on microsite and device usage. Whether you have daily or monthly meetings, a brilliant presentation is necessary. Registrants And Attendees KPIS To Track Success Of Event Stakeholder Engagement Plan For Launch Event Icons PDF can be your best option for delivering a presentation. Represent everything in detail using Registrants And Attendees KPIS To Track Success Of Event Stakeholder Engagement Plan For Launch Event Icons PDF and make yourself stand out in meetings. The template is versatile and follows a structure that will cater to your requirements. All the templates prepared by Slidegeeks are easy to download and edit. Our research experts have taken care of the corporate themes as well. So, give it a try and see the results.
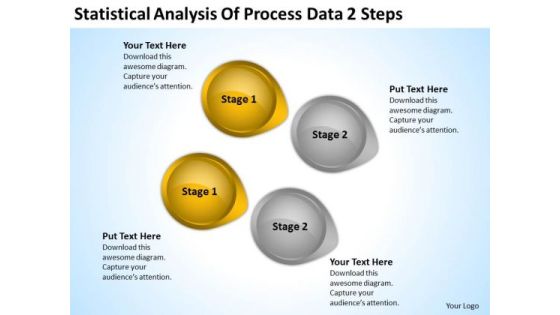
Levels Of Parallel Processing Data 2 Steps Ppt PowerPoint Templates Backgrounds For Slides
We present our levels of parallel processing data 2 steps ppt PowerPoint templates backgrounds for slides.Download and present our Business PowerPoint Templates because Our PowerPoint Templates and Slides will embellish your thoughts. See them provide the desired motivation to your team. Present our Circle Charts PowerPoint Templates because Our PowerPoint Templates and Slides offer you the needful to organise your thoughts. Use them to list out your views in a logical sequence. Download and present our Arrows PowerPoint Templates because Our PowerPoint Templates and Slides provide you with a vast range of viable options. Select the appropriate ones and just fill in your text. Present our Shapes PowerPoint Templates because Our PowerPoint Templates and Slides team portray an attitude of elegance. Personify this quality by using them regularly. Use our Signs PowerPoint Templates because Our PowerPoint Templates and Slides offer you the needful to organise your thoughts. Use them to list out your views in a logical sequence.Use these PowerPoint slides for presentations relating to 3d, abstract, analysis, arrow, background, business, button, chart, circle, circular, color, concept, conservation, cycle, development, diagram, direction, eco, ecology, energy, environment, flow, flowchart, globe, graphic, growing, growth, icon, internet, isolated, object, power, process, protection, recyclable, recycle, recycling, render, resource, saving, sign, solution, sphere, statistic, sustainable, symbol, technology, white. The prominent colors used in the PowerPoint template are Brown, Gray, Black. You can be sure our levels of parallel processing data 2 steps ppt PowerPoint templates backgrounds for slides look good visually. People tell us our analysis PowerPoint templates and PPT Slides are specially created by a professional team with vast experience. They diligently strive to come up with the right vehicle for your brilliant Ideas. You can be sure our levels of parallel processing data 2 steps ppt PowerPoint templates backgrounds for slides will impress their bosses and teams. Use our chart PowerPoint templates and PPT Slides are the best it can get when it comes to presenting. Presenters tell us our levels of parallel processing data 2 steps ppt PowerPoint templates backgrounds for slides look good visually. We assure you our chart PowerPoint templates and PPT Slides are topically designed to provide an attractive backdrop to any subject.

Apple Emotional Marketing Strategy Role Of Neuromarketing In Emotional Branding Summary PDF
This slide showcases role of neuromarketing concept in preparing emotional branding strategies. It provides details about statistics, brand experiences, subconscious purchase, individual responses, scientific technologies, cognitive, eye tracking, facial coding, etc. The Apple Emotional Marketing Strategy Role Of Neuromarketing In Emotional Branding Summary PDF is a compilation of the most recent design trends as a series of slides. It is suitable for any subject or industry presentation, containing attractive visuals and photo spots for businesses to clearly express their messages. This template contains a variety of slides for the user to input data, such as structures to contrast two elements, bullet points, and slides for written information. Slidegeeks is prepared to create an impression.
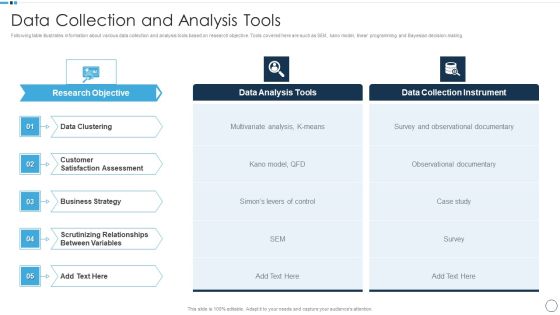
QA Plan Set 1 Data Collection And Analysis Tools Infographics PDF
Presenting QA Plan Set 1 Data Collection And Analysis Tools Infographics PDF to provide visual cues and insights. Share and navigate important information on five stages that need your due attention. This template can be used to pitch topics like Data Clustering, Business Strategy, Customer Satisfaction Assessment. In addtion, this PPT design contains high resolution images, graphics, etc, that are easily editable and available for immediate download.

Redefining IT Solutions Delivery In A Post Pandemic Kpis For Financial Service Delivery Mockup PDF
This slide represents the KPIs for financial service delivery and how machine learning and AI can help to foresee the processes, insights that can benefit the financial sector. Are you in need of a template that can accommodate all of your creative concepts. This one is crafted professionally and can be altered to fit any style. Use it with Google Slides or PowerPoint. Include striking photographs, symbols, depictions, and other visuals. Fill, move around, or remove text boxes as desired. Test out color palettes and font mixtures. Edit and save your work, or work with colleagues. Download Redefining IT Solutions Delivery In A Post Pandemic Kpis For Financial Service Delivery Mockup PDF and observe how to make your presentation outstanding. Give an impeccable presentation to your group and make your presentation unforgettable.
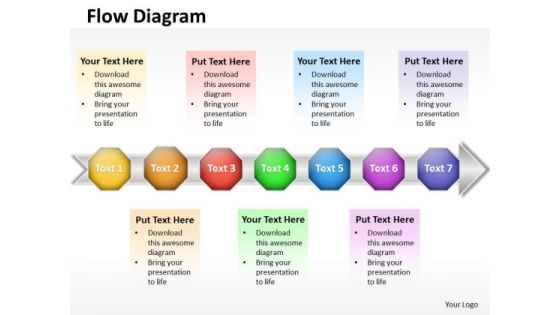
Ppt 7 Sequential Stages New Business PowerPoint Presentation Data Flow Diagram Templates
PPT 7 sequential stages new business PowerPoint presentation data flow diagram Templates-This PowerPoint Diagram shows you the Homogeneous Abstraction of seven approaches on the Arrow. It shows the successive concepts used in a procedure. This diagram will fit for Business Presentations. -PPT 7 sequential stages new business PowerPoint presentation data flow diagram Templates-arrow, art, assess, blue, business, chart, chevron, clip, clipart, colorful, compliance, corporate, design, development, diagram, flow, glossy, graphic, hierarchy, icon, illustration, implement, info graphic, levels, marketing, modern, plan, process, shape, shiny, square, stages, vector

Kpis For Customer Satisfaction Survey Outcome Formats PDF
This slide outlines strategies that can help organization to improve the customer service KPIs which are net promoter score, average resolution time, customer satisfaction score and average response time . It also showcases result before and after the implementation of improvement tactics. Persuade your audience using this Kpis For Customer Satisfaction Survey Outcome Formats PDF. This PPT design covers four stages, thus making it a great tool to use. It also caters to a variety of topics including Improvement Strategy, Results Before Implementation, Results After Implementation. Download this PPT design now to present a convincing pitch that not only emphasizes the topic but also showcases your presentation skills.

Comprehensive Customer Data Platform Guide For Optimizing Promotionaliniti Table Of Contents Sample PDF
Present like a pro with Comprehensive Customer Data Platform Guide For Optimizing Promotionaliniti Table Of Contents Sample PDF Create beautiful presentations together with your team, using our easy to use presentation slides. Share your ideas in real time and make changes on the fly by downloading our templates. So whether you are in the office, on the go, or in a remote location, you can stay in sync with your team and present your ideas with confidence. With Slidegeeks presentation got a whole lot easier. Grab these presentations today.

Guide To Healthcare Services Administration Identifying The Healthcare Outsourcing Services Designs PDF
The following slide showcases different type of healthcare services which can be outsourced from external vendor. Information covered in this slide is related to medical billing support, medical coding, medical animation services etc. The Guide To Healthcare Services Administration Identifying The Healthcare Outsourcing Services Designs PDF is a compilation of the most recent design trends as a series of slides. It is suitable for any subject or industry presentation, containing attractive visuals and photo spots for businesses to clearly express their messages. This template contains a variety of slides for the user to input data, such as structures to contrast two elements, bullet points, and slides for written information. Slidegeeks is prepared to create an impression.
Tracking Kpis To Measure Product Launch Success Launching New Beverage Product Download PDF
The following slide outlines various key performance indicators KPIs which can be used to analyze the product launch success. The KPIs are net promotor score NPS, user retention, sales growth rate, market share, average revenue per customer and website traffic growth rate.This modern and well-arranged Tracking Kpis To Measure Product Launch Success Launching New Beverage Product Download PDF provides lots of creative possibilities. It is very simple to customize and edit with the Powerpoint Software. Just drag and drop your pictures into the shapes. All facets of this template can be edited with Powerpoint no extra software is necessary. Add your own material, put your images in the places assigned for them, adjust the colors, and then you can show your slides to the world, with an animated slide included.

 Home
Home