Order Management Dashboard
Improving Buyer Journey Through Strategic Customer Engagement Social Media Engagement Tracking Dashboard Structure PDF
This slide showcases a dashboard highlighting the customer engagement through social sites. it includes KPIs such as total website traffics, site revenue, fans count and followers Find highly impressive Improving Buyer Journey Through Strategic Customer Engagement Social Media Engagement Tracking Dashboard Structure PDF on Slidegeeks to deliver a meaningful presentation. You can save an ample amount of time using these presentation templates. No need to worry to prepare everything from scratch because Slidegeeks experts have already done a huge research and work for you. You need to download Improving Buyer Journey Through Strategic Customer Engagement Social Media Engagement Tracking Dashboard Structure PDF for your upcoming presentation. All the presentation templates are 100 percent editable and you can change the color and personalize the content accordingly. Download now
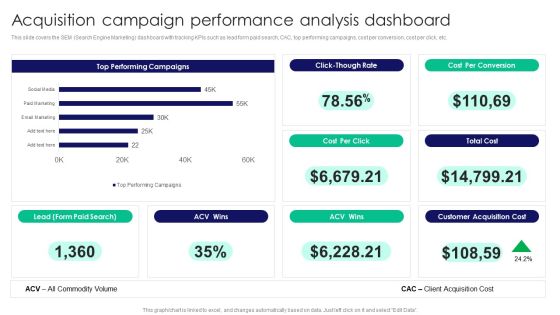
Guide To Business Customer Acquisition Acquisition Campaign Performance Analysis Dashboard Rules PDF
This slide covers the SEM Search Engine Marketing dashboard with tracking KPIs such as lead form paid search, CAC, top performing campaigns, cost per conversion, cost per click, etc. If you are looking for a format to display your unique thoughts, then the professionally designed Guide To Business Customer Acquisition Acquisition Campaign Performance Analysis Dashboard Rules PDF is the one for you. You can use it as a Google Slides template or a PowerPoint template. Incorporate impressive visuals, symbols, images, and other charts. Modify or reorganize the text boxes as you desire. Experiment with shade schemes and font pairings. Alter, share or cooperate with other people on your work. Download Guide To Business Customer Acquisition Acquisition Campaign Performance Analysis Dashboard Rules PDF and find out how to give a successful presentation. Present a perfect display to your team and make your presentation unforgettable.

Formulating Branding Strategy To Enhance Revenue And Sales Dashboard Showing Performance Of Various Graphics PDF
The following slide outlines the key performance indicator dashboard used by the organization to evaluate the effectiveness of multiple marketing campaigns. It provides information about total spending, impressions, acquisitions, cost per acquisition, clicks, etc. Create an editable Formulating Branding Strategy To Enhance Revenue And Sales Dashboard Showing Performance Of Various Graphics PDF that communicates your idea and engages your audience. Whether youre presenting a business or an educational presentation, pre designed presentation templates help save time. Formulating Branding Strategy To Enhance Revenue And Sales Dashboard Showing Performance Of Various Graphics PDF is highly customizable and very easy to edit, covering many different styles from creative to business presentations. Slidegeeks has creative team members who have crafted amazing templates. So, go and get them without any delay.

Tactical Employee Engagement Action Planning Employee Engagement Satisfaction Kpi Dashboard Sample PDF
The following slide showcases employee engagement and satisfaction key performance indicators to encourage healthy team relationships. It includes key elements such as net promotor score, retention and absenteeism rate etc. Presenting this PowerPoint presentation, titled Tactical Employee Engagement Action Planning Employee Engagement Satisfaction Kpi Dashboard Sample PDF, with topics curated by our researchers after extensive research. This editable presentation is available for immediate download and provides attractive features when used. Download now and captivate your audience. Presenting this Tactical Employee Engagement Action Planning Employee Engagement Satisfaction Kpi Dashboard Sample PDF. Our researchers have carefully researched and created these slides with all aspects taken into consideration. This is a completely customizable Tactical Employee Engagement Action Planning Employee Engagement Satisfaction Kpi Dashboard Sample PDF that is available for immediate downloading. Download now and make an impact on your audience. Highlight the attractive features available with our PPTs.

Customer Segmentation Dashboard To Monitor Results Ppt PowerPoint Presentation File Deck PDF
The following slide showcases a dashboard to monitor customer segmentation based on similar traits and characteristics. It highlights elements such as total customer in each segments, segments description, segment characteristics and search customer by ID. Formulating a presentation can take up a lot of effort and time, so the content and message should always be the primary focus. The visuals of the PowerPoint can enhance the presenters message, so our Customer Segmentation Dashboard To Monitor Results Ppt PowerPoint Presentation File Deck PDF was created to help save time. Instead of worrying about the design, the presenter can concentrate on the message while our designers work on creating the ideal templates for whatever situation is needed. Slidegeeks has experts for everything from amazing designs to valuable content, we have put everything into Customer Segmentation Dashboard To Monitor Results Ppt PowerPoint Presentation File Deck PDF.

Action Plan To Enhance Dashboard Depicting Metrics To Measure Customer Icons PDF
This slide shows dashboard that depicts metrics to measure customer experience that covers net revenue, customer retention, abandonment, unique visitors, etc. Find highly impressive Action Plan To Enhance Dashboard Depicting Metrics To Measure Customer Icons PDF on Slidegeeks to deliver a meaningful presentation. You can save an ample amount of time using these presentation templates. No need to worry to prepare everything from scratch because Slidegeeks experts have already done a huge research and work for you. You need to download Action Plan To Enhance Dashboard Depicting Metrics To Measure Customer Icons PDF for your upcoming presentation. All the presentation templates are 100 percent editable and you can change the color and personalize the content accordingly. Download now
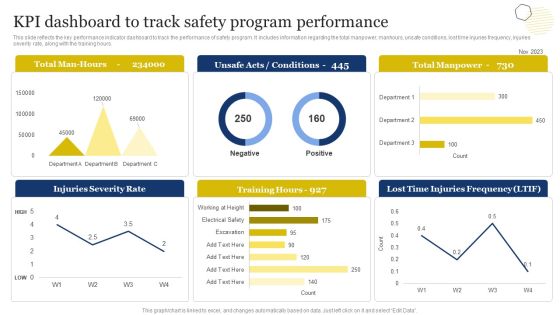
Improvement Of Safety Performance At Construction Site Kpi Dashboard To Track Safety Program Microsoft PDF
This slide reflects the key performance indicator dashboard to track the performance of safety program. It includes information regarding the total manpower, manhours, unsafe conditions, lost time injuries frequency, injuries severity rate, along with the training hours. Make sure to capture your audiences attention in your business displays with our gratis customizable Improvement Of Safety Performance At Construction Site Kpi Dashboard To Track Safety Program Microsoft PDF. These are great for business strategies, office conferences, capital raising or task suggestions. If you desire to acquire more customers for your tech business and ensure they stay satisfied, create your own sales presentation with these plain slides.

Direct Marketing Techniques To Enhance Business Presence Social Media Marketing Dashboard To Evaluate Rules PDF
The purpose of this slide is to highlight key performance indicator KPI dashboard which will assist marketers to analyze company performance across social media platforms. The kpis outlined in slide are social media followers, page likes, etc. Make sure to capture your audiences attention in your business displays with our gratis customizable Direct Marketing Techniques To Enhance Business Presence Social Media Marketing Dashboard To Evaluate Rules PDF. These are great for business strategies, office conferences, capital raising or task suggestions. If you desire to acquire more customers for your tech business and ensure they stay satisfied, create your own sales presentation with these plain slides.
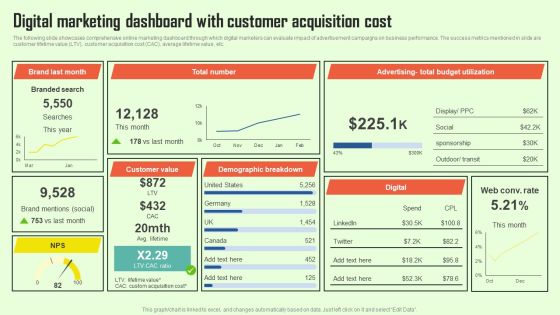
Increasing Consumer Engagement With Database Digital Marketing Dashboard With Customer Infographics PDF
The following slide showcases comprehensive online marketing dashboard through which digital marketers can evaluate impact of advertisement campaigns on business performance. The success metrics mentioned in slide are customer lifetime value LTV, customer acquisition cost CAC, average lifetime value, etc. Make sure to capture your audiences attention in your business displays with our gratis customizable Increasing Consumer Engagement With Database Digital Marketing Dashboard With Customer Infographics PDF. These are great for business strategies, office conferences, capital raising or task suggestions. If you desire to acquire more customers for your tech business and ensure they stay satisfied, create your own sales presentation with these plain slides.

Increasing Consumer Engagement With Database Dashboard To Evaluate Targeted Social Media Portrait PDF
The purpose of this slide is to outline a comprehensive dashboard through which marketers can analyze effectiveness of targeted social media campaign performance. The key performance indicators KPIs are social media followers, LinkedIn key metrics, page likes, page impressions, etc. If you are looking for a format to display your unique thoughts, then the professionally designed Increasing Consumer Engagement With Database Dashboard To Evaluate Targeted Social Media Portrait PDF is the one for you. You can use it as a Google Slides template or a PowerPoint template. Incorporate impressive visuals, symbols, images, and other charts. Modify or reorganize the text boxes as you desire. Experiment with shade schemes and font pairings. Alter, share or cooperate with other people on your work. Download Increasing Consumer Engagement With Database Dashboard To Evaluate Targeted Social Media Portrait PDF and find out how to give a successful presentation. Present a perfect display to your team and make your presentation unforgettable.

Customer Centric Success KPIS Dashboard Ppt PowerPoint Presentation Styles Example File PDF
This slide covers dashboard for customer oriented success metrics. It includes KPIs such as net promoter score, customer loyalty rate, premium users, customer lifetime value, customer and revenue churn rates, MRR growth and net retention rates, etc. Showcasing this set of slides titled Customer Centric Success KPIS Dashboard Ppt PowerPoint Presentation Styles Example File PDF. The topics addressed in these templates are New Retention, Customer Churn, Revenue Churn. All the content presented in this PPT design is completely editable. Download it and make adjustments in color, background, font etc. as per your unique business setting.

KPI Dashboard To Analyze In Store Merchandising Strategy Performance Introduction PDF
The following slide outlines a performance key performance indicator KPI dashboard used to evaluate the effectiveness of in-store merchandising strategy. The KPIs covered in the slide are total sales, average inventory, active stores, distinct products sold, etc. Formulating a presentation can take up a lot of effort and time, so the content and message should always be the primary focus. The visuals of the PowerPoint can enhance the presenters message, so our KPI Dashboard To Analyze In Store Merchandising Strategy Performance Introduction PDF was created to help save time. Instead of worrying about the design, the presenter can concentrate on the message while our designers work on creating the ideal templates for whatever situation is needed. Slidegeeks has experts for everything from amazing designs to valuable content, we have put everything into KPI Dashboard To Analyze In Store Merchandising Strategy Performance Introduction PDF.
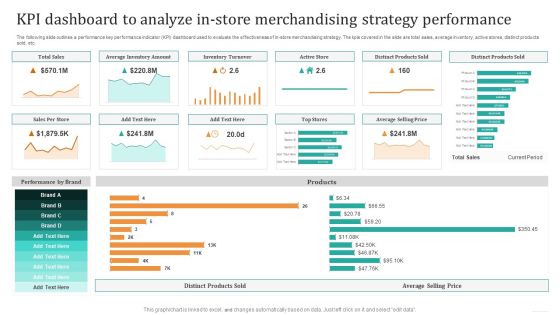
KPI Dashboard To Analyze In Store Merchandising Strategy Performance Pictures PDF
The following slide outlines a performance key performance indicator KPI dashboard used to evaluate the effectiveness of in-store merchandising strategy. The KPIs covered in the slide are total sales, average inventory, active stores, distinct products sold, etc. Formulating a presentation can take up a lot of effort and time, so the content and message should always be the primary focus. The visuals of the PowerPoint can enhance the presenters message, so our KPI Dashboard To Analyze In Store Merchandising Strategy Performance Pictures PDF was created to help save time. Instead of worrying about the design, the presenter can concentrate on the message while our designers work on creating the ideal templates for whatever situation is needed. Slidegeeks has experts for everything from amazing designs to valuable content, we have put everything into KPI Dashboard To Analyze In Store Merchandising Strategy Performance Pictures PDF.
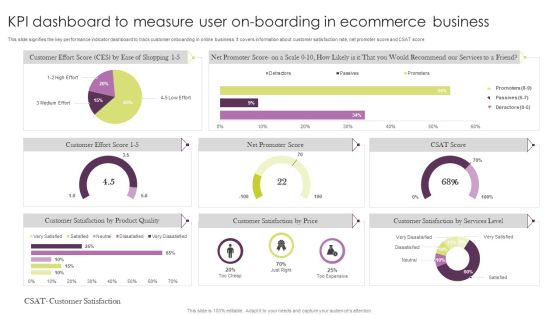
KPI Dashboard To Measure User On Boarding In Ecommerce Business Microsoft PDF
This slide signifies the key performance indicator dashboard to track customer onboarding in online business. It covers information about customer satisfaction rate, net promoter score and CSAT score. Showcasing this set of slides titled KPI Dashboard To Measure User On Boarding In Ecommerce Business Microsoft PDF. The topics addressed in these templates are User Boarding Icon, Develop Ecommerce Business. All the content presented in this PPT design is completely editable. Download it and make adjustments in color, background, font etc. as per your unique business setting.
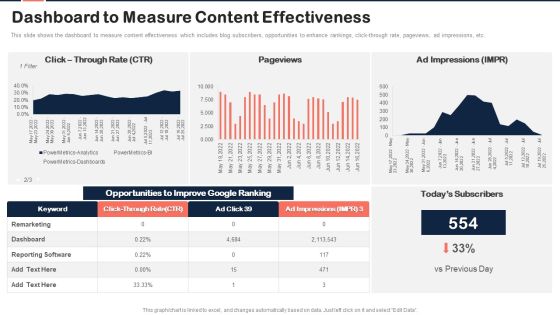
Implementing Content Marketing Plan To Nurture Leads Dashboard To Measure Content Effectiveness Summary PDF
This slide shows the dashboard to measure content effectiveness which includes blog subscribers, opportunities to enhance rankings, click through rate, pageviews, ad impressions, etc. Make sure to capture your audiences attention in your business displays with our gratis customizable Implementing Content Marketing Plan To Nurture Leads Dashboard To Measure Content Effectiveness Summary PDF. These are great for business strategies, office conferences, capital raising or task suggestions. If you desire to acquire more customers for your tech business and ensure they stay satisfied, create your own sales presentation with these plain slides.

Critical Initiatives To Deploy Product And Customer Performance Tracking Dashboard Guidelines PDF
This slide provides information regarding dashboard utilized by firm to monitor performance of products offered and customer associated. The performance is tracked through revenues generated, new customer acquired, customer satisfaction, sales comparison, etc. Do you have an important presentation coming up Are you looking for something that will make your presentation stand out from the rest Look no further than Critical Initiatives To Deploy Product And Customer Performance Tracking Dashboard Guidelines PDF. With our professional designs, you can trust that your presentation will pop and make delivering it a smooth process. And with Slidegeeks, you can trust that your presentation will be unique and memorable. So why wait Grab Critical Initiatives To Deploy Product And Customer Performance Tracking Dashboard Guidelines PDF today and make your presentation stand out from the rest.

Deploying XP Practices To Enhance Operational Efficiency Dashboard For Extreme Programming Infographics PDF
This slide depicts the dashboard for XP implementation in the business by covering details of planning, design, development and testing. Welcome to our selection of theDeploying XP Practices To Enhance Operational Efficiency Dashboard For Extreme Programming Infographics PDF. These are designed to help you showcase your creativity and bring your sphere to life. Planning and Innovation are essential for any business that is just starting out. This collection contains the designs that you need for your everyday presentations. All of our PowerPoints are 100 Precent editable, so you can customize them to suit your needs. This multi-purpose template can be used in various situations. Grab these presentation templates today.

Comprehensive Guide To Build Marketing Digital Marketing Dashboard With Customer Acquisition Diagrams PDF
The following slide showcases comprehensive online marketing dashboard through which digital marketers can evaluate impact of advertisement campaigns on business performance. The success metrics mentioned in slide are customer lifetime value LTV, customer acquisition cost CAC, average lifetime value, etc. Do you have an important presentation coming up Are you looking for something that will make your presentation stand out from the rest Look no further than Comprehensive Guide To Build Marketing Digital Marketing Dashboard With Customer Acquisition Diagrams PDF. With our professional designs, you can trust that your presentation will pop and make delivering it a smooth process. And with Slidegeeks, you can trust that your presentation will be unique and memorable. So why wait Grab Comprehensive Guide To Build Marketing Digital Marketing Dashboard With Customer Acquisition Diagrams PDF today and make your presentation stand out from the rest.
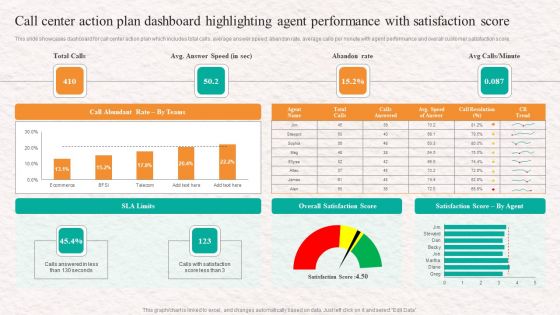
Call Center Action Plan Dashboard Highlighting Customer Service Agent Performance Elements PDF
This slide showcases dashboard for call center action plan which includes total calls, average answer speed, abandon rate, average calls per minute with agent performance and overall customer satisfaction score. Boost your pitch with our creative Call Center Action Plan Dashboard Highlighting Customer Service Agent Performance Elements PDF. Deliver an awe-inspiring pitch that will mesmerize everyone. Using these presentation templates you will surely catch everyones attention. You can browse the ppts collection on our website. We have researchers who are experts at creating the right content for the templates. So you dont have to invest time in any additional work. Just grab the template now and use them.

Customer Segmentation Dashboard For Market Research Ppt PowerPoint Presentation File Professional PDF
The following slide presents a customer segmentation dashboard distributing customers on demographics basis. It includes key components such as gender, technology adoption lifecycle, education and brand innovation consent. Make sure to capture your audiences attention in your business displays with our gratis customizable Customer Segmentation Dashboard For Market Research Ppt PowerPoint Presentation File Professional PDF. These are great for business strategies, office conferences, capital raising or task suggestions. If you desire to acquire more customers for your tech business and ensure they stay satisfied, create your own sales presentation with these plain slides.

KPI Dashboard To Analyze Performance Of Healthcare Financial Department Summary PDF
The following slide showcases key performance indicator KPI dashboard which can be used to analyze the financial performance of hospital. The metrics covered in the slide are net profit margin, income and expenses, etc. Do you have an important presentation coming up Are you looking for something that will make your presentation stand out from the rest Look no further than KPI Dashboard To Analyze Performance Of Healthcare Financial Department Summary PDF. With our professional designs, you can trust that your presentation will pop and make delivering it a smooth process. And with Slidegeeks, you can trust that your presentation will be unique and memorable. So why wait Grab KPI Dashboard To Analyze Performance Of Healthcare Financial Department Summary PDF today and make your presentation stand out from the rest.

Deploy Merchandise Program To Enhance Sales Dashboard Depicting Sales And Customer Analytics Sample PDF
This slide focuses on dashboard that depicts sales and customer analytics which covers sales revenue, average transaction rate, out of stock items, sales by division, monthly visitors, etc. Make sure to capture your audiences attention in your business displays with our gratis customizable Deploy Merchandise Program To Enhance Sales Dashboard Depicting Sales And Customer Analytics Sample PDF. These are great for business strategies, office conferences, capital raising or task suggestions. If you desire to acquire more customers for your tech business and ensure they stay satisfied, create your own sales presentation with these plain slides.

Customer Acquiring Price For Retaining New Clients Client Acquisition Cost Measurement Dashboard Ideas PDF
This slide shows a Client Acquisition Cost CAC Measurement Dashboard with details such as total customers, employee satisfaction rate, number of trials, monthly active users, NPS net promoter score etc. Deliver an awe inspiring pitch with this creative customer acquiring price for retaining new clients client acquisition cost measurement dashboard ideas pdf bundle. Topics like nps score, sales expenses, revenue ytd, total customers can be discussed with this completely editable template. It is available for immediate download depending on the needs and requirements of the user.
Developing Brand Awareness To Gain Customer Attention Different Brands Performance Tracking Dashboard Introduction PDF
This slide provides information regarding different brands performance tracking dashboard in terms of brand metric, brand commitment, advertising metrics, and purchase metrics. Make sure to capture your audiences attention in your business displays with our gratis customizable Developing Brand Awareness To Gain Customer Attention Different Brands Performance Tracking Dashboard Introduction PDF. These are great for business strategies, office conferences, capital raising or task suggestions. If you desire to acquire more customers for your tech business and ensure they stay satisfied, create your own sales presentation with these plain slides.

Customer NPS Metric Dashboard For Call Centers Ppt Inspiration Smartart PDF
This slide shows net promoter score dashboard for call centers which contains occupancy rate, tickets unassigned, opened tickets, completed tickets and raised tickets. It also has details on resolution rate on first call, enquiries, etc. Pitch your topic with ease and precision using this Customer NPS Metric Dashboard For Call Centers Ppt Inspiration Smartart PDF. This layout presents information on Occupancy Rate, Resolution Rate, Net Promoter Score. It is also available for immediate download and adjustment. So, changes can be made in the color, design, graphics or any other component to create a unique layout.

Customer Service Metrics Dashboard With Average First Response Time Background PDF
This slide showcases Dashboard for Customer Service metrics that can help organization to easily identify the key pain points of your customers, areas which need additional resources and support agents that can benefit from additional training. It also showcases performance of top and bottom 5 call support agents. Pitch your topic with ease and precision using this Customer Service Metrics Dashboard With Average First Response Time Background PDF. This layout presents information on Average, Abandon Rate, Contact Resolution. It is also available for immediate download and adjustment. So, changes can be made in the color, design, graphics or any other component to create a unique layout.

Dashboard For Measuring Product Sales Performance Multi Brand Promotion Campaign For Customer Engagement Professional PDF
This slide showcases dashboard that can help organization to measure product sales performance after dual branding campaign. Its key components are sales, sales target, gross profit, sales by channel, inventory days outstanding, sales growth etc From laying roadmaps to briefing everything in detail, our templates are perfect for you. You can set the stage with your presentation slides. All you have to do is download these easy to edit and customizable templates. Dashboard For Measuring Product Sales Performance Multi Brand Promotion Campaign For Customer Engagement Professional PDF will help you deliver an outstanding performance that everyone would remember and praise you for. Do download this presentation today.
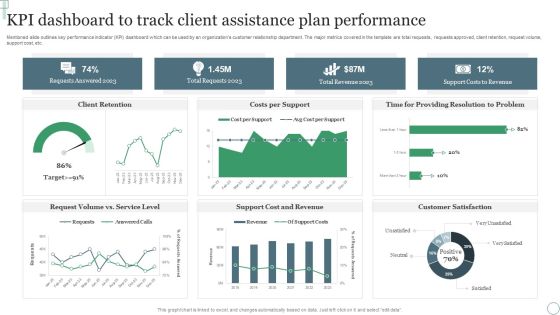
KPI Dashboard To Track Client Assistance Plan Performance Ppt Professional Outfit PDF
Mentioned slide outlines key performance indicator KPI dashboard which can be used by an organizations customer relationship department. The major metrics covered in the template are total requests, requests approved, client retention, request volume, support cost, etc. Pitch your topic with ease and precision using this KPI Dashboard To Track Client Assistance Plan Performance Ppt Professional Outfit PDF. This layout presents information on Requests Answered 2023, Total Requests 2023, Total Revenue 2023. It is also available for immediate download and adjustment. So, changes can be made in the color, design, graphics or any other component to create a unique layout.

Introducing AI Tools KPI Metrics Dashboard To Measure Automation Performance Formats PDF
The following slide outlines a comprehensive KPI dashboard which can be used by the organization to measure the automation performance in customer support department. It covers KPIs such as customer retention, costs per support, customer satisfaction, etc. This Introducing AI Tools KPI Metrics Dashboard To Measure Automation Performance Formats PDF is perfect for any presentation, be it in front of clients or colleagues. It is a versatile and stylish solution for organizing your meetings. The Introducing AI Tools KPI Metrics Dashboard To Measure Automation Performance Formats PDF features a modern design for your presentation meetings. The adjustable and customizable slides provide unlimited possibilities for acing up your presentation. Slidegeeks has done all the homework before launching the product for you. So, dont wait, grab the presentation templates today.

Dashboard For Analyzing Brand Perception Executing Brand Communication Strategy Summary PDF
This slide covers the dashboard for tracking brand reputation. It also includes metrics such as new customer lifetime value, customer acquisition cost, target met, above sales target, average weekly sales revenue, etc. The best PPT templates are a great way to save time, energy, and resources. Slidegeeks have 100parcent editable powerpoint slides making them incredibly versatile. With these quality presentation templates, you can create a captivating and memorable presentation by combining visually appealing slides and effectively communicating your message. Download Dashboard For Analyzing Brand Perception Executing Brand Communication Strategy Summary PDF from Slidegeeks and deliver a wonderful presentation.
Planning Transnational Technique To Improve International Scope Dashboard For Tracking Post Expansion Sales Introduction PDF
This slide covers the dashboard for analyzing fast food business sales by region. It includes KPIs such as sales, sales target, target achievement, gross profit, gross profit margin, sales by channels, sales growth, etc. Find highly impressive Planning Transnational Technique To Improve International Scope Dashboard For Tracking Post Expansion Sales Introduction PDF on Slidegeeks to deliver a meaningful presentation. You can save an ample amount of time using these presentation templates. No need to worry to prepare everything from scratch because Slidegeeks experts have already done a huge research and work for you. You need to download Planning Transnational Technique To Improve International Scope Dashboard For Tracking Post Expansion Sales Introduction PDF for your upcoming presentation. All the presentation templates are 100 percent editable and you can change the color and personalize the content accordingly. Download now.

Dashboard Showing Key Performance Indicators Of Recruitment Ppt PowerPoint Presentation File Background Image PDF
Presenting this set of slides with name dashboard showing key performance indicators of recruitment ppt powerpoint presentation file background image pdf. The topics discussed in these slides are executive, funnel, department. This is a completely editable PowerPoint presentation and is available for immediate download. Download now and impress your audience.

Lead Nurturing Tactics For Lead Generation Dashboard To Measure Content Effectiveness Introduction PDF
This slide shows the dashboard to measure content effectiveness which includes blog subscribers, opportunities to enhance rankings, click-through rate, pageviews, ad impressions, etc. Do you have an important presentation coming up Are you looking for something that will make your presentation stand out from the rest Look no further than Lead Nurturing Tactics For Lead Generation Dashboard To Measure Content Effectiveness Introduction PDF. With our professional designs, you can trust that your presentation will pop and make delivering it a smooth process. And with Slidegeeks, you can trust that your presentation will be unique and memorable. So why wait Grab Lead Nurturing Tactics For Lead Generation Dashboard To Measure Content Effectiveness Introduction PDF today and make your presentation stand out from the rest.
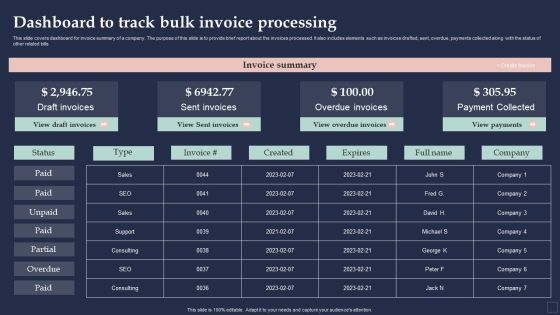
BPM System Methodology Dashboard To Track Bulk Invoice Processing Download PDF
This slide covers dashboard for invoice summary of a company. The purpose of this slide is to provide brief report about the invoices processed. It also includes elements such as invoices drafted, sent, overdue, payments collected along with the status of other related bills. Make sure to capture your audiences attention in your business displays with our gratis customizable BPM System Methodology Dashboard To Track Bulk Invoice Processing Download PDF. These are great for business strategies, office conferences, capital raising or task suggestions. If you desire to acquire more customers for your tech business and ensure they stay satisfied, create your own sales presentation with these plain slides.

Dashboard For Tracking Employee Satisfaction Rate Ppt PowerPoint Presentation File Backgrounds PDF
This slide covers KPI dashboard to measure employee satisfaction due to effective internal communication. It includes indicators such as net promoter score, retention rate, absenteeism etc. From laying roadmaps to briefing everything in detail, our templates are perfect for you. You can set the stage with your presentation slides. All you have to do is download these easy to edit and customizable templates. Dashboard For Tracking Employee Satisfaction Rate Ppt PowerPoint Presentation File Backgrounds PDF will help you deliver an outstanding performance that everyone would remember and praise you for. Do download this presentation today.

KPI Dashboard To Track Sales And Operations Process Of Manufacturing Enterprise Brochure PDF
This slide depicts a dashboard to track the key performance metrics in sales and operations process of a manufacturing enterprise to analyze deviations in the actual and planned output. The key performing indicators are percentage deviation, dollar deviation, inventory in hand etc.Pitch your topic with ease and precision using this KPI Dashboard To Track Sales And Operations Process Of Manufacturing Enterprise Brochure PDF. This layout presents information on Planned Output, Yearly Growth, Inventory Hand. It is also available for immediate download and adjustment. So, changes can be made in the color, design, graphics or any other component to create a unique layout.

Sustainability Calculation With KPI Customer Service Dashboard Revenue Ideas PDF Graphics PDF
Following slide illustrates customer service dashboard covering details such as request answered, total requests, total revenue and support cost revenue. It also includes customer satisfaction score, customer retention in a 12 months format. Deliver and pitch your topic in the best possible manner with this sustainability calculation with kpi customer service dashboard microsoft pdf. Use them to share invaluable insights on customer satisfaction, revenue, customer retention and impress your audience. This template can be altered and modified as per your expectations. So, grab it now.
Implementing CRM To Optimize Dashboard Depicting Customer Retention Analytics Icons PDF
This slide shows the dashboard that depicts customer retention analytics which includes net promoter score, customer loyalty rate, customer lifetime value, customer and revenue churn, monthly recurring revenue growth, etc. Slidegeeks is one of the best resources for PowerPoint templates. You can download easily and regulate Implementing CRM To Optimize Dashboard Depicting Customer Retention Analytics Icons PDF for your personal presentations from our wonderful collection. A few clicks is all it takes to discover and get the most relevant and appropriate templates. Use our Templates to add a unique zing and appeal to your presentation and meetings. All the slides are easy to edit and you can use them even for advertisement purposes.

Customer Attainment Price To Gain New Clients Client Acquisition Cost Measurement Dashboard Microsoft PDF
This slide shows a Client Acquisition Cost CAC Measurement Dashboard with details such as total customers, employee satisfaction rate, number of trials, monthly active users, NPS net promoter score etc. This is a customer attainment price to gain new clients client acquisition cost measurement dashboard microsoft pdf template with various stages. Focus and dispense information on four stages using this creative set, that comes with editable features. It contains large content boxes to add your information on topics like website visitors, monthly active users, number of trials, customer acquisition cost. You can also showcase facts, figures, and other relevant content using this PPT layout. Grab it now.

Client Acquisition Cost For Customer Retention Client Acquisition Cost Measurement Dashboard Demonstration PDF
This slide shows a Client Acquisition Cost CAC Measurement Dashboard with details such as total customers, employee satisfaction rate, number of trials, monthly active users, NPS net promoter score etc. Deliver an awe inspiring pitch with this creative client acquisition cost for customer retention client acquisition cost measurement dashboard demonstration pdf bundle. Topics like website visitors, monthly active users, number of trials, customer acquisition cost can be discussed with this completely editable template. It is available for immediate download depending on the needs and requirements of the user.
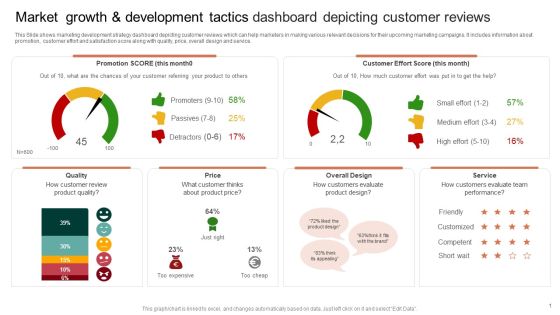
Market Growth And Development Tactics Dashboard Depicting Customer Reviews Pictures PDF
This Slide shows marketing development strategy dashboard depicting customer reviews which can help marketers in making various relevant decisions for their upcoming marketing campaigns. It includes information about promotion, customer effort and satisfaction score along with quality, price, overall design and service. Showcasing this set of slides titled Market Growth And Development Tactics Dashboard Depicting Customer Reviews Pictures PDF. The topics addressed in these templates are Product Price, Product Quality, Overall Design. All the content presented in this PPT design is completely editable. Download it and make adjustments in color, background, font etc. as per your unique business setting.

Dashboard To Business Success Measurement Of Customer Service Initiatives Microsoft PDF
This slide showcases customer service initiatives success measurement dashboard. It provides information about net promoter score NPS, customer satisfaction CSAT, first response time, close time, etc. Showcasing this set of slides titled Dashboard To Business Success Measurement Of Customer Service Initiatives Microsoft PDF. The topics addressed in these templates are Initial Response Time, Close Time, First Response Time. All the content presented in this PPT design is completely editable. Download it and make adjustments in color, background, font etc. as per your unique business setting.

Dashboard Depicting Client And Employee Customer NPS Metric Ppt Gallery Deck PDF
This slide shows dashboard depicting client and employee net promoter score NPS. It contains information about customer refer probability, recent service review and repeated use of service. Showcasing this set of slides titled Dashboard Depicting Client And Employee Customer NPS Metric Ppt Gallery Deck PDF. The topics addressed in these templates are Client NPS, Employee NPS, Customer Probability. All the content presented in this PPT design is completely editable. Download it and make adjustments in color, background, font etc. as per your unique business setting.
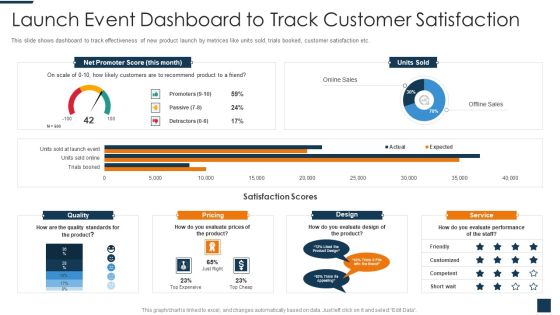
Go To Market Strategy For New Product Launch Event Dashboard To Track Customer Satisfaction Introduction PDF
This slide shows dashboard to track effectiveness of new product launch by metrices like units sold, trials booked, customer satisfaction etc. Deliver and pitch your topic in the best possible manner with this go to market strategy for new product launch event dashboard to track customer satisfaction introduction pdf. Use them to share invaluable insights on net promoter score, units sold, quality, pricing, design, service and impress your audience. This template can be altered and modified as per your expectations. So, grab it now.

Customer Support Center Call Center Action Plan Dashboard Highlighting Agent Diagrams PDF
This slide showcases dashboard for call center action plan which includes total calls, average answer speed, abandon rate, average calls per minute with agent performance and overall customer satisfaction score. Want to ace your presentation in front of a live audience Our Customer Support Center Call Center Action Plan Dashboard Highlighting Agent Diagrams PDF can help you do that by engaging all the users towards you.. Slidegeeks experts have put their efforts and expertise into creating these impeccable powerpoint presentations so that you can communicate your ideas clearly. Moreover, all the templates are customizable, and easy-to-edit and downloadable. Use these for both personal and commercial use.

Amazon Tactical Plan KPI Dashboard To Track Amazon Performance Clipart PDF
This slide provides information regarding dashboard to monitor Amazon performance. The KPIs include tracking of product sales, conversion rate, advertising spends, session, organic sales, etc. The Amazon Tactical Plan KPI Dashboard To Track Amazon Performance Clipart PDF is a compilation of the most recent design trends as a series of slides. It is suitable for any subject or industry presentation, containing attractive visuals and photo spots for businesses to clearly express their messages. This template contains a variety of slides for the user to input data, such as structures to contrast two elements, bullet points, and slides for written information. Slidegeeks is prepared to create an impression.

International Business Extension Dashboard To Track Revenue After Global Expansion Introduction PDF
This slide showcase dashboard that can help organization track revenue after global expansion. Its key components are average revenue per customer, customer acquisition cost, customer lifetime value and new customers acquired. Crafting an eye-catching presentation has never been more straightforward. Let your presentation shine with this tasteful yet straightforward International Business Extension Dashboard To Track Revenue After Global Expansion Introduction PDF template. It offers a minimalistic and classy look that is great for making a statement. The colors have been employed intelligently to add a bit of playfulness while still remaining professional. Construct the ideal International Business Extension Dashboard To Track Revenue After Global Expansion Introduction PDF that effortlessly grabs the attention of your audience Begin now and be certain to wow your customers.

Assessing International Market Dashboard To Track Revenue After Global Expansion Template PDF
This slide showcase dashboard that can help organization track revenue after global expansion. Its key components are average revenue per customer, customer acquisition cost, customer lifetime value and new customers acquired. Crafting an eye-catching presentation has never been more straightforward. Let your presentation shine with this tasteful yet straightforward Assessing International Market Dashboard To Track Revenue After Global Expansion Template PDF template. It offers a minimalistic and classy look that is great for making a statement. The colors have been employed intelligently to add a bit of playfulness while still remaining professional. Construct the ideal Assessing International Market Dashboard To Track Revenue After Global Expansion Template PDF that effortlessly grabs the attention of your audience Begin now and be certain to wow your customers.

KPI Metrics Dashboard To Measure Automation Performance In Customer Support Professional PDF
The following slide outlines a comprehensive KPI dashboard which can be used by the organization to measure the automation performance in customer support department. It covers kpis such as customer retention, costs per support, customer satisfaction, etc. Deliver and pitch your topic in the best possible manner with this KPI Metrics Dashboard To Measure Automation Performance In Customer Support Professional PDF. Use them to share invaluable insights on Customer Retention, Cost Per Support, Support Costs To Revenue and impress your audience. This template can be altered and modified as per your expectations. So, grab it now.

Integrating Aiops To Enhance Process Effectiveness Customer Service Dashboard Through AI Slides PDF
The following slide highlights the customer service dashboard that shows the use of AI in customer satisfaction Slidegeeks is here to make your presentations a breeze with Integrating Aiops To Enhance Process Effectiveness Customer Service Dashboard Through AI Slides PDF With our easy-to-use and customizable templates, you can focus on delivering your ideas rather than worrying about formatting. With a variety of designs to choose from, youre sure to find one that suits your needs. And with animations and unique photos, illustrations, and fonts, you can make your presentation pop. So whether youre giving a sales pitch or presenting to the board, make sure to check out Slidegeeks first.

Dashboard For Parallel Processing System Ppt PowerPoint Presentation File Portfolio PDF
This slide represents the dashboard for the parallel processing system. It includes the monitoring of the processor by covering details of CPU utilization by devices, processes, processes by CPU utilization, heatmap, and the maximum number of minimum, maximum and average CPU utilizes. Crafting an eye catching presentation has never been more straightforward. Let your presentation shine with this tasteful yet straightforward Dashboard For Parallel Processing System Ppt PowerPoint Presentation File Portfolio PDF template. It offers a minimalistic and classy look that is great for making a statement. The colors have been employed intelligently to add a bit of playfulness while still remaining professional. Construct the ideal Dashboard For Parallel Processing System Ppt PowerPoint Presentation File Portfolio PDF that effortlessly grabs the attention of your audience Begin now and be certain to wow your customers.

Dashboard For Parallel Processing System Ppt PowerPoint Presentation File Pictures PDF
This slide represents the dashboard for the parallel processing system. It includes the monitoring of the processor by covering details of CPU utilization by devices, processes, processes by CPU utilization, heatmap, and the maximum number of minimum, maximum and average CPU utilizes. Crafting an eye catching presentation has never been more straightforward. Let your presentation shine with this tasteful yet straightforward Dashboard For Parallel Processing System Ppt PowerPoint Presentation File Pictures PDF template. It offers a minimalistic and classy look that is great for making a statement. The colors have been employed intelligently to add a bit of playfulness while still remaining professional. Construct the ideal Dashboard For Parallel Processing System Ppt PowerPoint Presentation File Pictures PDF that effortlessly grabs the attention of your audience Begin now and be certain to wow your customers.

Customer Deal Tracking In Sales Pipeline Dashboard Improving Distribution Channel Ideas PDF
This slide covers information regarding dashboard for tracking various customer deals in sales pipeline. This is a Customer Deal Tracking In Sales Pipeline Dashboard Improving Distribution Channel Ideas PDF template with various stages. Focus and dispense information on three stages using this creative set, that comes with editable features. It contains large content boxes to add your information on topics like Proposal Sent, Terms Accepted, Customer Conversion. You can also showcase facts, figures, and other relevant content using this PPT layout. Grab it now.

Expansion Strategic Plan Dashboard To Track Revenue After Global Expansion Rules PDF
This slide showcase dashboard that can help organization track revenue after global expansion. Its key components are average revenue per customer, customer acquisition cost, customer lifetime value and new customers acquired. Create an editable Expansion Strategic Plan Dashboard To Track Revenue After Global Expansion Rules PDF that communicates your idea and engages your audience. Whether youre presenting a business or an educational presentation, pre-designed presentation templates help save time. Expansion Strategic Plan Dashboard To Track Revenue After Global Expansion Rules PDF is highly customizable and very easy to edit, covering many different styles from creative to business presentations. Slidegeeks has creative team members who have crafted amazing templates. So, go and get them without any delay.
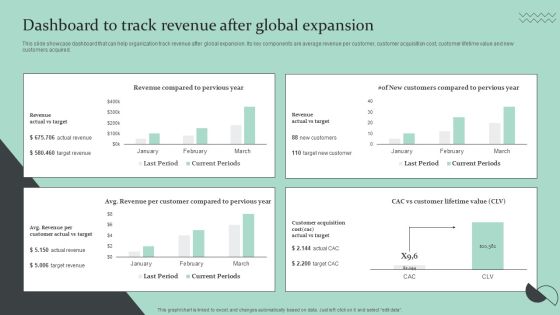
Strategic Global Expansion Business Plan Dashboard To Track Revenue After Global Expansion Topics PDF
This slide showcase dashboard that can help organization track revenue after global expansion. Its key components are average revenue per customer, customer acquisition cost, customer lifetime value and new customers acquired. Here you can discover an assortment of the finest PowerPoint and Google Slides templates. With these templates, you can create presentations for a variety of purposes while simultaneously providing your audience with an eye catching visual experience. Download Strategic Global Expansion Business Plan Dashboard To Track Revenue After Global Expansion Topics PDF to deliver an impeccable presentation. These templates will make your job of preparing presentations much quicker, yet still, maintain a high level of quality. Slidegeeks has experienced researchers who prepare these templates and write high quality content for you. Later on, you can personalize the content by editing the Strategic Global Expansion Business Plan Dashboard To Track Revenue After Global Expansion Topics PDF.

Dashboard To Monitor Department Wise Budget Allocation And Usage Icons PDF
This slide highlights the dashboard to monitor the department wise budget allocation and usage. It provides information regarding the total budget allocated and actual amount spent by multiple organization silos such as marketing, finance, HR. It also contains details of each departments average employee spending, Make sure to capture your audiences attention in your business displays with our gratis customizable Dashboard To Monitor Department Wise Budget Allocation And Usage Icons PDF. These are great for business strategies, office conferences, capital raising or task suggestions. If you desire to acquire more customers for your tech business and ensure they stay satisfied, create your own sales presentation with these plain slides.

Dashboard To Track Website And Application Traffic Gaining Competitive Advantage And Capturing Guidelines PDF
This slide showcases dashboard that can help organization to evaluate the traffic of website and application after entering into niche market. Its key elements are users, conversions, conversion by event type and engagement rate.Make sure to capture your audiences attention in your business displays with our gratis customizable Dashboard To Track Website And Application Traffic Gaining Competitive Advantage And Capturing Guidelines PDF. These are great for business strategies, office conferences, capital raising or task suggestions. If you desire to acquire more customers for your tech business and ensure they stay satisfied, create your own sales presentation with these plain slides.
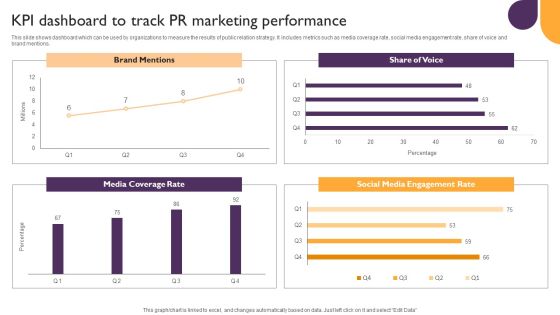
Public Relations Guide To Enhance Brand Credibility KPI Dashboard To Track PR Marketing Performance Diagrams PDF
This slide shows dashboard which can be used by organizations to measure the results of public relation strategy. It includes metrics such as media coverage rate, social media engagement rate, share of voice and brand mentions. Make sure to capture your audiences attention in your business displays with our gratis customizable Public Relations Guide To Enhance Brand Credibility KPI Dashboard To Track PR Marketing Performance Diagrams PDF. These are great for business strategies, office conferences, capital raising or task suggestions. If you desire to acquire more customers for your tech business and ensure they stay satisfied, create your own sales presentation with these plain slides.

Online PR Techniques To Boost Brands Online Visibility KPI Dashboard To Track PR Marketing Summary PDF
This slide shows dashboard which can be used by organizations to measure the results of public relation strategy. It includes metrics such as media coverage rate, social media engagement rate, share of voice and brand mentions. Make sure to capture your audiences attention in your business displays with our gratis customizable Online PR Techniques To Boost Brands Online Visibility KPI Dashboard To Track PR Marketing Summary PDF. These are great for business strategies, office conferences, capital raising or task suggestions. If you desire to acquire more customers for your tech business and ensure they stay satisfied, create your own sales presentation with these plain slides.
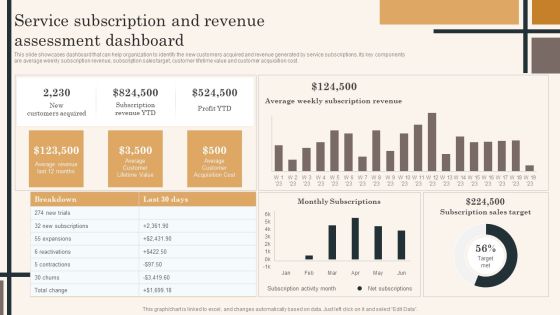
Edtech Service Launch And Promotion Plan Service Subscription And Revenue Assessment Dashboard Topics PDF
This slide showcases dashboard that can help organization to identify the new customers acquired and revenue generated by service subscriptions. Its key components are average weekly subscription revenue, subscription sales target, customer lifetime value and customer acquisition cost. Whether you have daily or monthly meetings, a brilliant presentation is necessary. Edtech Service Launch And Promotion Plan Service Subscription And Revenue Assessment Dashboard Topics PDF can be your best option for delivering a presentation. Represent everything in detail using Edtech Service Launch And Promotion Plan Service Subscription And Revenue Assessment Dashboard Topics PDF and make yourself stand out in meetings. The template is versatile and follows a structure that will cater to your requirements. All the templates prepared by Slidegeeks are easy to download and edit. Our research experts have taken care of the corporate themes as well. So, give it a try and see the results.

 Home
Home