AI PPT Maker
Templates
PPT Bundles
Design Services
Business PPTs
Business Plan
Management
Strategy
Introduction PPT
Roadmap
Self Introduction
Timelines
Process
Marketing
Agenda
Technology
Medical
Startup Business Plan
Cyber Security
Dashboards
SWOT
Proposals
Education
Pitch Deck
Digital Marketing
KPIs
Project Management
Product Management
Artificial Intelligence
Target Market
Communication
Supply Chain
Google Slides
Research Services
 One Pagers
All Categories
-
Home
- Customer Favorites
- Office Organizational Chart
Office Organizational Chart
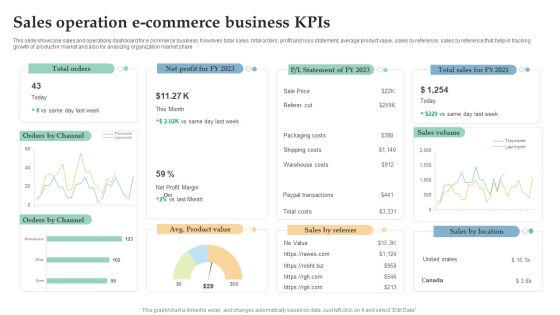
Sales Operation E Commerce Business Kpis Ppt Infographics Design Templates PDF
This slide showcase sales and operations dashboard for e commerce business. It involves total sales, total orders, profit and loss statement, average product value, sales by reference, sales by reference that help in tracking growth of product in market and also for analyzing organization market share. Pitch your topic with ease and precision using this Sales Operation E Commerce Business Kpis Ppt Infographics Design Templates PDF. This layout presents information on Total Orders, Sales Volume, Orders Channel. It is also available for immediate download and adjustment. So, changes can be made in the color, design, graphics or any other component to create a unique layout.

Assessing Debt And Equity Fundraising Alternatives For Business Growth Financial KPI Dashboard To Evaluate Infographics PDF
This slide showcases dashboard that can help organization to evaluate key changes in financial kpis post fundraising. Its key components are net profit margin, revenue, gross profit margin, debt to equity and return on equity. This Assessing Debt And Equity Fundraising Alternatives For Business Growth Financial KPI Dashboard To Evaluate Infographics PDF is perfect for any presentation, be it in front of clients or colleagues. It is a versatile and stylish solution for organizing your meetings. TheAssessing Debt And Equity Fundraising Alternatives For Business Growth Financial KPI Dashboard To Evaluate Infographics PDF features a modern design for your presentation meetings. The adjustable and customizable slides provide unlimited possibilities for acing up your presentation. Slidegeeks has done all the homework before launching the product for you. So, do not wait, grab the presentation templates today
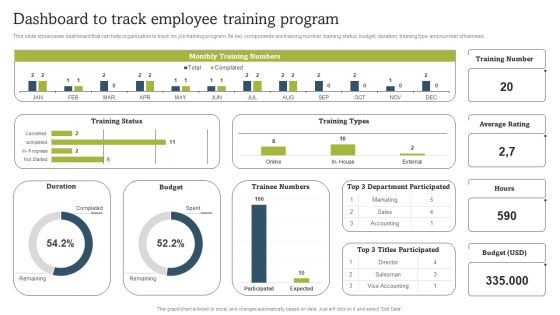
On Job Staff Coaching Program For Skills Refinement Dashboard To Track Employee Training Program Clipart PDF
This slide showcases dashboard that can help organization to track on job training program. Its key components are training number, training status, budget, duration, training type and number of trainees. Create an editable On Job Staff Coaching Program For Skills Refinement Dashboard To Track Employee Training Program Clipart PDF that communicates your idea and engages your audience. Whether you are presenting a business or an educational presentation, pre designed presentation templates help save time. On Job Staff Coaching Program For Skills Refinement Dashboard To Track Employee Training Program Clipart PDF is highly customizable and very easy to edit, covering many different styles from creative to business presentations. Slidegeeks has creative team members who have crafted amazing templates. So, go and get them without any delay.

Prospective Buyer Retention Dashboard With Key Performance Indicators Themes PDF
This slide shows the dashboard representing the key performance metrics for retention of potential customers of the organization. It shows no. of active users, churn rate, cost of customer acquisition, their life time value, monthly recurring revenue etc.Pitch your topic with ease and precision using this Prospective Buyer Retention Dashboard With Key Performance Indicators Themes PDF. This layout presents information on Recurring Revenue, Revenue Growth, Customer Acquisition. It is also available for immediate download and adjustment. So, changes can be made in the color, design, graphics or any other component to create a unique layout.

Customer Satisfaction Survey Analysis Of It Company Dashboard Themes PDF
This slide shows the insights of survey conducted by an IT company to know whether their customers are satisfied with their services or not and also includes questions related to their services, and suggestions for their improvements. Pitch your topic with ease and precision using this Customer Satisfaction Survey Analysis Of It Company Dashboard Themes PDF. This layout presents information on Organization, Business, Service. It is also available for immediate download and adjustment. So, changes can be made in the color, design, graphics or any other component to create a unique layout.

Shareholding Pattern Logistic Company Investor Fund Raising Pitch Deck Information PDF
This slide represents shareholding pattern of digital freight management company. It includes key components such as shareholders, and percentages of shares holding. Welcome to our selection of the Shareholding Pattern Logistic Company Investor Fund Raising Pitch Deck Information PDF. These are designed to help you showcase your creativity and bring your sphere to life. Planning and Innovation are essential for any business that is just starting out. This collection contains the designs that you need for your everyday presentations. All of our PowerPoints are 100 percent editable, so you can customize them to suit your needs. This multi-purpose template can be used in various situations. Grab these presentation templates today

Metrics For Software Development With Planned And Active Work Structure PDF
This slide showcases task completion and progress status for application programming project in organization to ensure timely delivery by avoiding delays. It includes details about active, planned, unplanned, moved work, backlog and tags, velocity, sprint burndown, etc. Pitch your topic with ease and precision using this Metrics For Software Development With Planned And Active Work Structure PDF. This layout presents information on Metrics For Software Development With Planned And Active Work Structure PDF. It is also available for immediate download and adjustment. So, changes can be made in the color, design, graphics or any other component to create a unique layout.
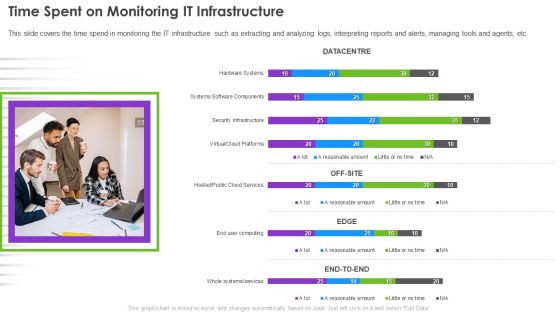
Infrastructure Supervision Time Spent On Monitoring IT Infrastructure Demonstration PDF
This slide covers the time spend in monitoring the IT infrastructure such as extracting and analyzing logs, interpreting reports and alerts, managing tools and agents, etc. Deliver and pitch your topic in the best possible manner with this Infrastructure Supervision Time Spent On Monitoring IT Infrastructure Demonstration PDF. Use them to share invaluable insights on Virtual, Cloud Platforms, Security Infrastructure, Systems Software Components, Hardware Systems and impress your audience. This template can be altered and modified as per your expectations. So, grab it now.

Project Drivers Kpi Dashboard With Digital Marketing Metrics Ppt PowerPoint Presentation File Clipart PDF
This slide outlines the digital marketing project drivers dashboard which includes components such as growth, No. orders, revenue and EBITDA margin. It also provides information about the website traffic, conversion rate and new customers which can assist managers to track digital marketing performance. Showcasing this set of slides titled Project Drivers Kpi Dashboard With Digital Marketing Metrics Ppt PowerPoint Presentation File Clipart PDF. The topics addressed in these templates are Website Traffic, Conversion Rate, New Customers. All the content presented in this PPT design is completely editable. Download it and make adjustments in color, background, font etc. as per your unique business setting.
Storage Facility Productivity Tracking KPI Dashboard Graphics PDF
This slide showcases a dashboard for tracking and managing warehouse productivity to optimize logistics operations. It includes key components such as warehouse operating costs, perfect order rate, total shipments by country and on time shipments. Showcasing this set of slides titled Storage Facility Productivity Tracking KPI Dashboard Graphics PDF. The topics addressed in these templates are Warehouse Operating Costs, Perfect Order Rate, Total Shipment Country. All the content presented in this PPT design is completely editable. Download it and make adjustments in color, background, font etc. as per your unique business setting.
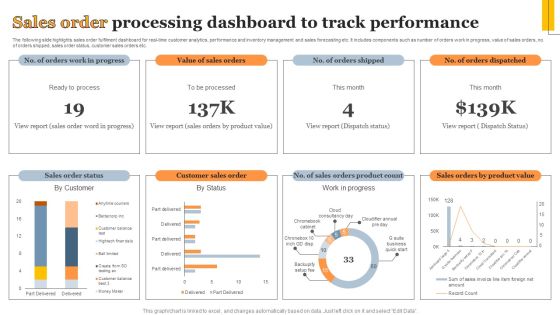
Sales Order Processing Dashboard To Track Performance Information PDF
The following slide highlights sales order fulfilment dashboard for real-time customer analytics, performance and inventory management and sales forecasting etc. It includes components such as number of orders work in progress, value of sales orders, no. of orders shipped, sales order status, customer sales orders etc. Showcasing this set of slides titled Sales Order Processing Dashboard To Track Performance Information PDF. The topics addressed in these templates are Sales Order Status, Customer Sales Order, Work Progress. All the content presented in this PPT design is completely editable. Download it and make adjustments in color, background, font etc. as per your unique business setting.
Automated Manufacturing Workflow Impact On Business Performance Sample PDF
Mentioned slide showcases statistics highlighting impact of manufacturing process automation on business growth. It includes key components such as product quality, cost efficiency, customer support, resource management, productivity, and customization. Showcasing this set of slides titled Automated Manufacturing Workflow Impact On Business Performance Sample PDF. The topics addressed in these templates are Product Quality Improved, Business Cost Efficiency, Defective Products Development. All the content presented in this PPT design is completely editable. Download it and make adjustments in color, background, font etc. as per your unique business setting.
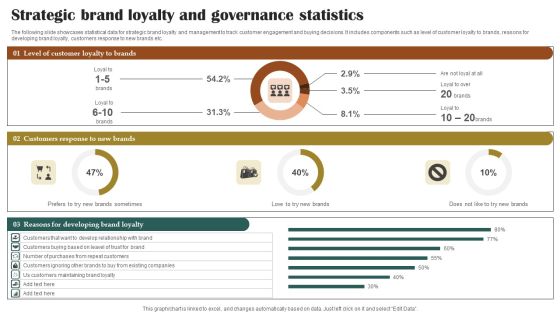
Strategic Brand Loyalty And Governance Statistics Clipart PDF
The following slide showcases statistical data for strategic brand loyalty and management to track customer engagement and buying decisions. It includes components such as level of customer loyalty to brands, reasons for developing brand loyalty, customers response to new brands etc. Showcasing this set of slides titled Strategic Brand Loyalty And Governance Statistics Clipart PDF. The topics addressed in these templates are Customer Loyalty Brands, Customers Response Brands, Reasons Developing Brand Loyalty. All the content presented in this PPT design is completely editable. Download it and make adjustments in color, background, font etc. as per your unique business setting.

Corporate Training Program Dashboard To Track Employee Performance Portrait PDF
This slide showcases dashboard that can help organization to track on job training program. Its key components are absenteeism rate, overtime hours, training duration and cost and overall labor effectiveness rate. Crafting an eye catching presentation has never been more straightforward. Let your presentation shine with this tasteful yet straightforward Corporate Training Program Dashboard To Track Employee Performance Portrait PDF template. It offers a minimalistic and classy look that is great for making a statement. The colors have been employed intelligently to add a bit of playfulness while still remaining professional. Construct the ideal Corporate Training Program Dashboard To Track Employee Performance Portrait PDF that effortlessly grabs the attention of your audience. Begin now and be certain to wow your customers.

Constructive Destructive Customer Feedback Summery Report Inspiration PDF
This slide displays analytics for client responses and ratings to build strong online review management and improve brand visibility of the company. It includes details about ratings, owner response, recent comments, etc. Pitch your topic with ease and precision using this Constructive Destructive Customer Feedback Summery Report Inspiration PDF. This layout presents information on Recent Reviews, Star Rating, Report. It is also available for immediate download and adjustment. So, changes can be made in the color, design, graphics or any other component to create a unique layout.
Executive Dashboards For Tracking Financial Health Of Enterprise Diagrams PDF
This slide represents the CEO dashboard to track the financial health of an organization. It includes key performance indicators such as revenue, expenses, activity ratio, gross profit margin, EBIT etc. Pitch your topic with ease and precision using this Executive Dashboards For Tracking Financial Health Of Enterprise Diagrams PDF. This layout presents information on Revenue, Expense, Activity Ratio. It is also available for immediate download and adjustment. So, changes can be made in the color, design, graphics or any other component to create a unique layout.

Brand Awareness Strategy Dashboard To Track Website Traffic After Brand Awareness Rules PDF
This slide showcases dashboard that can help organization to track the website traffic after running online brand awareness marketing campaigns. Its key components are new visitors, traffic by source, traffic by lead source, customers wins by lead source and bounce rate. From laying roadmaps to briefing everything in detail, our templates are perfect for you. You can set the stage with your presentation slides. All you have to do is download these easy-to-edit and customizable templates. Brand Awareness Strategy Dashboard To Track Website Traffic After Brand Awareness Rules PDF will help you deliver an outstanding performance that everyone would remember and praise you for. Do download this presentation today.

Promotion Strategies For New Service Launch Service Subscription And Revenue Assessment Dashboard Mockup PDF
This slide showcases dashboard that can help organization to identify the new customers acquired and revenue generated by service subscriptions. Its key components are average weekly subscription revenue, subscription sales target, customer lifetime value and customer acquisition cost. There are so many reasons you need a Promotion Strategies For New Service Launch Service Subscription And Revenue Assessment Dashboard Mockup PDF. The first reason is you can not spend time making everything from scratch, Thus, Slidegeeks has made presentation templates for you too. You can easily download these templates from our website easily.

Dual Branding Campaign To Boost Sales Of Product Or Services Dashboard For Dual Branding Campaign Performance Infographics PDF
This slide showcases dashboard that can help organization to measure performance after launching dual branding campaign. Its key components are sales comparison, revenue by client, revenue by source and new customers by source. The best PPT templates are a great way to save time, energy, and resources. Slidegeeks have 100 percent editable powerpoint slides making them incredibly versatile. With these quality presentation templates, you can create a captivating and memorable presentation by combining visually appealing slides and effectively communicating your message. Download Dual Branding Campaign To Boost Sales Of Product Or Services Dashboard For Dual Branding Campaign Performance Infographics PDF from Slidegeeks and deliver a wonderful presentation.
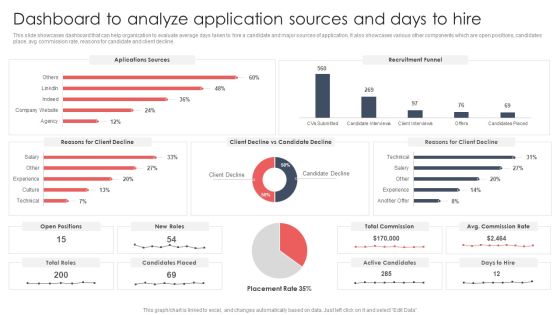
Screening And Staffing Dashboard To Analyze Application Sources And Days To Hire Sample PDF
This slide showcases dashboard that can help organization to evaluate average days taken to hire a candidate and major sources of application. It also showcases various other components which are open positions, candidates place, avg commission rate, reasons for candidate and client decline. From laying roadmaps to briefing everything in detail, our templates are perfect for you. You can set the stage with your presentation slides. All you have to do is download these easy-to-edit and customizable templates. Screening And Staffing Dashboard To Analyze Application Sources And Days To Hire Sample PDF will help you deliver an outstanding performance that everyone would remember and praise you for. Do download this presentation today.

Multi Project Metrics Dashboard With Overall Status Pictures PDF
This slide covers the dashboard that shows the status of project such as status of schedule, resource, quality with projects which are on schedule, in which issues has been occurred, that are critical, etc. That helps the project managers to understand the progress accurately. Pitch your topic with ease and precision using this Multi Project Metrics Dashboard With Overall Status Pictures PDF. This layout presents information on Multi Project, Metrics Dashboard. It is also available for immediate download and adjustment. So, changes can be made in the color, design, graphics or any other component to create a unique layout.

Market Feasibility Report With Competitor Analysis And Sales Projections Brochure PDF
This slide showcases report that can help organization to assess the financial and operational viability of new business before market entry. Its key components are target audience analysis, competitor analysis, estimated market growth and sales projection Showcasing this set of slides titled market feasibility report with competitor analysis and sales projections brochure pdf The topics addressed in these templates are target audience analysis, competitor analysis, estimated market growth All the content presented in this PPT design is completely editable. Download it and make adjustments in color, background, font etc. as per your unique business setting.

Product Marketing Performance Assessment Dashboard With Cost Per Conversion Professional PDF
This slide showcases dashboard that can help organization to calculate the return of investment from advertising campaigns. Its key components are top performing advertisement, top performing campaigns, conversion rate, conversion value, click through rate, cost per click and cost per conversion. Showcasing this set of slides titled Product Marketing Performance Assessment Dashboard With Cost Per Conversion Professional PDF. The topics addressed in these templates are Top Performing Advertisement, Top Performing Campaigns, AdWords Conversions. All the content presented in this PPT design is completely editable. Download it and make adjustments in color, background, font etc. as per your unique business setting.
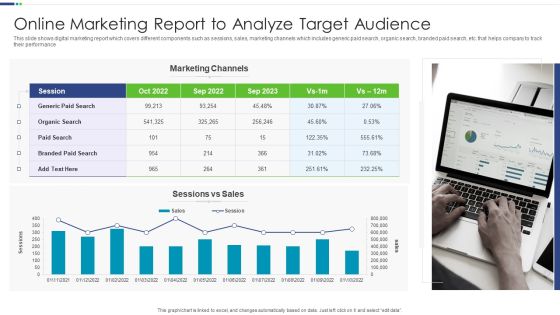
Online Marketing Report To Analyze Target Audience Elements PDF
This slide shows digital marketing report which covers different components such as sessions, sales, marketing channels which includes generic paid search, organic search, branded paid search, etc. that helps company to track their performance.Showcasing this set of slides titled Online Marketing Report To Analyze Target Audience Elements PDF The topics addressed in these templates are Online Marketing, Report To Analyze, Target Audience All the content presented in this PPT design is completely editable. Download it and make adjustments in color, background, font etc. as per your unique business setting.
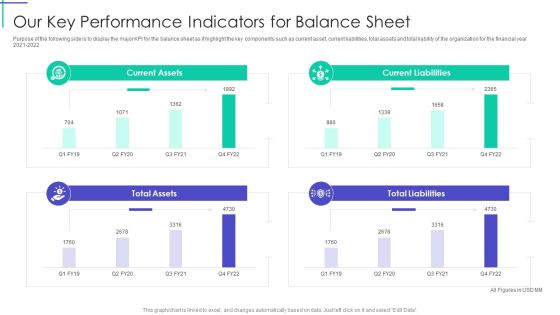
Mortgage Recovery Strategy For Finance Companies Our Key Performance Indicators For Balance Sheet Inspiration PDF
Purpose of the following side is to display the major KPI for the balance sheet as it highlight the key components such as current asset, current liabilities, total assets and total liability of the organization for the financial year 2021 to 2022. Deliver an awe inspiring pitch with this creative Mortgage Recovery Strategy For Finance Companies Our Key Performance Indicators For Balance Sheet Inspiration PDF bundle. Topics like Current Assets, Current Liabilities, Total Liabilities can be discussed with this completely editable template. It is available for immediate download depending on the needs and requirements of the user.

New Service Launch And Development Strategy To Gain Market Share Evaluating Market Share Of Competitors Information PDF
This slide showcases assessment of competitor share that can help organization to identify key player in market for targeted service offering. Its key components are market share assessment and competitor details.Deliver and pitch your topic in the best possible manner with this New Service Launch And Development Strategy To Gain Market Share Evaluating Market Share Of Competitors Information PDF Use them to share invaluable insights on Competitor Details, Competitor Market, Premium Services and impress your audience. This template can be altered and modified as per your expectations. So, grab it now.
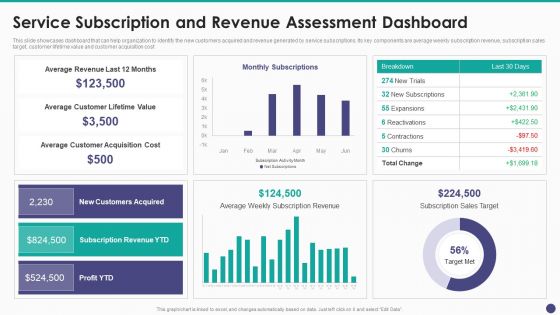
New Service Launch And Development Strategy To Gain Market Share Service Subscription And Revenue Demonstration PDF
This slide showcases dashboard that can help organization to identify the new customers acquired and revenue generated by service subscriptions. Its key components are average weekly subscription revenue, subscription sales target, customer lifetime value and customer acquisition cost.Deliver an awe inspiring pitch with this creative New Service Launch And Development Strategy To Gain Market Share Service Subscription And Revenue Demonstration PDF bundle. Topics like Average Revenue, Average Customer, Customer Acquisition can be discussed with this completely editable template. It is available for immediate download depending on the needs and requirements of the user.
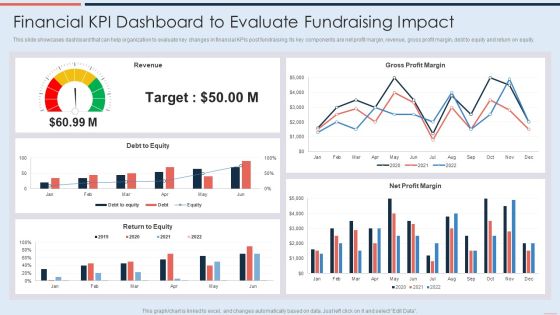
Financial Kpi Dashboard To Evaluate Fundraising Impact Demonstration PDF
This slide showcases dashboard that can help organization to evaluate key changes in financial KPIs post fundraising. Its key components are net profit margin, revenue, gross profit margin, debt to equity and return on equity. Deliver and pitch your topic in the best possible manner with this Financial Kpi Dashboard To Evaluate Fundraising Impact Demonstration PDF. Use them to share invaluable insights on Debt To Equity, Revenue, Gross Profit Margin and impress your audience. This template can be altered and modified as per your expectations. So, grab it now.
Weekly Tracking Dashboard For Social Media Content Inspiration PDF
This slide showcases weekly content tracking dashboard that can help organization to track the statistics of social media blogs and videos. Its key components are avg impressions per post, avg reach per post, avg engagement rate and avg click through rate.Showcasing this set of slides titled Weekly Tracking Dashboard For Social Media Content Inspiration PDF The topics addressed in these templates are Impressions Per, Impression On Facebook, Posts Reactions All the content presented in this PPT design is completely editable. Download it and make adjustments in color, background, font etc. as per your unique business setting.

Digital Marketing Guide For B2B Firms Dashboard To Track Social Media Ads Campaign Results Topics PDF
This slide showcases dashboard that can help organization to track performance of social media advertising campaigns. Its key components are cost per conversion, CTR, link clicks, impressions, conversion rate, click through rate and cost per click.Deliver and pitch your topic in the best possible manner with this Digital Marketing Guide For B2B Firms Dashboard To Track Social Media Ads Campaign Results Topics PDF. Use them to share invaluable insights on Website Conversions, Conversions Rate, Cost Per Conversion and impress your audience. This template can be altered and modified as per your expectations. So, grab it now.

Digital Marketing Guide For B2B Firms Dashboard To Track Social Media Marketing Campaign Metrics Demonstration PDF
This slide showcases dashboard that can help organization to track the metrics of social media marketing campaign. Its key components are followers, post reach, page impressions, visitors, avg engagement and lifetime views.Deliver an awe inspiring pitch with this creative Digital Marketing Guide For B2B Firms Dashboard To Track Social Media Marketing Campaign Metrics Demonstration PDF bundle. Topics like Page Impressions, New Followers, Talking About can be discussed with this completely editable template. It is available for immediate download depending on the needs and requirements of the user.
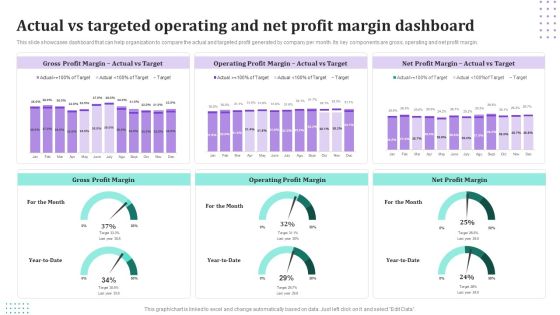
Actual Vs Targeted Operating And Net Profit Margin Dashboard Information PDF
This slide showcases dashboard that can help organization to compare the actual and targeted profit generated by company per month. Its key components are gross, operating and net profit margin. Showcasing this set of slides titled Actual Vs Targeted Operating And Net Profit Margin Dashboard Information PDF. The topics addressed in these templates are Gross Profit Margin, Operating Profit Margin, Net Profit Margin. All the content presented in this PPT design is completely editable. Download it and make adjustments in color, background, font etc. as per your unique business setting.

Dashboard For Customer Satisfaction Survey Outcome Demonstration PDF
This slide outlines customer satisfaction survey outcome dashboard that can help organization to analyze the ratings and determine areas of improvement in customer service and make changes in strategies to increase the satisfied customers in future. Its key components are survey response rate, total invitations, total responses and CSAT score. Showcasing this set of slides titled Dashboard For Customer Satisfaction Survey Outcome Demonstration PDF. The topics addressed in these templates are Total Invitations, Survey Response Rate, Total Responses. All the content presented in this PPT design is completely editable. Download it and make adjustments in color, background, font etc. as per your unique business setting.

Customer Grievance Call Handling Dashboard With Abandon Rate Introduction PDF
This slide showcases dashboard that can help organization to identify the resolution time and average abandon rate of customer grievance calls. Its key components are average answer speed, avg calls or minute and overall satisfaction score. Showcasing this set of slides titled Customer Grievance Call Handling Dashboard With Abandon Rate Introduction PDF. The topics addressed in these templates are Customer Grievance Call Handling, Dashboard With Abandon Rate. All the content presented in this PPT design is completely editable. Download it and make adjustments in color, background, font etc. as per your unique business setting.

Customer Service Metrics Dashboard With Active Customers Ideas PDF
This slide showcases dashboard for customer service metrics that can help organization to prioritize the issue requests of consumers and ensure good response times. Its key components are active customer, active tickets, highly urgent rickets and average number of tickets. Showcasing this set of slides titled Customer Service Metrics Dashboard With Active Customers Ideas PDF. The topics addressed in these templates are Customer Service, Metrics Dashboard, Active Customers. All the content presented in this PPT design is completely editable. Download it and make adjustments in color, background, font etc. as per your unique business setting.
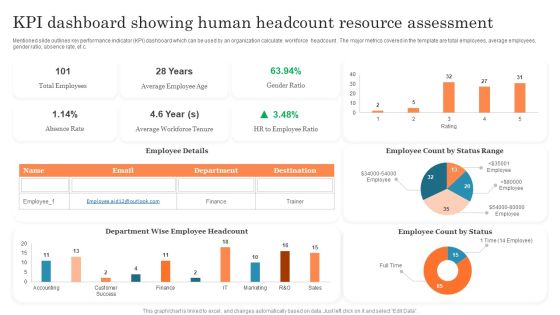
KPI Dashboard Showing Human Headcount Resource Assessment Ppt PowerPoint Presentation Outline PDF
Mentioned slide outlines key performance indicator KPI dashboard which can be used by an organization calculate workforce headcount . The major metrics covered in the template are total employees, average employees, gender ratio, absence rate, etc. Pitch your topic with ease and precision using this KPI Dashboard Showing Human Headcount Resource Assessment Ppt PowerPoint Presentation Outline PDF. This layout presents information on Total Employees, Average Employee, Employee Count. It is also available for immediate download and adjustment. So, changes can be made in the color, design, graphics or any other component to create a unique layout.
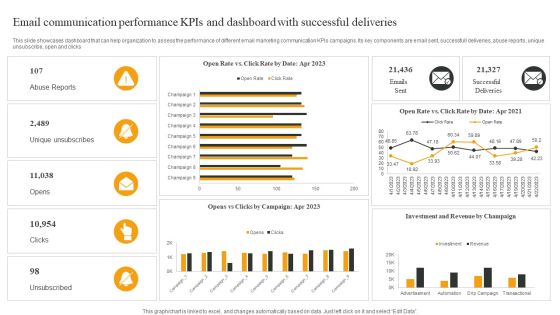
Email Communication Performance Kpis And Dashboard With Successful Deliveries Elements PDF
This slide showcases dashboard that can help organization to assess the performance of different email marketing communication KPIs campaigns. Its key components are email sent, successfull deliveries, abuse reports, unique unsubscribe, open and clicks. Showcasing this set of slides titled Email Communication Performance Kpis And Dashboard With Successful Deliveries Elements PDF. The topics addressed in these templates are Abuse Reports, Unique Unsubscribes, Opens. All the content presented in this PPT design is completely editable. Download it and make adjustments in color, background, font etc. as per your unique business setting.

Event Completion Report With Budget Summary And Age Breakdown Elements PDF
This slide showcases report that can help organization to conduct the analysis of budget and social media reach post event. Its key components are event overview, budget summary and social media reach results. Showcasing this set of slides titled Event Completion Report With Budget Summary And Age Breakdown Elements PDF. The topics addressed in these templates are Social Media Reach Results, Event Overview, Age Breakdown. All the content presented in this PPT design is completely editable. Download it and make adjustments in color, background, font etc. as per your unique business setting.
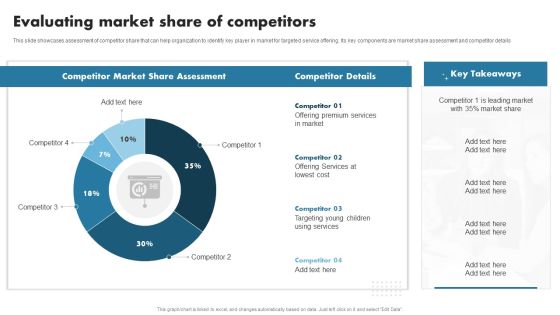
Enhancing Customer Outreach Evaluating Market Share Of Competitors Pictures PDF
This slide showcases assessment of competitor share that can help organization to identify key player in market for targeted service offering. Its key components are market share assessment and competitor details. Want to ace your presentation in front of a live audience Our Enhancing Customer Outreach Evaluating Market Share Of Competitors Pictures PDF can help you do that by engaging all the users towards you. Slidegeeks experts have put their efforts and expertise into creating these impeccable powerpoint presentations so that you can communicate your ideas clearly. Moreover, all the templates are customizable, and easy-to-edit and downloadable. Use these for both personal and commercial use.

Actual Vs Budgeted Earning Breakup Dashboard Inspiration PDF
This style showcases revenue breakdown dashboard that can help organization to compare the actual vs budgeted amount and calculate the variance in target achievements. Its key components are product revenue, services revenue and total revenues. Showcasing this set of slides titled Actual Vs Budgeted Earning Breakup Dashboard Inspiration PDF. The topics addressed in these templates are Actual Vs Budgeted, Earning Breakup Dashboard. All the content presented in this PPT design is completely editable. Download it and make adjustments in color, background, font etc. as per your unique business setting.
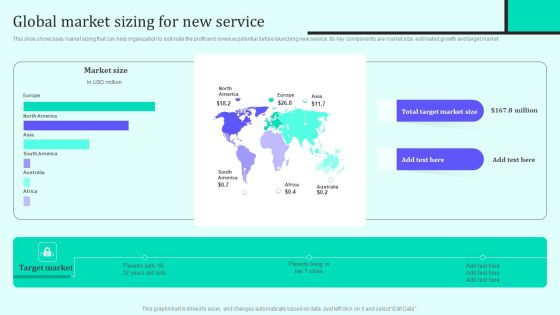
Implementing New Sales And Marketing Process For Services Global Market Sizing For New Service Information PDF
This slide showcases market sizing that can help organization to estimate the profit and revenue potential before launching new service. Its key components are market size, estimated growth and target market. Want to ace your presentation in front of a live audience Our Implementing New Sales And Marketing Process For Services Global Market Sizing For New Service Information PDF can help you do that by engaging all the users towards you. Slidegeeks experts have put their efforts and expertise into creating these impeccable powerpoint presentations so that you can communicate your ideas clearly. Moreover, all the templates are customizable, and easy to edit and downloadable. Use these for both personal and commercial use.
Monthly Comparison Dashboard For Lead Tracking Sample PDF
This slide showcases dashboard that can help organization to compare the leads converted in different months and make changes in sales and marketing campaigns . Its key components lead generated by country, by industry type and lead sources by month. Showcasing this set of slides titled Monthly Comparison Dashboard For Lead Tracking Sample PDF. The topics addressed in these templates are Leads Received, Industry Type, Lead Generated. All the content presented in this PPT design is completely editable. Download it and make adjustments in color, background, font etc. as per your unique business setting.
Sales Performance Dashboard With Average Lead Tracking Time Background PDF
This slide showcases dashboard for sales performance that can help organization to analyze the effectiveness of sales campaigns and average response time of lead. Its key components are average contract value, average sales cycle length, follow up contract rate and sales activity. Showcasing this set of slides titled Sales Performance Dashboard With Average Lead Tracking Time Background PDF. The topics addressed in these templates are Avg Contract Value, Sales Activity, Contract Rate. All the content presented in this PPT design is completely editable. Download it and make adjustments in color, background, font etc. as per your unique business setting.

KPI Dashboard Highlighting Business Problems Microsoft PDF
This slide depicts a dashboard which highlights the problems faced by organizations to easily track the issues and offer solutions for the same. The various key performance indicators in this dashboard are pain points by status, unresolved pain points for march 2023 etc. Showcasing this set of slides titled KPI Dashboard Highlighting Business Problems Microsoft PDF. The topics addressed in these templates are Unresolved Pain Points, Resolved Pain Points, Project Components. All the content presented in this PPT design is completely editable. Download it and make adjustments in color, background, font etc. as per your unique business setting.

Dashboard For Display Ad Campaigning With Leads Breakdown And Conversion Metrics Inspiration PDF
This slide displays dashboard to track and monitor efficiency of marketing team in organization. It includes components such as quality of trial leads, top social media channels, etc. Showcasing this set of slides titled Dashboard For Display Ad Campaigning With Leads Breakdown And Conversion Metrics Inspiration PDF. The topics addressed in these templates are Dashboard Display, Ad Campaigning, Conversion Metrics. All the content presented in this PPT design is completely editable. Download it and make adjustments in color, background, font etc. as per your unique business setting.
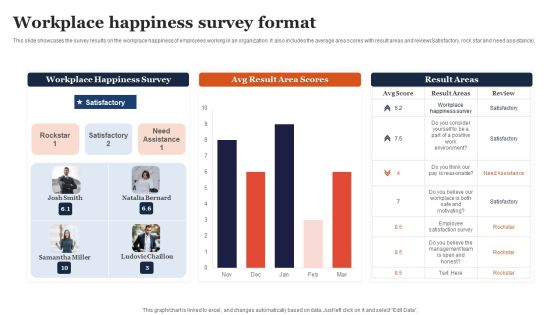
Workplace Happiness Survey Format Ppt Model Brochure PDF
This slide showcases the survey results on the workplace happiness of employees working in an organization. It also includes the average area scores with result areas and review Satisfactory, rock star and need. Pitch your topic with ease and precision using this Workplace Happiness Survey Format Ppt Model Brochure PDF. This layout presents information on Workplace Happiness Survey, Avg Result, Area Scores. It is also available for immediate download and adjustment. So, changes can be made in the color, design, graphics or any other component to create a unique layout.
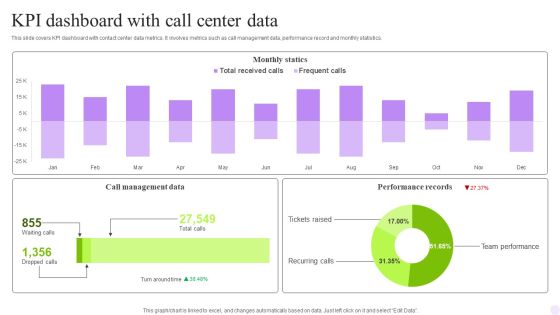
KPI Dashboard With Call Center Data Rules PDF
This slide covers contact center performance metrics KPI dashboard. It involves details such as number of total calls, average answer speed, abandon rate, data of agents performance and call abandon rate by departments. Pitch your topic with ease and precision using this KPI Dashboard With Call Center Data Rules PDF. This layout presents information on Monthly Statics, Management Data, Performance Records. It is also available for immediate download and adjustment. So, changes can be made in the color, design, graphics or any other component to create a unique layout.
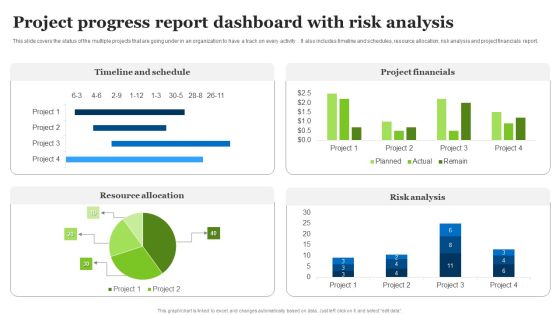
Project Progress Report Dashboard With Risk Analysis Ppt Examples PDF
This slide covers the status of the multiple projects that are going under in an organization to have a track on every activity . It also includes timeline and schedules, resource allocation, risk analysis and project financials report. Pitch your topic with ease and precision using this Project Progress Report Dashboard With Risk Analysis Ppt Examples PDF. This layout presents information on Timeline And Schedule, Project Financials, Risk Analysis. It is also available for immediate download and adjustment. So, changes can be made in the color, design, graphics or any other component to create a unique layout.
Project Tracking Planned Vs Actual Project Progress Tracker Pictures PDF
The following slide highlights the variations in the project progress to manage the its and ensure timely delivery. It includes KPIs such as completion percentage and the gap in the planned versus actual hours. Pitch your topic with ease and precision using this Project Tracking Planned Vs Actual Project Progress Tracker Pictures PDF. This layout presents information on Project Tracking Planned, Project Progress Tracker. It is also available for immediate download and adjustment. So, changes can be made in the color, design, graphics or any other component to create a unique layout.

Project Portfolio Metrics Dashboard With Activity Plan Clipart PDF
This slide focuses on project portfolio management dashboard which includes completed projects, budget spent, number of team members, associated risks and issues, activity plan with duration, status percentage, budget allocation, critical issues, tasks, comments, etc. Pitch your topic with ease and precision using this Project Portfolio Metrics Dashboard With Activity Plan Clipart PDF. This layout presents information on Budgets, Team, Risks. It is also available for immediate download and adjustment. So, changes can be made in the color, design, graphics or any other component to create a unique layout.

Project Budget Planning Dashboard With Income Statement Breakdown Professional PDF
This slide covers a dashboard which will help project managers for taking financial business decision by examining the income statement, income statement breakdown, cash flow and internal rate of return. Pitch your topic with ease and precision using this project budget planning dashboard with income statement breakdown professional pdf. This layout presents information on income statement, income statement breakdown, cash flow, internal rate of return . It is also available for immediate download and adjustment. So, changes can be made in the color, design, graphics or any other component to create a unique layout.

Promotional Budget Plan For Manufacturing Firm Information PDF
This slide showcase the allocation of monthly budget for various dimension of product manufacturing and marketing process. It includes budget for Face to face F2F marketing ,banner advertising, cost of hiring sales executives, managing events and promotions, SEO etc. Pitch your topic with ease and precision using this Promotional Budget Plan For Manufacturing Firm Information PDF. This layout presents information on Marketing, Budget, Sales Personnel. It is also available for immediate download and adjustment. So, changes can be made in the color, design, graphics or any other component to create a unique layout.

Company Inward Marketing Strategy Key Barriers Statistics Icons PDF
This slide covers top challenges of inbound marketing strategy that reduces its effectiveness. It includes generation of traffic, proving ROI for marketing activities, securing budget, technology update, website management, hiring talent and training team.Pitch your topic with ease and precision using this Company Inward Marketing Strategy Key Barriers Statistics Icons PDF. This layout presents information on Difficult To Search, Insufficient Traffic, Setting Budget. It is also available for immediate download and adjustment. So, changes can be made in the color, design, graphics or any other component to create a unique layout.
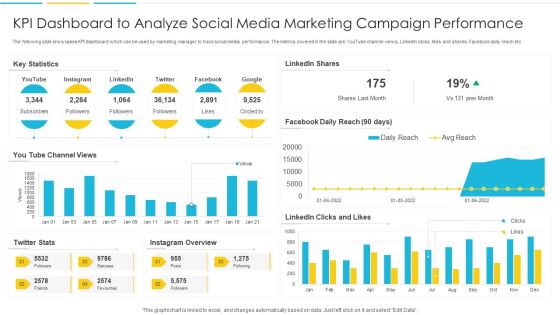
KPI Dashboard To Analyze Social Media Marketing Campaign Performance Rules PDF
The following slide showcases KPI dashboard which can be used by marketing manager to track social media performance. The metrics covered in the slide are YouTube channel views, LinkedIn clicks, likes and shares, Facebook daily reach etc. Pitch your topic with ease and precision using this KPI Dashboard To Analyze Social Media Marketing Campaign Performance Rules PDF. This layout presents information on Dashboard, Marketing, Analyze. It is also available for immediate download and adjustment. So, changes can be made in the color, design, graphics or any other component to create a unique layout.

You Tube Advertising Influence Survey On Different Age Groups Ppt Diagram Ppt PDF
This slide represents the survey conducted by an organization in order to study the influence or effect which the you tube marketing has on various age groups of the country. Pitch your topic with ease and precision using this You Tube Advertising Influence Survey On Different Age Groups Ppt Diagram Ppt PDF. This layout presents information on Larger Influence, You Tube Marketing, Young Generation. It is also available for immediate download and adjustment. So, changes can be made in the color, design, graphics or any other component to create a unique layout.
Gross Profit Margin Dashboard With Revenue Vs Expenses Icons PDF
This slide showcases dashboard that can help organization to evaluate the revenue generated and expenses incurred in conducting operations. It also showcases gross profit and margin of last financial year. Pitch your topic with ease and precision using this Gross Profit Margin Dashboard With Revenue Vs Expenses Icons PDF. This layout presents information on Gross Profit Margin, EBITDA Margin, Net Profit Margin. It is also available for immediate download and adjustment. So, changes can be made in the color, design, graphics or any other component to create a unique layout.
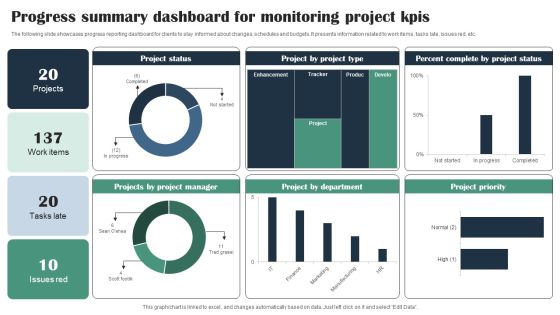
Progress Summary Dashboard For Monitoring Project Kpis Infographics PDF
The following slide showcases progress reporting dashboard for clients to stay informed about changes, schedules and budgets. It presents information related to work items, tasks late, issues red, etc. Pitch your topic with ease and precision using this Progress Summary Dashboard For Monitoring Project Kpis Infographics PDF. This layout presents information on Project Status, Project Manager, Project Type, Percent Complete. It is also available for immediate download and adjustment. So, changes can be made in the color, design, graphics or any other component to create a unique layout.
SFA Dashboard To Track Performance Ppt PowerPoint Presentation Icon Example File PDF
This Slide visually represents sales force automation dashboard to track performance which can be utilized by marketing managers to streamline the process of automated selling. It includes information about sales pipeline, competitors, opportunities, key competitors, etc. Pitch your topic with ease and precision using this sfa dashboard to track performance ppt powerpoint presentation icon example file pdf. This layout presents information on sales pipeline, sales pipeline by sales rep, key competitors, forecast by month, key opportunities. It is also available for immediate download and adjustment. So, changes can be made in the color, design, graphics or any other component to create a unique layout.
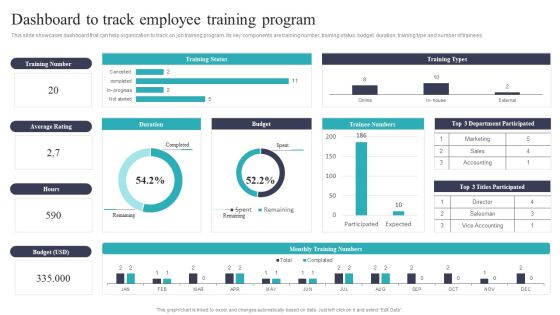
Developing And Executing On Job Coaching Program In Company Dashboard To Track Employee Training Microsoft PDF
This slide showcases dashboard that can help organization to track on job training program. Its key components are training number, training status, budget, duration, training type and number of trainees. Slidegeeks is one of the best resources for PowerPoint templates. You can download easily and regulate Developing And Executing On Job Coaching Program In Company Dashboard To Track Employee Training Microsoft PDF for your personal presentations from our wonderful collection. A few clicks is all it takes to discover and get the most relevant and appropriate templates. Use our Templates to add a unique zing and appeal to your presentation and meetings. All the slides are easy to edit and you can use them even for advertisement purposes.

On Job Staff Training Program For Skills Advancement Dashboard To Track Employee Training Download PDF
This slide showcases dashboard that can help organization to track on job training program. Its key components are training number, training status, budget, duration, training type and number of trainees. Slidegeeks is one of the best resources for PowerPoint templates. You can download easily and regulate On Job Staff Training Program For Skills Advancement Dashboard To Track Employee Training Download PDF for your personal presentations from our wonderful collection. A few clicks is all it takes to discover and get the most relevant and appropriate templates. Use our Templates to add a unique zing and appeal to your presentation and meetings. All the slides are easy to edit and you can use them even for advertisement purposes.

KPI Dashboard To Track Performance Of Online Promotional Budget Plan Inspiration PDF
This slide enables to monitor quarterly performance and return on marketing expenditure of digital marketing executed by an organization. It includes source wise performance report , return on investment, sales funnel , average order value report etc. Pitch your topic with ease and precision using this KPI Dashboard To Track Performance Of Online Promotional Budget Plan Inspiration PDF. This layout presents information on Average Order Value, Return On Investment, Sales. It is also available for immediate download and adjustment. So, changes can be made in the color, design, graphics or any other component to create a unique layout.

Edtech Service Launch And Promotion Plan Evaluating Market Share Of Competitors Infographics PDF
This slide showcases assessment of competitor share that can help organization to identify key player in market for targeted service offering. Its key components are market share assessment and competitor details. Take your projects to the next level with our ultimate collection of Edtech Service Launch And Promotion Plan Evaluating Market Share Of Competitors Infographics PDF. Slidegeeks has designed a range of layouts that are perfect for representing task or activity duration, keeping track of all your deadlines at a glance. Tailor these designs to your exact needs and give them a truly corporate look with your own brand colors they will make your projects stand out from the rest.

Business Intelligence Dashboard To Track Call Center Kpis Download PDF
This slide showcases business intelligence dashboard to help organization track key performance metrics. It further includes details about top agents, close rate, calls handled, abandon rate, scheduled leads, average speed of answer, etc. Pitch your topic with ease and precision using this Business Intelligence Dashboard To Track Call Center Kpis Download PDF. This layout presents information on Business Intelligence Dashboard, Track Call Center Kpis. It is also available for immediate download and adjustment. So, changes can be made in the color, design, graphics or any other component to create a unique layout.
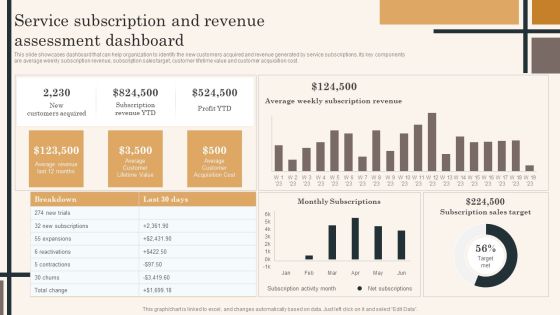
Edtech Service Launch And Promotion Plan Service Subscription And Revenue Assessment Dashboard Topics PDF
This slide showcases dashboard that can help organization to identify the new customers acquired and revenue generated by service subscriptions. Its key components are average weekly subscription revenue, subscription sales target, customer lifetime value and customer acquisition cost. Whether you have daily or monthly meetings, a brilliant presentation is necessary. Edtech Service Launch And Promotion Plan Service Subscription And Revenue Assessment Dashboard Topics PDF can be your best option for delivering a presentation. Represent everything in detail using Edtech Service Launch And Promotion Plan Service Subscription And Revenue Assessment Dashboard Topics PDF and make yourself stand out in meetings. The template is versatile and follows a structure that will cater to your requirements. All the templates prepared by Slidegeeks are easy to download and edit. Our research experts have taken care of the corporate themes as well. So, give it a try and see the results.
Edtech Service Launch And Promotion Plan Global Market Sizing For New Service Icons PDF
This slide showcases market sizing that can help organization to estimate the profit and revenue potential before launching new service. Its key components are market size, estimated growth and target market. Do you know about Slidesgeeks Edtech Service Launch And Promotion Plan Global Market Sizing For New Service Icons PDF These are perfect for delivering any kind od presentation. Using it, create PowerPoint presentations that communicate your ideas and engage audiences. Save time and effort by using our pre designed presentation templates that are perfect for a wide range of topic. Our vast selection of designs covers a range of styles, from creative to business, and are all highly customizable and easy to edit. Download as a PowerPoint template or use them as Google Slides themes.

Companies Implementing Client Life Cycle System Ppt Inspiration Introduction PDF
This slide shows how a customer journey cycle program benefits an organization in terms of increased customer satisfaction, improved average sales cycle time etc. Pitch your topic with ease and precision using this companies implementing client life cycle system ppt inspiration introduction pdf. This layout presents information on return on investment, improved customer satisfaction, average sales cycle. It is also available for immediate download and adjustment. So, changes can be made in the color, design, graphics or any other component to create a unique layout.

Employee Training And Development Strategy Dashboard To Track Employee Performance Slides PDF
This slide showcases dashboard that can help organization to track on job training program. Its key components are absenteeism rate, overtime hours, training duration and cost and overall labor effectiveness rate. Take your projects to the next level with our ultimate collection of Employee Training And Development Strategy Dashboard To Track Employee Performance Slides PDF. Slidegeeks has designed a range of layouts that are perfect for representing task or activity duration, keeping track of all your deadlines at a glance. Tailor these designs to your exact needs and give them a truly corporate look with your own brand colors they will make your projects stand out from the rest.
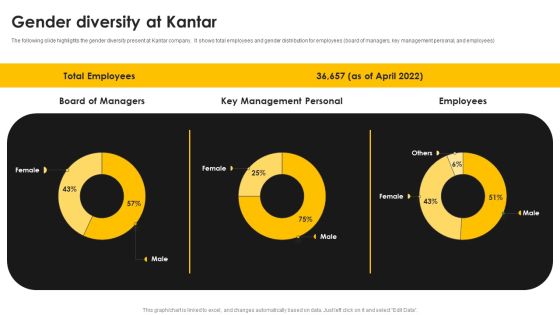
Kantar Consulting Company Outline Gender Diversity At Kantar Slides PDF
The following slide highlights the gender diversity present at Kantar company. It shows total employees and gender distribution for employees board of managers, key management personal, and employees. This Kantar Consulting Company Outline Gender Diversity At Kantar Slides PDF from Slidegeeks makes it easy to present information on your topic with precision. It provides customization options, so you can make changes to the colors, design, graphics, or any other component to create a unique layout. It is also available for immediate download, so you can begin using it right away. Slidegeeks has done good research to ensure that you have everything you need to make your presentation stand out. Make a name out there for a brilliant performance.

BPA Tools For Process Enhancement And Cost Minimization Impact Of Manual Process On Business Performance Slides PDF
The following slide outlines the impact of current manual process on organization performance. The organization faces various issues such as reduction in productivity, bottom line and increase in error rate. This BPA Tools For Process Enhancement And Cost Minimization Impact Of Manual Process On Business Performance Slides PDF from Slidegeeks makes it easy to present information on your topic with precision. It provides customization options, so you can make changes to the colors, design, graphics, or any other component to create a unique layout. It is also available for immediate download, so you can begin using it right away. Slidegeeks has done good research to ensure that you have everything you need to make your presentation stand out. Make a name out there for a brilliant performance.

Project Metrics Dashboard With Overall Progress Brochure PDF
This slide covers the project management dashboard which includes risks, overdue tasks, employees over budget, workloads, planning, designing, development and testing with current target amount, launch date, usage of targeted amount, etc. Pitch your topic with ease and precision using this Project Metrics Dashboard With Overall Progress Brochure PDF. This layout presents information on Design, Planning, Development. It is also available for immediate download and adjustment. So, changes can be made in the color, design, graphics or any other component to create a unique layout.

Project Metrics Dashboard For Software Development Designs PDF
This slide shows the project management dashboard for developing software which focuses on health status such as time, cost, workload, risks, issues and changes with comparison of actual and planned expenses with budget. It also shows the risks, issues ad changes. Pitch your topic with ease and precision using this Project Metrics Dashboard For Software Development Designs PDF. This layout presents information on Risks, Budget, Cost. It is also available for immediate download and adjustment. So, changes can be made in the color, design, graphics or any other component to create a unique layout.
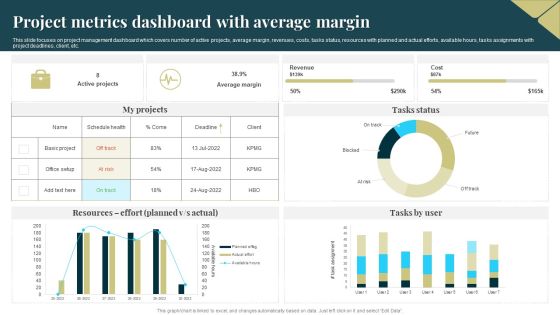
Project Metrics Dashboard With Average Margin Sample PDF
This slide focuses on project management dashboard which covers number of active projects, average margin, revenues, costs, tasks status, resources with planned and actual efforts, available hours, tasks assignments with project deadlines, client, etc. Pitch your topic with ease and precision using this Project Metrics Dashboard With Average Margin Sample PDF. This layout presents information on Average Margin, Revenue, Cost. It is also available for immediate download and adjustment. So, changes can be made in the color, design, graphics or any other component to create a unique layout.

Project Metrics Dashboard With Stages Download PDF
This slide shows the project management dashboard which includes start and end date if project, its duration, status of the project, key project links and project stages with metrics such as proposal, kick off, discovery, actions, optimization , etc. Pitch your topic with ease and precision using this Project Metrics Dashboard With Stages Download PDF. This layout presents information on Economic, Project Plan, Execution. It is also available for immediate download and adjustment. So, changes can be made in the color, design, graphics or any other component to create a unique layout.

Project KPI Dashboard To Monitor Financial Evaluation Background PDF
This slide signifies the construction project management projection plan. It covers information regarding to the estimate ID, Task, effort hours, resource quantity, performance factor and duration evaluation. Pitch your topic with ease and precision using this Project KPI Dashboard To Monitor Financial Evaluation Background PDF. This layout presents information on Actual Expenses, Payable Account, Budget Allocated. It is also available for immediate download and adjustment. So, changes can be made in the color, design, graphics or any other component to create a unique layout.

Digital Marketing Strategy Dashboard To Track Social Media Marketing Campaign Metrics Diagrams PDF
This slide showcases dashboard that can help organization to track the metrics of social media marketing campaign. Its key components are followers, post reach, page impressions, visitors, avg engagement and lifetime views. Retrieve professionally designed Digital Marketing Strategy Dashboard To Track Social Media Marketing Campaign Metrics Diagrams PDF to effectively convey your message and captivate your listeners. Save time by selecting pre-made slideshows that are appropriate for various topics, from business to educational purposes. These themes come in many different styles, from creative to corporate, and all of them are easily adjustable and can be edited quickly. Access them as PowerPoint templates or as Google Slides themes. You dont have to go on a hunt for the perfect presentation because Slidegeeks got you covered from everywhere.

Inbound Marketing Channel KPI Dashboard To Measure Brand Measurement Awareness Pictures PDF
Mentioned slide highlights a inbound marketing dashboard which can be used by managers to measure brand campaign performance. Information covered in this slide is related to total visits, page views, web mentions, social shares, inbound traffic to the company website etc. Pitch your topic with ease and precision using this inbound marketing channel kpi dashboard to measure brand measurement awareness pictures pdf. This layout presents information on inbound marketing channel kpi dashboard to measure brand measurement awareness. It is also available for immediate download and adjustment. So, changes can be made in the color, design, graphics or any other component to create a unique layout.
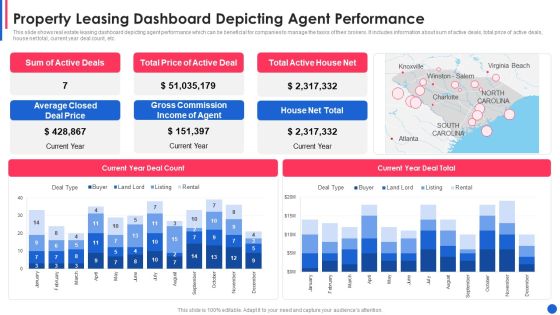
Property Leasing Dashboard Depicting Agent Performance Guidelines PDF
This slide shows real estate leasing dashboard depicting agent performance which can be beneficial for companies to manage the tasks of their brokers. It includes information about sum of active deals, total price of active deals, house net total, current year deal count, etc.Pitch your topic with ease and precision using this property leasing dashboard depicting agent performance guidelines pdf This layout presents information on average closed deal price, gross commission income, total active house net It is also available for immediate download and adjustment. So, changes can be made in the color, design, graphics or any other component to create a unique layout.

HR Budget Vs Actual KPI Dashboard Ppt PowerPoint Presentation File Structure PDF
The given below slide highlights the key metrics of HR budget to manage expense stream and take assist decision making. It includes KPAs such as month wise variations in budget, total amount allocated, actual expenditures etc. Pitch your topic with ease and precision using this HR Budget Vs Actual KPI Dashboard Ppt PowerPoint Presentation File Structure PDF. This layout presents information on Amount Allocated, Expenses by Heads, Budget Achieved. It is also available for immediate download and adjustment. So, changes can be made in the color, design, graphics or any other component to create a unique layout.

Corporate Loan Operations Dashboard For Banks Introduction PDF
This slide displays the dashboard for corporate loan operations management. It include KPIs such as open cases with service level agreements, average open cases by agents, open cases by age, proposed exposure by risk rating, etc. Pitch your topic with ease and precision using this Corporate Loan Operations Dashboard For Banks Introduction PDF. This layout presents information on Proposed Exposure By Risk Rating, Open Cases By Age, Application Pipeline. It is also available for immediate download and adjustment. So, changes can be made in the color, design, graphics or any other component to create a unique layout.
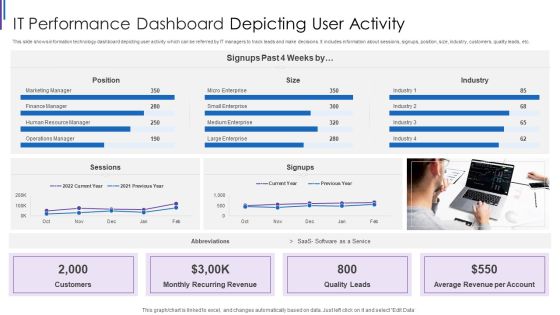
IT Performance Dashboard Depicting User Activity Inspiration PDF
This slide shows information technology dashboard depicting user activity which can be referred by IT managers to track leads and make decisions. It includes information about sessions, signups, position, size, industry, customers, quality leads, etc. Pitch your topic with ease and precision using this IT Performance Dashboard Depicting User Activity Inspiration PDF. This layout presents information on Monthly Recurring Revenue, Average Revenue Per, Account Quality Leads, Customers Position Sessions. It is also available for immediate download and adjustment. So, changes can be made in the color, design, graphics or any other component to create a unique layout.
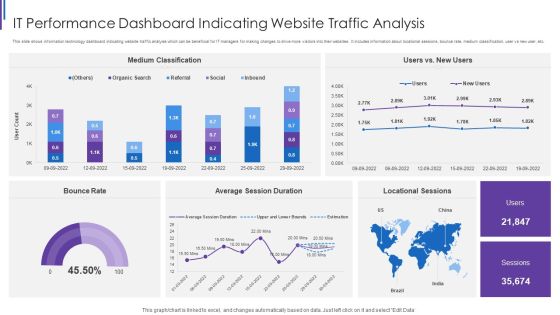
IT Performance Dashboard Indicating Website Traffic Analysis Background PDF
This slide shows information technology dashboard indicating website traffic analysis which can be beneficial for IT managers for making changes to drive more visitors into their websites. It includes information about locational sessions, bounce rate, medium classification, user vs new user, etc. Pitch your topic with ease and precision using this IT Performance Dashboard Indicating Website Traffic Analysis Background PDF. This layout presents information on Medium Classification Rate, Average Session Duration, Locational Sessions Bounce. It is also available for immediate download and adjustment. So, changes can be made in the color, design, graphics or any other component to create a unique layout.

Skill Evaluation Dashboard With Turnover Rate Ideas PDF
Mentioned slide delineates talent assessment dashboard which will assist companies to frame efficient recruitment strategy. This dashboard provides detail information about hiring stats, talent turnover rate, talent rating, fired talents etc.Pitch your topic with ease and precision using this Skill Evaluation Dashboard With Turnover Rate Ideas PDF This layout presents information on Talent Management, Talent Satisfaction, Talent Rating It is also available for immediate download and adjustment. So, changes can be made in the color, design, graphics or any other component to create a unique layout.

Personnel Engagement Measurement Effective Approaches With Statistics Structure PDF
This slide depicts different approaches to measure engagement in employees. It includes engagement surveys, exit interviews, one on ones with managers, performance ratings, first year employees retention rate, retention rate for experience employees, customer satisfaction rates and employee productivity. Pitch your topic with ease and precision using this Personnel Engagement Measurement Effective Approaches With Statistics Structure PDF. This layout presents information on Employees Increases, Person Discussion, Employee Morale. It is also available for immediate download and adjustment. So, changes can be made in the color, design, graphics or any other component to create a unique layout.
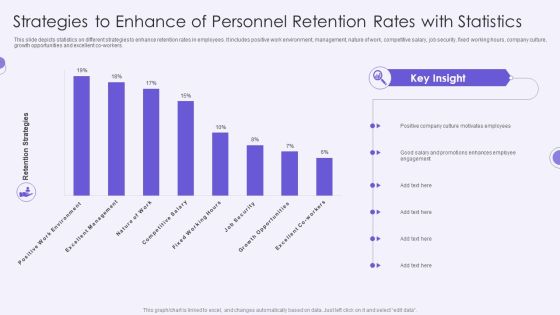
Strategies To Enhance Of Personnel Retention Rates With Statistics Summary PDF
This slide depicts statistics on different strategies to enhance retention rates in employees. It includes positive work environment, management, nature of work, competitive salary, job security, fixed working hours, company culture, growth opportunities and excellent co-workers.Pitch your topic with ease and precision using this Strategies To Enhance Of Personnel Retention Rates With Statistics Summary PDF. This layout presents information on Positive Company, Culture Motivates, Employees Promotions . It is also available for immediate download and adjustment. So, changes can be made in the color, design, graphics or any other component to create a unique layout.
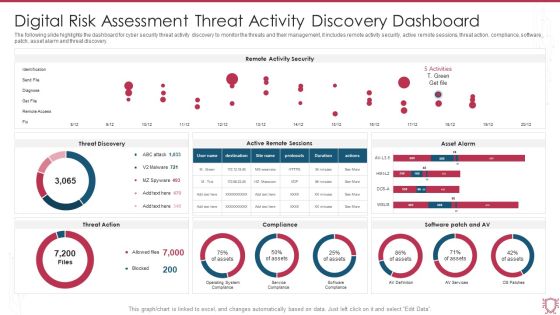
Digital Risk Assessment Threat Activity Discovery Dashboard Ppt Ideas Skills PDF
The following slide highlights the dashboard for cyber security threat activity discovery to monitor the threats and their management, it includes remote activity security, active remote sessions, threat action, compliance, software patch, asset alarm and threat discovery. Pitch your topic with ease and precision using this Digital Risk Assessment Threat Activity Discovery Dashboard Ppt Ideas Skills PDF. This layout presents information on Remote Activity Security, Threat Discovery, Asset Alarm. It is also available for immediate download and adjustment. So, changes can be made in the color, design, graphics or any other component to create a unique layout.
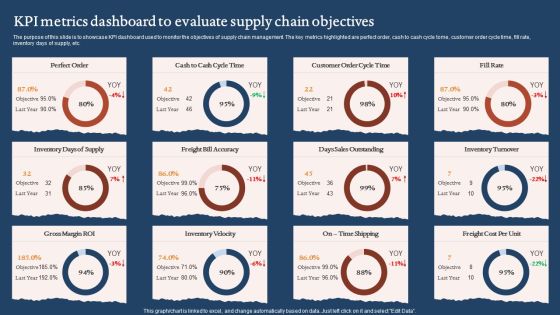
KPI Metrics Dashboard To Evaluate Supply Chain Objectives Graphics PDF
The purpose of this slide is to showcase KPI dashboard used to monitor the objectives of supply chain management. The key metrics highlighted are perfect order, cash to cash cycle tome, customer order cycle time, fill rate, inventory days of supply, etc. Pitch your topic with ease and precision using this KPI Metrics Dashboard To Evaluate Supply Chain Objectives Graphics PDF. This layout presents information on Days Sales Outstanding, Inventory Velocity, Gross Margin Roi. It is also available for immediate download and adjustment. So, changes can be made in the color, design, graphics or any other component to create a unique layout.
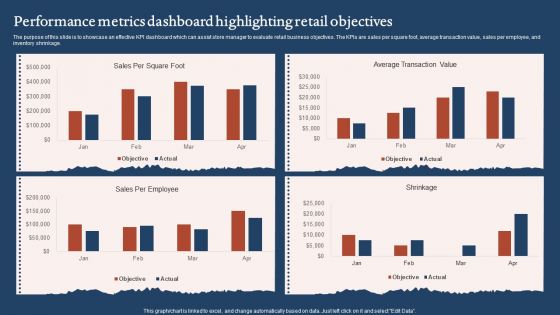
Performance Metrics Dashboard Highlighting Retail Objectives Sample PDF
The purpose of this slide is to showcase an effective KPI dashboard which can assist store manager to evaluate retail business objectives. The KPIs are sales per square foot, average transaction value, sales per employee, and inventory shrinkage. Pitch your topic with ease and precision using this Performance Metrics Dashboard Highlighting Retail Objectives Sample PDF. This layout presents information on Average Transaction Value, Sales Per Employee. It is also available for immediate download and adjustment. So, changes can be made in the color, design, graphics or any other component to create a unique layout.
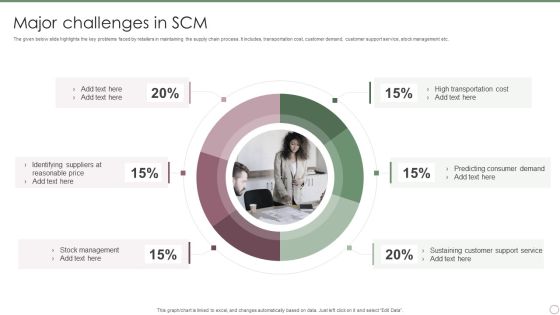
Major Challenges In SCM Ppt PowerPoint Presentation Gallery Pictures PDF
The given below slide highlights the key problems faced by retailers in maintaining the supply chain process. It includes, transportation cost, customer demand, customer support service, stock management etc. Pitch your topic with ease and precision using this Major Challenges In SCM Ppt PowerPoint Presentation Gallery Pictures PDF. This layout presents information on High Transportation Cost, Predicting Consumer Demand, Sustaining Customer, Support Service. It is also available for immediate download and adjustment. So, changes can be made in the color, design, graphics or any other component to create a unique layout.

Quantitative Market Research Survey Results Structure PDF
This slide showcases market survey conducted and data gathered by various people to know the topics that drive better customer engagement. It also covers the location of the users. Pitch your topic with ease and precision using this Quantitative Market Research Survey Results Structure PDF. This layout presents information on Marketing Manager, Customer Support, Data Analyst. It is also available for immediate download and adjustment. So, changes can be made in the color, design, graphics or any other component to create a unique layout.

Dashboard Showing Project Portfolio Metrics Microsoft PDF
This slide shows the dashboard that depicts the project portfolio management which covers the quarterly project delivery roadmap and health card with project funding, resource allocation, portfolio risks such as open change requests, open risks and issues, etc. Pitch your topic with ease and precision using this Dashboard Showing Project Portfolio Metrics Microsoft PDF. This layout presents information on Resource Allocation, Portfolio Risks, Project Funding. It is also available for immediate download and adjustment. So, changes can be made in the color, design, graphics or any other component to create a unique layout.

IT Operations Dashboard For Project Metrics Portrait PDF
This slide focuses on dashboard that provides information about the information technology operations for managing IT project which covers the investments, billed amount, time taken to complete the project, customer satisfaction, monthly expenses, service level agreement status, etc. Pitch your topic with ease and precision using this IT Operations Dashboard For Project Metrics Portrait PDF. This layout presents information on Revenues, Investments, Monthly Expenses. It is also available for immediate download and adjustment. So, changes can be made in the color, design, graphics or any other component to create a unique layout.
Project Metrics Dashboard Depicting Tracking System Inspiration PDF
This slide focuses on project management dashboard which covers the four spirit teams, iteration defects by priority with quarterly roadmap with legends such as high attention, low, none, normal and resolved immediately with time in iteration, etc. Pitch your topic with ease and precision using this Project Metrics Dashboard Depicting Tracking System Inspiration PDF. This layout presents information on Project Metrics, Dashboard Depicting, Tracking System. It is also available for immediate download and adjustment. So, changes can be made in the color, design, graphics or any other component to create a unique layout.

Project Metrics Dashboard With Active Issues Topics PDF
This slide focuses on the project management dashboard which shows the number of active emergency risks and issues, projects, current user count, splitting of project status by priority level, capacity percentage, top recent assignees with open, resolved and closed projects. Pitch your topic with ease and precision using this Project Metrics Dashboard With Active Issues Topics PDF. This layout presents information on Project Metrics, Dashboard With Active Issues. It is also available for immediate download and adjustment. So, changes can be made in the color, design, graphics or any other component to create a unique layout.
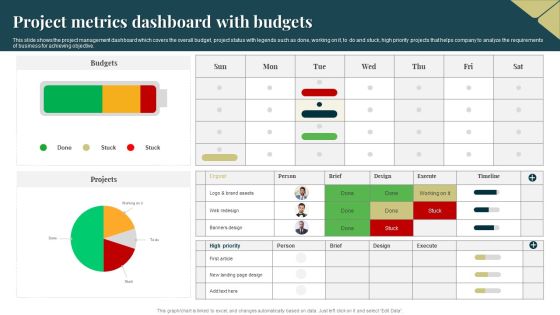
Project Metrics Dashboard With Budgets Topics PDF
This slide shows the project management dashboard which covers the overall budget, project status with legends such as done, working on it, to do and stuck, high priority projects that helps company to analyze the requirements of business for achieving objective. Pitch your topic with ease and precision using this Project Metrics Dashboard With Budgets Topics PDF. This layout presents information on Budgets, Projects, Banners Design. It is also available for immediate download and adjustment. So, changes can be made in the color, design, graphics or any other component to create a unique layout.
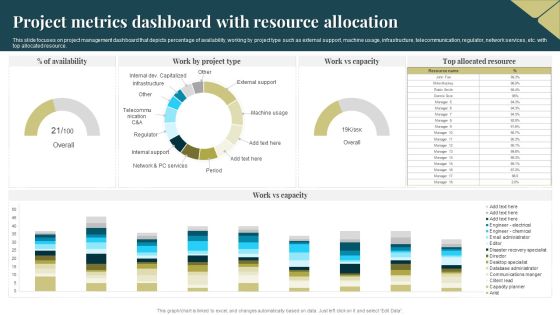
Project Metrics Dashboard With Resource Allocation Portrait PDF
This slide focuses on project management dashboard that depicts percentage of availability, working by project type such as external support, machine usage, infrastructure, telecommunication, regulator, network services, etc. with top allocated resource. Pitch your topic with ease and precision using this Project Metrics Dashboard With Resource Allocation Portrait PDF. This layout presents information on Project Metrics Dashboard, Resource Allocation. It is also available for immediate download and adjustment. So, changes can be made in the color, design, graphics or any other component to create a unique layout.

Project Metrics Dashboard With Team Requests Background PDF
This slide focuses on the project management dashboard which shows the creation of monthly number of requests, requests made by departmental teams, average completion time in days with the number of requests created on week days, etc. Pitch your topic with ease and precision using this Project Metrics Dashboard With Team Requests Background PDF. This layout presents information on Project Metrics Dashboard, Team Requests. It is also available for immediate download and adjustment. So, changes can be made in the color, design, graphics or any other component to create a unique layout.
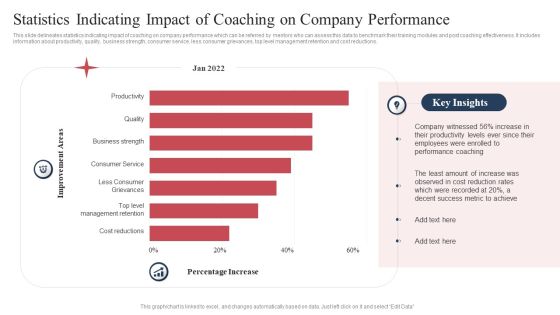
Statistics Indicating Impact Of Coaching On Company Performance Formats PDF
This slide delineates statistics indicating impact of coaching on company performance which can be referred by mentors who can assess this data to benchmark their training modules and post coaching effectiveness. It includes information about productivity, quality, business strength, consumer service, less consumer grievances, top level management retention and cost reductions. Pitch your topic with ease and precision using this Statistics Indicating Impact Of Coaching On Company Performance Formats PDF. This layout presents information on Productivity, Quality, Business Strength. It is also available for immediate download and adjustment. So, changes can be made in the color, design, graphics or any other component to create a unique layout.
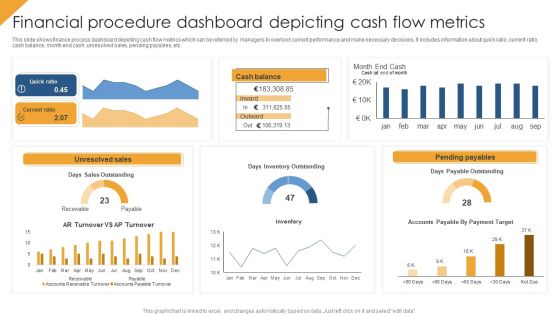
Financial Procedure Dashboard Depicting Cash Flow Metrics Structure PDF
This slide shows finance process dashboard depicting cash flow metrics which can be referred by managers to overlook current performance and make necessary decisions. It includes information about quick ratio, current ratio, cash balance, month end cash, unresolved sales, pending payables, etc. Pitch your topic with ease and precision using this Financial Procedure Dashboard Depicting Cash Flow Metrics Structure PDF. This layout presents information on Quick Ratio, Unresolved Sales, Pending Payables. It is also available for immediate download and adjustment. So, changes can be made in the color, design, graphics or any other component to create a unique layout.

Major Challenges In Implementing IT System Migration Project Ppt PowerPoint Presentation Outline Graphics PDF
The following slide highlights the key challenges faced in implementing it system migration. It includes obstacles such as system knowledge, software configuration, budget and technological constraints etc.Pitch your topic with ease and precision using this Major Challenges In Implementing IT System Migration Project Ppt PowerPoint Presentation Outline Graphics PDF. This layout presents information on Insufficient Understanding, System Features, Project Management. It is also available for immediate download and adjustment. So, changes can be made in the color, design, graphics or any other component to create a unique layout.
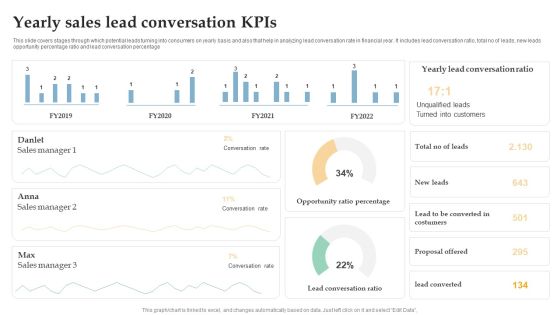
Yearly Sales Lead Conversation Kpis Ppt Inspiration Brochure PDF
This slide covers stages through which potential leads turning into consumers on yearly basis and also that help in analyzing lead conversation rate in financial year. It includes lead conversation ratio, total no of leads, new leads opportunity percentage ratio and lead conversation percentage. Pitch your topic with ease and precision using this Yearly Sales Lead Conversation Kpis Ppt Inspiration Brochure PDF. This layout presents information on Sales Manager, Conversation Rate, Opportunity Ratio Percentage. It is also available for immediate download and adjustment. So, changes can be made in the color, design, graphics or any other component to create a unique layout.

Business Operational Expenditure Dashboard Indicating Revenue And Costs Metrics Pictures PDF
This slide shows operating expenses OPEX dashboard indicating revenue and costs metrics which can be referred by companies to manage various operating expenses of various departments. It contains information about cost center, revenue per company, company code, etc. Pitch your topic with ease and precision using this Business Operational Expenditure Dashboard Indicating Revenue And Costs Metrics Pictures PDF. This layout presents information on Business Operational, Costs Metrics, Revenue. It is also available for immediate download and adjustment. So, changes can be made in the color, design, graphics or any other component to create a unique layout.

Business Threats Landscape Dashboard With Cyber Attacks Analysis Ppt Summary Brochure PDF
This slide illustrates risk landscape dashboard with cyber attacks analysis which contains malware attack frequency, country wise attacks, top 10 attacks, etc. It can assist IT managers in analyzing top threats so that they can be dealt with proper efficiency. Pitch your topic with ease and precision using this Business Threats Landscape Dashboard With Cyber Attacks Analysis Ppt Summary Brochure PDF. This layout presents information on Malware Attack Frequency, Every Minute, Every Second. It is also available for immediate download and adjustment. So, changes can be made in the color, design, graphics or any other component to create a unique layout.

Plastic Waste Recycling Statistics Based On Compound Annual Growth Rate Inspiration PDF
This slide covers statistics based on top countries contribution in plastic recycling and waste management. It includes report from period 2019-2025 with insights based on CAGR. Pitch your topic with ease and precision using this Plastic Waste Recycling Statistics Based On Compound Annual Growth Rate Inspiration PDF. This layout presents information on Contributes Maximum, 2015 To 2025. It is also available for immediate download and adjustment. So, changes can be made in the color, design, graphics or any other component to create a unique layout.
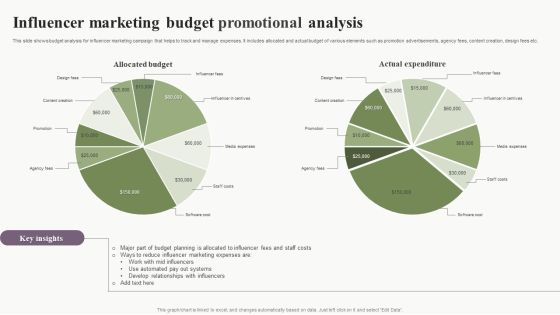
Influencer Marketing Budget Promotional Analysis Download PDF
This slide shows budget analysis for influencer marketing campaign that helps to track and manage expenses. It includes allocated and actual budget of various elements such as promotion advertisements, agency fees, content creation, design fees etc. Pitch your topic with ease and precision using this Influencer Marketing Budget Promotional Analysis Download PDF. This layout presents information on Influencer Marketing, Budget Promotional Analysis. It is also available for immediate download and adjustment. So, changes can be made in the color, design, graphics or any other component to create a unique layout.
Robotic Process Automation Metrics Dashboard For Tracking Business Return On Investment Information PDF
This slide illustrates KPI Dashboard for measuring time and money saved after RPA deployment. It also include metrics for analysis such as productivity in robot hours, hours saved per process, money saved per process, etc. Pitch your topic with ease and precision using this Robotic Process Automation Metrics Dashboard For Tracking Business Return On Investment Information PDF. This layout presents information on Management, Goal, Productivity. It is also available for immediate download and adjustment. So, changes can be made in the color, design, graphics or any other component to create a unique layout.
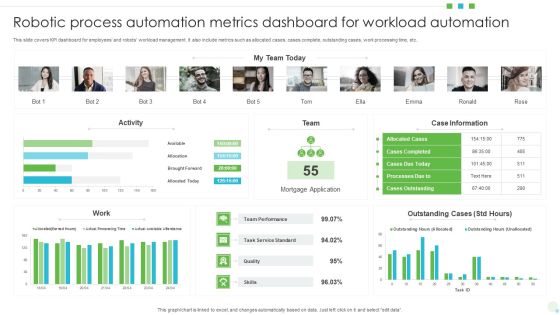
Robotic Process Automation Metrics Dashboard For Workload Automation Mockup PDF
This slide covers KPI dashboard for employees and robots workload management. It also include metrics such as allocated cases, cases complete, outstanding cases, work processing time, etc. Pitch your topic with ease and precision using this Robotic Process Automation Metrics Dashboard For Workload Automation Mockup PDF. This layout presents information on Mortgage Application, Team Performance, Case Information. It is also available for immediate download and adjustment. So, changes can be made in the color, design, graphics or any other component to create a unique layout.
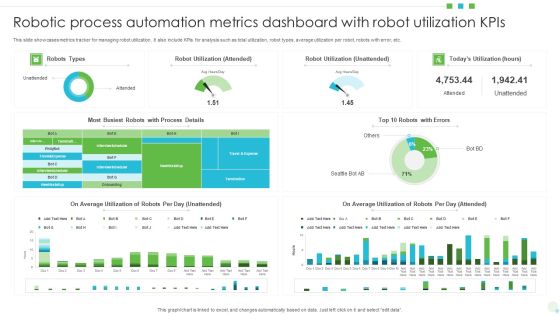
Robotic Process Automation Metrics Dashboard With Robot Utilization Kpis Background PDF
This slide showcases metrics tracker for managing robot utilization. It also include KPIs for analysis such as total utilization, robot types, average utilization per robot, robots with error, etc. Pitch your topic with ease and precision using this Robotic Process Automation Metrics Dashboard With Robot Utilization Kpis Background PDF. This layout presents information on Average Utilization, Robot Utilization, Automation Metrics Dashboard. It is also available for immediate download and adjustment. So, changes can be made in the color, design, graphics or any other component to create a unique layout.

Employee Recruitment Analysis KPI Dashboard Slides PDF
The following slide presents a hiring assessment dashboard to manage HR metrics. It includes KPIs such as average time taken, cost required in hiring process along with the major sources of recruitment etc. Pitch your topic with ease and precision using this Employee Recruitment Analysis KPI Dashboard Slides PDF. This layout presents information on Agile Hiring, Non Agile Hiring, Hiring Cost Assessment. It is also available for immediate download and adjustment. So, changes can be made in the color, design, graphics or any other component to create a unique layout.

Dashboard To Depict Robot Utilization In Robotic Desktop Automation Download PDF
This slide consists of a Dashboard which can be used by managers to depict robot utilization in attended automation. Key performance indicators relate to total utilization, robot types, hours saved etc. Pitch your topic with ease and precision using this Dashboard To Depict Robot Utilization In Robotic Desktop Automation Download PDF. This layout presents information on Dashboard, Depict Robot Utilization, Robotic Desktop Automation. It is also available for immediate download and adjustment. So, changes can be made in the color, design, graphics or any other component to create a unique layout.

Employee Overall Performance Progress Scorecard Sample PDF
This slide covers overall performance score of employee appraised by reporting manager. It includes scores based on metrics such as departmental performance, downtime, efficiency, setup. Utilization, quality failures as per goals, actual output etc. Pitch your topic with ease and precision using this Employee Overall Performance Progress Scorecard Sample PDF. This layout presents information on Employee Performance, Progress Scorecard. It is also available for immediate download and adjustment. So, changes can be made in the color, design, graphics or any other component to create a unique layout.

KPI Dashboard For Modernizing Hospitality Business Inspiration PDF
The following slide showcases dashboard to track data and perform analytics for managing staff, ordering supplies and to maintain customer satisfaction. It presents information related to expenses, sales, etc. Pitch your topic with ease and precision using this KPI Dashboard For Modernizing Hospitality Business Inspiration PDF. This layout presents information on Fiscal Year, Labor, Modernizing Hospitality. It is also available for immediate download and adjustment. So, changes can be made in the color, design, graphics or any other component to create a unique layout.

Dashboard For Assessing Project Team Productivity Report Mockup PDF
This slide depicts a dashboard for monitoring team productivity reports in project management. It covers various areas such as billing by the consumer, productivity reports, employee billable hours, etc. Pitch your topic with ease and precision using this Dashboard For Assessing Project Team Productivity Report Mockup PDF. This layout presents information on Billing Expense Customer, Employee Productivity Report, Profitability Customer. It is also available for immediate download and adjustment. So, changes can be made in the color, design, graphics or any other component to create a unique layout.

Company Payout Dashboard Representing Accounts Payable Data Introduction PDF
The slide demonstrates a payment dashboard to measure and manage accounts payable. Various elements included are payable account, overdue, cash on hand, accounts payable funnel, invoice status, etc. Pitch your topic with ease and precision using this Company Payout Dashboard Representing Accounts Payable Data Introduction PDF. This layout presents information on Payable Accounts, Overdue, Invoices By Status, Account Payable Age. It is also available for immediate download and adjustment. So, changes can be made in the color, design, graphics or any other component to create a unique layout.

Buyer Marketing Campaign Performance Dashboard Download PDF
Following dashboard depicts shopper marketing dashboard which can be used by managers to assess the performance of their campaigns. The key performance indicators are total customers, countries, website views, total campaigns, email sent, website traffic source etc. Pitch your topic with ease and precision using this Buyer Marketing Campaign Performance Dashboard Download PDF. This layout presents information on Total Customers, Countries, Website Views. It is also available for immediate download and adjustment. So, changes can be made in the color, design, graphics or any other component to create a unique layout.

Sample Restaurant Survey Feedback Example Questionnaire Result Report Survey SS
Following slides demonstrates sample questionnaire for hotel feedback which can be used by hotel managers to determine customer service improvement areas. It includes key elements such as purpose of hotel trip, check in experience, satisfaction with hotel cleanliness, and staff behaviour. Pitch your topic with ease and precision using this Sample Restaurant Survey Feedback Example Questionnaire Result Report Survey SS. This layout presents information on Maintenance, Staff Hospitality, Cleanliness Services . It is also available for immediate download and adjustment. So, changes can be made in the color, design, graphics or any other component to create a unique layout.

Research Survey Summary Report To Determine Business Marketing Efforts Survey SS
Following slide demonstrates summary result of marketing research survey conducted by marketing manager to determine brand position in market. It includes elements such as customer awareness about brand and product usage by customer. Pitch your topic with ease and precision using this Research Survey Summary Report To Determine Business Marketing Efforts Survey SS. This layout presents information on Brand Awareness, Probability. It is also available for immediate download and adjustment. So, changes can be made in the color, design, graphics or any other component to create a unique layout.
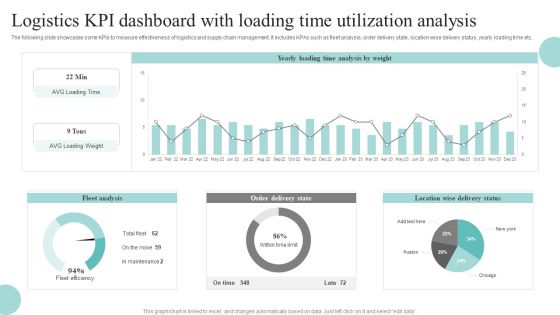
Logistics KPI Dashboard With Loading Time Utilization Analysis Download PDF
The following slide showcases some KPIs to measure effectiveness of logistics and supply chain management. It includes KPAs such as fleet analysis, order delivery state, location wise delivery status, yearly loading time etc. Pitch your topic with ease and precision using this Logistics KPI Dashboard With Loading Time Utilization Analysis Download PDF. This layout presents information on Fleet Analysis, Order Delivery State, Location Wise Delivery Status. It is also available for immediate download and adjustment. So, changes can be made in the color, design, graphics or any other component to create a unique layout.

Ad Campaign Dashboard New Product Release Strategy Guidelines PDF
This slide depicts advertisement campaign dashboard used by fintech company managers to track effectiveness of the campaign for new product launch. The key performance indicators are ad cost, total clicks, total impressions, ad impressions etc. Pitch your topic with ease and precision using this Ad Campaign Dashboard New Product Release Strategy Guidelines PDF. This layout presents information on Impressions, Conversion, Strategy. It is also available for immediate download and adjustment. So, changes can be made in the color, design, graphics or any other component to create a unique layout.
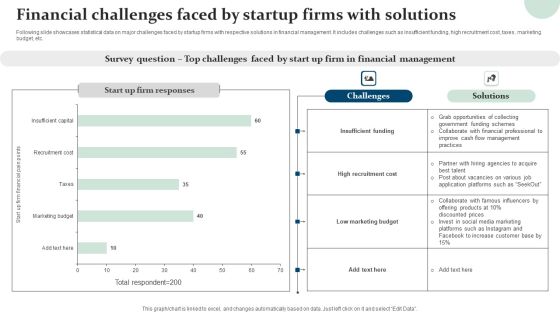
Financial Challenges Faced By Startup Firms With Solutions Slides PDF
Following slide showcases statistical data on major challenges faced by startup firms with respective solutions in financial management. It includes challenges such as insufficient funding, high recruitment cost, taxes, marketing budget, etc. Pitch your topic with ease and precision using this Financial Challenges Faced By Startup Firms With Solutions Slides PDF. This layout presents information on Insufficient Funding, High Recruitment Cost, Low Marketing Budget. It is also available for immediate download and adjustment. So, changes can be made in the color, design, graphics or any other component to create a unique layout.

Customer Decline Of Sales Analysis Dashboard Rules PDF
The following slide presents a key performance indicating dashboards that can be used by managers in order to analyse customer-lost sales. Major key performance indicators are lost deals rate, lost sales rate, customer data analytics, etc. Pitch your topic with ease and precision using this Customer Decline Of Sales Analysis Dashboard Rules PDF. This layout presents information on Customer Data Analytics. It is also available for immediate download and adjustment. So, changes can be made in the color, design, graphics or any other component to create a unique layout.
Email Advertising Report Growth Dashboard Formats PDF
This slide dashboard is helpful for managers, executives, and stakeholders to display the effectiveness of an email marketing strategy. It includes active accounts, deleted accounts, and unsubscribed accounts in a month and a year. Pitch your topic with ease and precision using this Email Advertising Report Growth Dashboard Formats PDF. This layout presents information on Email Advertising, Report Growth Dashboard . It is also available for immediate download and adjustment. So, changes can be made in the color, design, graphics or any other component to create a unique layout.

Dashboard To Track Effectiveness Of Owned Media Marketing Structure PDF
This slide illustrates a dashboard which can be used by brand managers to track the effectiveness of earned media in the domain of digital marketing. The key elements include brand mentions, social media reach, customer interactions, positive and negative feedback Pitch your topic with ease and precision using this Dashboard To Track Effectiveness Of Owned Media Marketing Structure PDF. This layout presents information on Brand Mentions, Social Media, Marketing. It is also available for immediate download and adjustment. So, changes can be made in the color, design, graphics or any other component to create a unique layout.

Country Wise Data Of Average Duration Of Hospital Stay After Giving Birth Designs PDF
This slide showcases the average length of hospital stay based on the diagnosis to understand issues and enhance patient acute care management. It also includes the length of womens hospital stays in different nations. Pitch your topic with ease and precision using this Country Wise Data Of Average Duration Of Hospital Stay After Giving Birth Designs PDF. This layout presents information on Country Wise Data, Average Duration. It is also available for immediate download and adjustment. So, changes can be made in the color, design, graphics or any other component to create a unique layout.
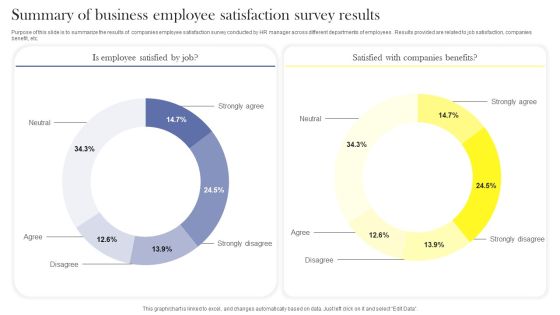
Summary Of Business Employee Satisfaction Survey Results Survey SS
Purpose of this slide is to summarize the results of companies employee satisfaction survey conducted by HR manager across different departments of employees . Results provided are related to job satisfaction, companies benefit, etc. Pitch your topic with ease and precision using this Summary Of Business Employee Satisfaction Survey Results Survey SS. This layout presents information on Neutral, Strongly Agree, Strongly Disagree, Disagree, Agree. It is also available for immediate download and adjustment. So, changes can be made in the color, design, graphics or any other component to create a unique layout.

Data Security And Privacy Audit Questionnaire Overview Report Survey SS
Following slides demonstrates data security evaluation summary report which can be used by business to reduce data hacking. It includes elements such as data security tools, budget allocation on tools, satisfaction level with tools, etc. Pitch your topic with ease and precision using this Data Security And Privacy Audit Questionnaire Overview Report Survey SS. This layout presents information on Data Security Tools, Budget Allocated, Tools Performance, Data Security Tools Management. It is also available for immediate download and adjustment. So, changes can be made in the color, design, graphics or any other component to create a unique layout.
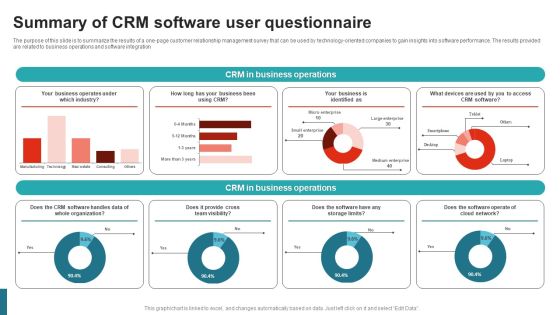
Summary Of CRM Software User Questionnaire Survey SS
The purpose of this slide is to summarize the results of a one-page customer relationship management survey that can be used by technology-oriented companies to gain insights into software performance. The results provided are related to business operations and software integration. Pitch your topic with ease and precision using this Summary Of CRM Software User Questionnaire Survey SS. This layout presents information on CRM In Business Operations, Industry, Cloud Network, Team Visibility. It is also available for immediate download and adjustment. So, changes can be made in the color, design, graphics or any other component to create a unique layout.

Summary Of New Product Launch Feedback Questionnaire Survey SS
The purpose of this slide is to summarize the results of a one-page survey that can be used by product developers and business managers to gain insights from customers. The results provided are related to customer information and product usage. Pitch your topic with ease and precision using this Summary Of New Product Launch Feedback Questionnaire Survey SS. This layout presents information on Customer Information, Product Usage, Occupation, Value For Money, Product Quality. It is also available for immediate download and adjustment. So, changes can be made in the color, design, graphics or any other component to create a unique layout.
Supplier Compensation Due Tracking Dashboard With Paid Invoices Topics PDF
This slide showcases dashboard that can help organization to track the outstanding payment of different vendors and take timely action in case of delay. Its key elements are due by age summary, top 5 vendor by purchases, top 5 vendors by amount due and total invoice vs paid invoices. Pitch your topic with ease and precision using this supplier compensation due tracking dashboard with paid invoices topics pdf. This layout presents information on supplier compensation due tracking dashboard with paid invoices. It is also available for immediate download and adjustment. So, changes can be made in the color, design, graphics or any other component to create a unique layout.

Cyber Phishing Scams And Attacks Dashboard With Improvement Curve Sample PDF
Mentioned slide showcases a comprehensive dashboard used to measure the cyber phishing attacks. Information covered in this slide is related to organization health risk, attack vendors, most vulnerable employees to attacks, improvement curve. Pitch your topic with ease and precision using this cyber phishing scams and attacks dashboard with improvement curve sample pdf. This layout presents information on cyber phishing scams and attacks dashboard with improvement curve. It is also available for immediate download and adjustment. So, changes can be made in the color, design, graphics or any other component to create a unique layout.
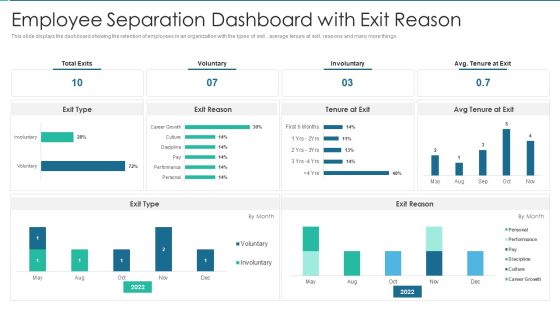
Employee Separation Dashboard With Exit Reason Rules PDF
This slide displays the dashboard showing the retention of employees in an organization with the types of exit , average tenure at exit, reasons and many more things. Pitch your topic with ease and precision using this Employee Separation Dashboard With Exit Reason Rules PDF This layout presents information on Employee Separation Dashboard With Exit Reason It is also available for immediate download and adjustment. So, changes can be made in the color, design, graphics or any other component to create a unique layout.
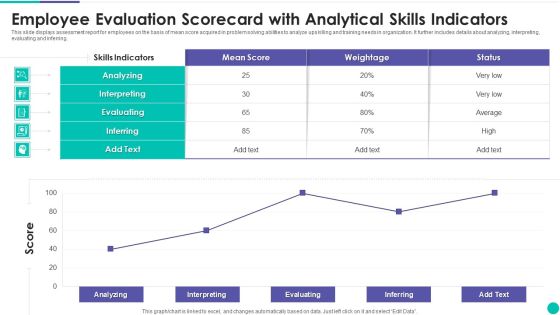
Employee Evaluation Scorecard With Analytical Skills Indicators Clipart PDF
This slide displays assessment report for employees on the basis of mean score acquired in problem solving abilities to analyze upskilling and training needs in organization. It further includes details about analyzing, interpreting, evaluating and inferring. Pitch your topic with ease and precision using this Employee Evaluation Scorecard With Analytical Skills Indicators Clipart PDF. This layout presents information on Analyzing, Interpreting, Evaluating. It is also available for immediate download and adjustment. So, changes can be made in the color, design, graphics or any other component to create a unique layout.
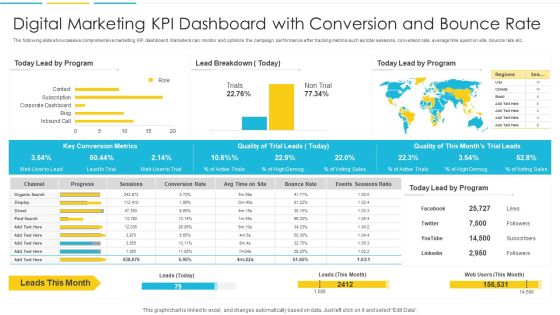
Digital Marketing KPI Dashboard With Conversion And Bounce Rate Introduction PDF
The following slide showcases a comprehensive marketing KPI dashboard. Marketers can monitor and optimize the campaign performance after tracking metrics such as total sessions, conversion rate, average time spent on site, bounce rate etc. Pitch your topic with ease and precision using this Digital Marketing KPI Dashboard With Conversion And Bounce Rate Introduction PDF. This layout presents information on Organic, Progress, Conversion Rate. It is also available for immediate download and adjustment. So, changes can be made in the color, design, graphics or any other component to create a unique layout

KPI Dashboard Highlighting Results Of SEO Campaign Topics PDF
The following slide showcases marketing KPI dashboard which shows the performance measuring metrics of SEO campaign. The metrics covered in the slide are most viewed pages from SEO, most search engines used, traffic type, top known keywords etc. Pitch your topic with ease and precision using this KPI Dashboard Highlighting Results Of SEO Campaign Topics PDF. This layout presents information on Search Engines, Traffic, Organic. It is also available for immediate download and adjustment. So, changes can be made in the color, design, graphics or any other component to create a unique layout.
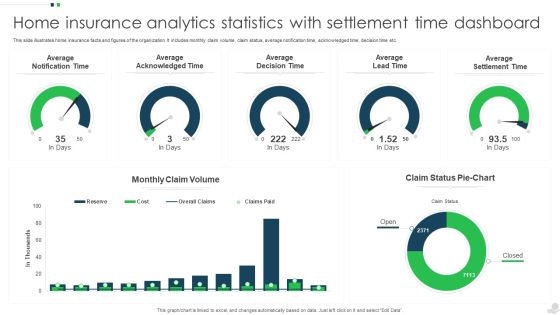
Home Insurance Analytics Statistics With Settlement Time Dashboard Ideas PDF
This slide illustrates home insurance facts and figures of the organization. It includes monthly claim volume, claim status, average notification time, acknowledged time, decision time etc. Pitch your topic with ease and precision using this Home Insurance Analytics Statistics With Settlement Time Dashboard Ideas PDF. This layout presents information on Average Acknowledged Time, Average Decision Time, Average Lead Time. It is also available for immediate download and adjustment. So, changes can be made in the color, design, graphics or any other component to create a unique layout.

Yearly Saas Cloud Security Expenditure Analysis Ppt PowerPoint Presentation File Deck PDF
The following slide depicts the annual spending of organizations on SaaS security services to prevent data breaches. It constitutes of graph representing the varying expenditure based of the size of the company. Pitch your topic with ease and precision using this Yearly Saas Cloud Security Expenditure Analysis Ppt PowerPoint Presentation File Deck PDF. This layout presents information on Saas Investment, Employees. It is also available for immediate download and adjustment. So, changes can be made in the color, design, graphics or any other component to create a unique layout.
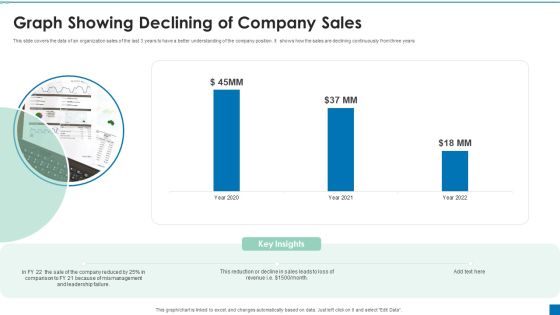
Graph Showing Declining Of Company Sales Ppt PowerPoint Presentation Portfolio Graphics Example PDF
This slide covers the data of an organization sales of the last 3 years to have a better understanding of the company position. It shows how the sales are declining continuously from three years.Pitch your topic with ease and precision using this Graph Showing Declining Of Company Sales Ppt PowerPoint Presentation Portfolio Graphics Example PDF. This layout presents information on Reduction Decline, Comparison, Mismanagement. It is also available for immediate download and adjustment. So, changes can be made in the color, design, graphics or any other component to create a unique layout.

B2B Market Segmentation Dashboard Microsoft PDF
This slide illustrates the market segmentation dashboard for B2B which can benefit them to improve the focus and boost the revenue of the organization. It includes segmentation based in company size and different industries under B2B market. Pitch your topic with ease and precision using this B2B Market Segmentation Dashboard Microsoft PDF. This layout presents information on Industries, Market Segmentation, Service. It is also available for immediate download and adjustment. So, changes can be made in the color, design, graphics or any other component to create a unique layout.

Annual Human Resource Report With Employee Hiring And Promotion Graph Mockup PDF
This slide showcases HR report and graph that can help organization to identify number of of employees demoted and promoted in the company. It showcases comparison for a period of last three years. Pitch your topic with ease and precision using this Annual Human Resource Report With Employee Hiring And Promotion Graph Mockup PDF. This layout presents information on Technology, Product, Employees. It is also available for immediate download and adjustment. So, changes can be made in the color, design, graphics or any other component to create a unique layout.

Critical Statistics Of Blockchain And Distributed Ledger Technology Market Structure PDF
Mentioned slide highlights various insights of blockchain technology market. This slide shows key statistics about blockchain market outlook, blockchain spenders worldwide and by country. Organization can decide if embracing the technology is the right move for company using these statistics. Pitch your topic with ease and precision using this Critical Statistics Of Blockchain And Distributed Ledger Technology Market Structure PDF. This layout presents information on USA Contribution, Projected Blockchain, Market Value. It is also available for immediate download and adjustment. So, changes can be made in the color, design, graphics or any other component to create a unique layout.

Dashboard For Customer Satisfaction Survey Outcome Results Topics PDF
This slide showcases outcome of customer satisfaction survey that can help organization to gain insight about customer requirements and implement strategies to reduce customer churn rate in future. It also showcases product recommendation and improvement feedback from customers. Pitch your topic with ease and precision using this Dashboard For Customer Satisfaction Survey Outcome Results Topics PDF. This layout presents information on Dashboard, Customer Satisfaction, Survey Outcome Results. It is also available for immediate download and adjustment. So, changes can be made in the color, design, graphics or any other component to create a unique layout.

Customer Service Metrics Dashboard With Average First Response Time Background PDF
This slide showcases Dashboard for Customer Service metrics that can help organization to easily identify the key pain points of your customers, areas which need additional resources and support agents that can benefit from additional training. It also showcases performance of top and bottom 5 call support agents. Pitch your topic with ease and precision using this Customer Service Metrics Dashboard With Average First Response Time Background PDF. This layout presents information on Average, Abandon Rate, Contact Resolution. It is also available for immediate download and adjustment. So, changes can be made in the color, design, graphics or any other component to create a unique layout.

Three Key Workplace Trend Statistics For Staff Slides PDF
This slide represents the organization trends for understanding the initiatives that are shifting the company. It includes effect of positive workplace, reasons of increased interest in remote area, etc. Pitch your topic with ease and precision using this Three Key Workplace Trend Statistics For Staff Slides PDF. This layout presents information on Workplace Environment, Greater Profitability, Customer. It is also available for immediate download and adjustment. So, changes can be made in the color, design, graphics or any other component to create a unique layout.
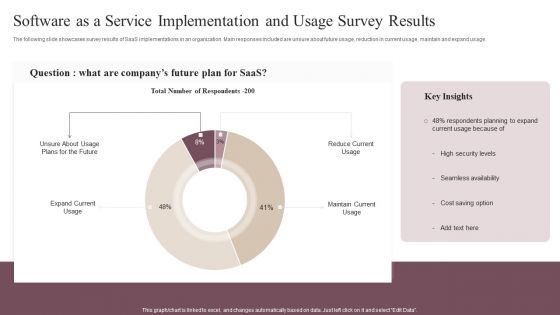
Software As A Service Implementation And Usage Survey Results Clipart PDF
The following slide showcases survey results of SaaS implementations in an organization. Main responses included are unsure about future usage, reduction in current usage, maintain and expand usage. Pitch your topic with ease and precision using this Software As A Service Implementation And Usage Survey Results Clipart PDF. This layout presents information on Reduce Current Usage, Maintain Current Usage, Expand Current Usage . It is also available for immediate download and adjustment. So, changes can be made in the color, design, graphics or any other component to create a unique layout.
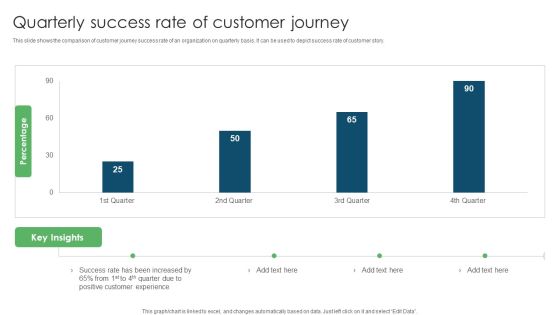
Quarterly Success Rate Of Customer Journey Ppt PowerPoint Presentation Outline Mockup PDF
This slide shows the comparison of customer journey success rate of an organization on quarterly basis. It can be used to depict success rate of customer story. Pitch your topic with ease and precision using this Quarterly Success Rate Of Customer Journey Ppt PowerPoint Presentation Outline Mockup PDF. This layout presents information on Success Rate, Increased Positive, Customer Experience. It is also available for immediate download and adjustment. So, changes can be made in the color, design, graphics or any other component to create a unique layout.
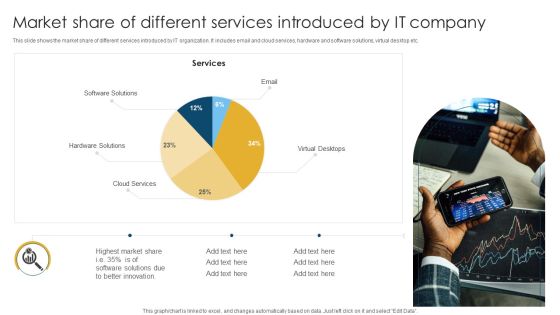
Market Share Of Different Services Introduced By IT Company Download PDF
This slide shows the market share of different services introduced by IT organization. It includes email and cloud services, hardware and software solutions, virtual desktop etc. Pitch your topic with ease and precision using this Market Share Of Different Services Introduced By IT Company Download PDF. This layout presents information on Software Solutions, Hardware Solutions, Highest Market. It is also available for immediate download and adjustment. So, changes can be made in the color, design, graphics or any other component to create a unique layout.

Global Bio Baby Food Marketplace Analysis Ppt Ideas Gallery PDF
This slide covers analysis of organic baby food market. It includes analysis based on details such as product types and distribution channels for prepared baby food, dried food, and infant milk formula along with sales forecast. Pitch your topic with ease and precision using this Global Bio Baby Food Marketplace Analysis Ppt Ideas Gallery PDF. This layout presents information on Product Types, Distribution Channel Types, USD Million. It is also available for immediate download and adjustment. So, changes can be made in the color, design, graphics or any other component to create a unique layout.
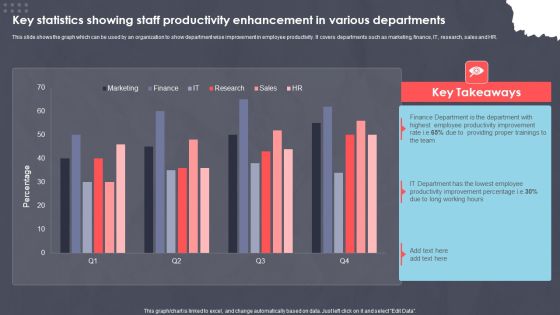
Key Statistics Showing Staff Productivity Enhancement In Various Departments Ppt PowerPoint Presentation Slides Portrait PDF
This slide shows the graph which can be used by an organization to show department wise improvement in employee productivity. It covers departments such as marketing, finance, IT, research, sales and HR. Pitch your topic with ease and precision using this Key Statistics Showing Staff Productivity Enhancement In Various Departments Ppt PowerPoint Presentation Slides Portrait PDF. This layout presents information on XXXXXXXXXXXXXXXXXXXXXXXXX. It is also available for immediate download and adjustment. So, changes can be made in the color, design, graphics or any other component to create a unique layout.
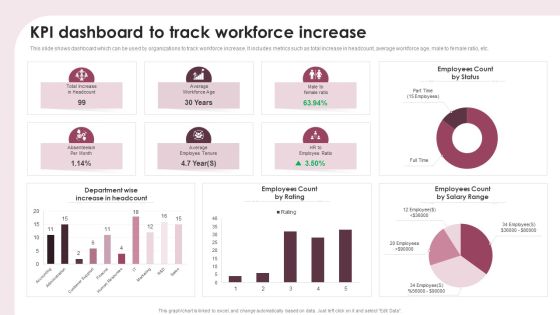
KPI Dashboard To Track Workforce Increase Ppt Show Portfolio PDF
This slide shows dashboard which can be used by organizations to track workforce increase. It includes metrics such as total increase in headcount, average workforce age, male to female ratio, etc. Pitch your topic with ease and precision using this KPI Dashboard To Track Workforce Increase Ppt Show Portfolio PDF. This layout presents information on Department Wise, Increase Headcount, Employees Count Rating. It is also available for immediate download and adjustment. So, changes can be made in the color, design, graphics or any other component to create a unique layout.

Employee Headcount Analysis On The Basis Of Employees Age Ppt PowerPoint Presentation Model Ideas PDF
This slide shows the age wise headcount analysis of employees in the organization. It include various age groups such as 20 25, 25 30, 30 35, etc.Pitch your topic with ease and precision using this Employee Headcount Analysis On The Basis Of Employees Age Ppt PowerPoint Presentation Model Ideas PDF. This layout presents information on Employee Headcount, Analysis Basis, Employees Age. It is also available for immediate download and adjustment. So, changes can be made in the color, design, graphics or any other component to create a unique layout.

International Business Revenue And Earning Potential Guidelines PDF
This slide illustrates finding profit potential from evaluation of international business done by the corporation. It includes international business revenue share percent, international business revenue in USD BB, share of group revenues etc. Pitch your topic with ease and precision using this International Business Revenue And Earning Potential Guidelines PDF. This layout presents information on Potential Organic Growth, Supply Chain. It is also available for immediate download and adjustment. So, changes can be made in the color, design, graphics or any other component to create a unique layout.

Monthly Email Communication Kpis And Dashboard Download PDF
This slide showcases dashboard for email communication KPIs that can help organization to analyze the reach and average response time of customers. Its key elements are send messages, recipients, received messages, senders and monthly email distribution. Pitch your topic with ease and precision using this Monthly Email Communication Kpis And Dashboard Download PDF. This layout presents information on Sent Messages, Recipients, Average Response Time, Received Message. It is also available for immediate download and adjustment. So, changes can be made in the color, design, graphics or any other component to create a unique layout.

Improving Effective Human Resource Communication Impact On Employee Engagement Dashboard Slides PDF
This slide shows the dashboard representing the impact of effective hr communication within the organization on employee engagement score. It shows details related to engagement score, response rate, engagement score of teams, net promoter score etc. Pitch your topic with ease and precision using this Improving Effective Human Resource Communication Impact On Employee Engagement Dashboard Slides PDF. This layout presents information on Engagement Score, Response Rate, Engagement Score Levels. It is also available for immediate download and adjustment. So, changes can be made in the color, design, graphics or any other component to create a unique layout.
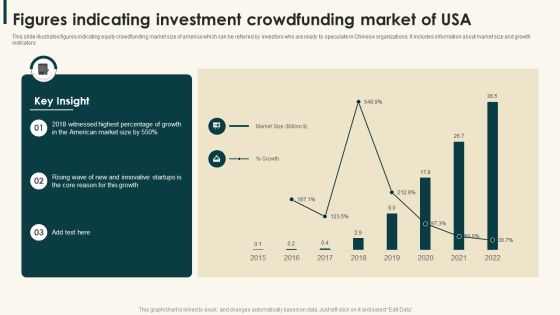
Figures Indicating Investment Crowdfunding Market Of Usa Information PDF
This slide illustrates figures indicating equity crowdfunding market size of america which can be referred by investors who are ready to speculate in Chinese organizations. It includes information about market size and growth indicators,Pitch your topic with ease and precision using this Figures Indicating Investment Crowdfunding Market Of Usa Information PDF. This layout presents information on Witnessed Highest, American Market, Innovative Startups. It is also available for immediate download and adjustment. So, changes can be made in the color, design, graphics or any other component to create a unique layout.

Promotion Strategies For New Service Launch Global Market Sizing For New Service Infographics PDF
This slide showcases market sizing that can help organization to estimate the profit and revenue potential before launching new service. Its key components are market size, estimated growth and target market. Take your projects to the next level with our ultimate collection of Promotion Strategies For New Service Launch Global Market Sizing For New Service Infographics PDF. Slidegeeks has designed a range of layouts that are perfect for representing task or activity duration, keeping track of all your deadlines at a glance. Tailor these designs to your exact needs and give them a truly corporate look with your own brand colors they will make your projects stand out from the rest.

Strategic Performance Analysis Tools Survey Microsoft PDF
This slide showcase survey result of 300 professional organization using strategic performance measurement tools. It includes elements such as key performance indicators, performance appraisal method, six sigma method, 360 degree feedback etc. Pitch your topic with ease and precision using this Strategic Performance Analysis Tools Survey Microsoft PDF. This layout presents information on Strategic Performance, Analysis Tools Survey. It is also available for immediate download and adjustment. So, changes can be made in the color, design, graphics or any other component to create a unique layout.

KPI Dashboard To Track E Commerce Business Revenue Analysis Rules PDF
This slide shows dashboard which can be used by organizations to monitor ecommerce revenue analysis. It includes metrics such as orders, purchases, delivery status etc. Pitch your topic with ease and precision using this KPI Dashboard To Track E Commerce Business Revenue Analysis Rules PDF. This layout presents information on Total Purchases, Total Sales, Pending Delivery, Collection. It is also available for immediate download and adjustment. So, changes can be made in the color, design, graphics or any other component to create a unique layout.
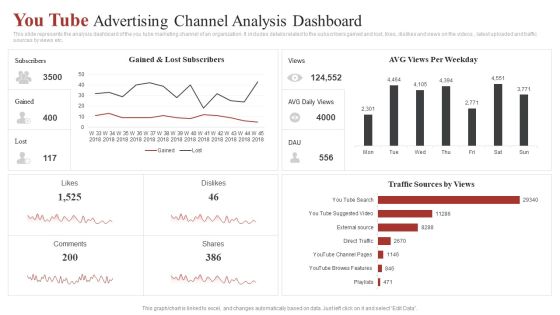
You Tube Advertising Channel Analysis Dashboard Ppt Gallery Clipart Images PDF
This slide represents the analysis dashboard of the you tube marketing channel of an organization. It includes details related to the subscribers gained and lost, likes, dislikes and views on the videos , latest uploaded and traffic sources by views etc. Pitch your topic with ease and precision using this You Tube Advertising Channel Analysis Dashboard Ppt Gallery Clipart Images PDF. This layout presents information on AVG Views, Per Weekday, Traffic Sources Views . It is also available for immediate download and adjustment. So, changes can be made in the color, design, graphics or any other component to create a unique layout.
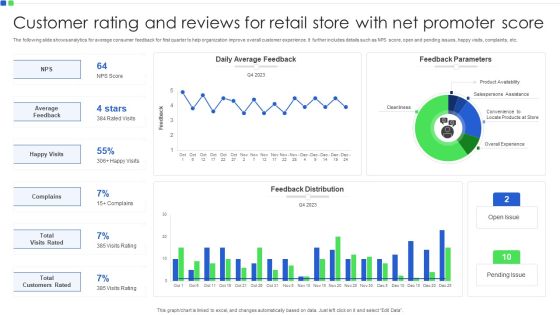
Customer Rating And Reviews For Retail Store With Net Promoter Score Demonstration PDF
The following slide shows analytics for average consumer feedback for first quarter to help organization improve overall customer experience. It further includes details such as NPS score, open and pending issues, happy visits, complaints, etc. Pitch your topic with ease and precision using this Customer Rating And Reviews For Retail Store With Net Promoter Score Demonstration PDF. This layout presents information on Average Feedback, Happy Visits, Complains. It is also available for immediate download and adjustment. So, changes can be made in the color, design, graphics or any other component to create a unique layout.
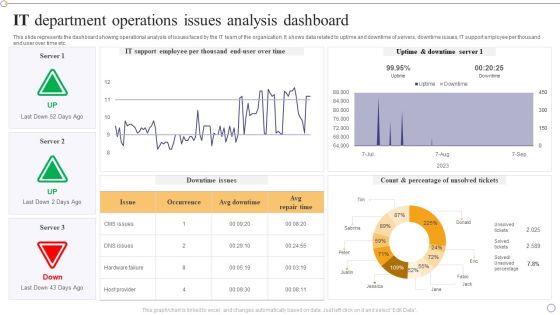
IT Department Operations Issues Analysis Dashboard Designs PDF
This slide represents the dashboard showing operational analysis of issues faced by the IT team of the organization. It shows data related to uptime and downtime of servers, downtime issues, IT support employee per thousand end user over time etc.Pitch your topic with ease and precision using this IT Department Operations Issues Analysis Dashboard Designs PDF. This layout presents information on Support Employee, Uptime Downtime, Percentage Unsolved. It is also available for immediate download and adjustment. So, changes can be made in the color, design, graphics or any other component to create a unique layout.

Manufactured Products Sales Performance Monitoring Dashboard Information PDF
This slide shows the dashboard the data related to the sales performance of the products manufactured by the organization in order to effectively measure and monitor the performance of the sales team. It shows details related to revenue generated and units sold etc.Pitch your topic with ease and precision using this Manufactured Products Sales Performance Monitoring Dashboard Information PDF. This layout presents information on Monthly Revenue, Manufactured Products, Sales Performance Monitoring. It is also available for immediate download and adjustment. So, changes can be made in the color, design, graphics or any other component to create a unique layout.

Customer Information Software Dashboard With Churn Risk Information PDF
Following slide visually depicts customer data platform dashboard that showcase all the details of an individual customer in an organized way. Details covered in this dashboard is related to customer interests, top brands purchased, churn risk, customer lifetime value, engagement score etc. Pitch your topic with ease and precision using this Customer Information Software Dashboard With Churn Risk Information PDF. This layout presents information on Customer Lifetime, Engagement Score, Average Spending. It is also available for immediate download and adjustment. So, changes can be made in the color, design, graphics or any other component to create a unique layout.
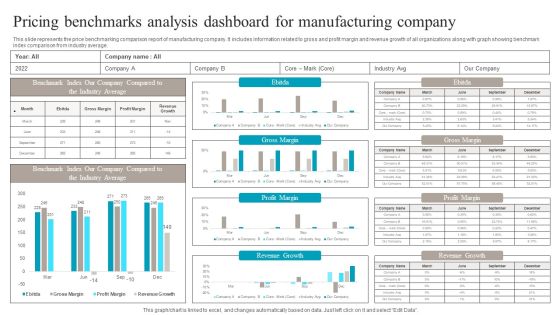
Pricing Benchmarks Analysis Dashboard For Manufacturing Company Structure PDF
This slide represents the price benchmarking comparison report of manufacturing company. It includes information related to gross and profit margin and revenue growth of all organizations along with graph showing benchmark index comparison from industry average. Pitch your topic with ease and precision using this Pricing Benchmarks Analysis Dashboard For Manufacturing Company Structure PDF. This layout presents information on Pricing Benchmarks Analysis, Dashboard For Manufacturing Company. It is also available for immediate download and adjustment. So, changes can be made in the color, design, graphics or any other component to create a unique layout.
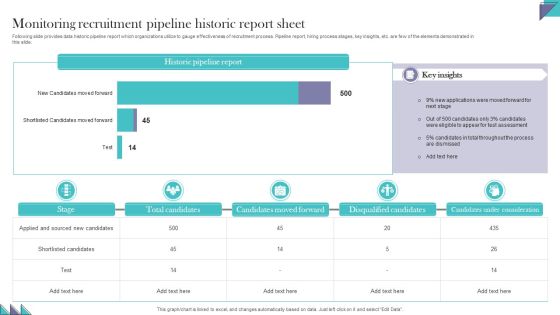
Monitoring Recruitment Pipeline Historic Report Sheet Pictures PDF
Following slide provides data historic pipeline report which organizations utilize to gauge effectiveness of recruitment process. Pipeline report, hiring process stages, key insights, etc. are few of the elements demonstrated in this slide. Pitch your topic with ease and precision using this Monitoring Recruitment Pipeline Historic Report Sheet Pictures PDF. This layout presents information on Candidates Moved Forward, Disqualified Candidates, Candidates Under Consideration. It is also available for immediate download and adjustment. So, changes can be made in the color, design, graphics or any other component to create a unique layout

Executive Dashboards To Track Sales Performance Guidelines PDF
This slide represents the CEO dashboard for tracking the sales performance of the organization. It includes key performance indicators such as gross, operating and net profit, sales amount by category, income statement etc. Pitch your topic with ease and precision using this Executive Dashboards To Track Sales Performance Guidelines PDF. This layout presents information on Income Statement, Monthly Sales Growth, Days Receivable Outstanding. It is also available for immediate download and adjustment. So, changes can be made in the color, design, graphics or any other component to create a unique layout.
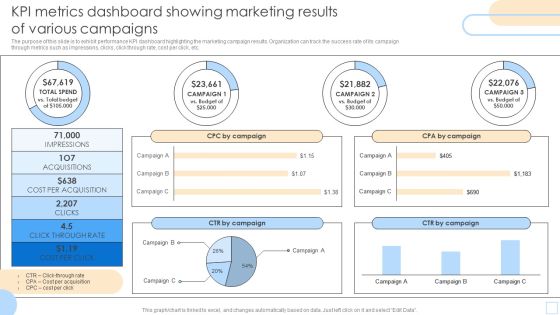
KPI Metrics Dashboard Showing Marketing Results Of Various Campaigns Pictures PDF
The purpose of this slide is to exhibit performance KPI dashboard highlighting the marketing campaign results. Organization can track the success rate of its campaign through metrics such as impressions, clicks, click through rate, cost per click, etc. Pitch your topic with ease and precision using this KPI Metrics Dashboard Showing Marketing Results Of Various Campaigns Pictures PDF. This layout presents information on Impressions, Acquisitions, CPA By Campaign. It is also available for immediate download and adjustment. So, changes can be made in the color, design, graphics or any other component to create a unique layout.

Workforce Performance Metrics Scorecard To Measure Training Effectiveness Information PDF
Mentioned slide outlines HR KPI scorecard showcasing most important kpis. Organization can measure the success rate of HR strategy by tracking metrics such as training effectiveness, absence rate and cost, benefits satisfaction, productivity rate, net promotor score, etc.Pitch your topic with ease and precision using this Workforce Performance Metrics Scorecard To Measure Training Effectiveness Information PDF. This layout presents information on Absence Rate, Internal Promotion, Engagement Index. It is also available for immediate download and adjustment. So, changes can be made in the color, design, graphics or any other component to create a unique layout.

Dashboard To Track Revenue After Global Expansion Ppt PowerPoint Presentation File Example PDF
This slide showcase dashboard that can help organization track revenue after global expansion. Its key components are average revenue per customer, customer acquisition cost, customer lifetime value and new customers acquired.Take your projects to the next level with our ultimate collection of Dashboard To Track Revenue After Global Expansion Ppt PowerPoint Presentation File Example PDF. Slidegeeks has designed a range of layouts that are perfect for representing task or activity duration, keeping track of all your deadlines at a glance. Tailor these designs to your exact needs and give them a truly corporate look with your own brand colors they all make your projects stand out from the rest.
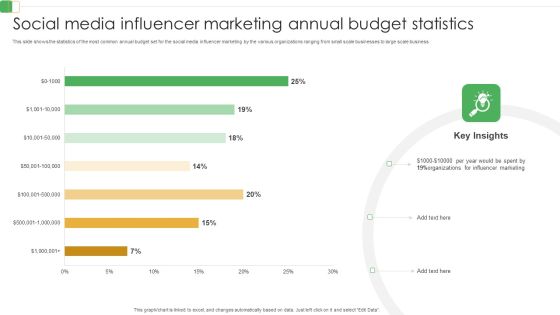
Social Media Influencer Marketing Annual Budget Statistics Ppt PowerPoint Presentation File Professional PDF
This slide shows the statistics of the most common annual budget set for the social media influencer marketing by the various organizations ranging from small scale businesses to large scale business. Pitch your topic with ease and precision using this Social Media Influencer Marketing Annual Budget Statistics Ppt PowerPoint Presentation File Professional PDF. This layout presents information on Social Media, Influencer Marketing, Annual Budget Statistics. It is also available for immediate download and adjustment. So, changes can be made in the color, design, graphics or any other component to create a unique layout.
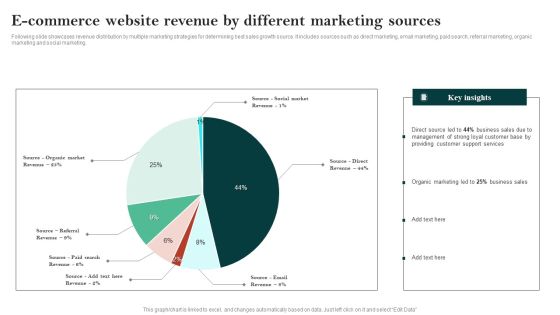
E Commerce Website Revenue By Different Marketing Sources Ppt Ideas PDF
Following slide showcases revenue distribution by multiple marketing strategies for determining best sales growth source. It includes sources such as direct marketing, email marketing, paid search, referral marketing, organic marketing and social marketing. Pitch your topic with ease and precision using this E Commerce Website Pre Launch Checklist Ppt Summary Backgrounds PDF. This layout presents information on Direct Source Led, Business Sales, Customer Base. It is also available for immediate download and adjustment. So, changes can be made in the color, design, graphics or any other component to create a unique layout.

Financial Position Evaluation Dashboard With Operating Profit Margin Elements PDF
This slide shows the financial statement analysis dashboard of organization. It covers various KPIs such as OPEX Ratio, operating profit margin, gross profit margin, net profit margin, etc. Pitch your topic with ease and precision using this Financial Position Evaluation Dashboard With Operating Profit Margin Elements PDF. This layout presents information on Income Statement, Revenue, Operating Profit, Net Profit. It is also available for immediate download and adjustment. So, changes can be made in the color, design, graphics or any other component to create a unique layout.
Leads Tracking Dashboard With Conversion Funnel Ideas PDF
This slide showcases dashboard that can help organization to identify the total number of customers acquired from the sales and marketing qualified lead. It also showcases financial KPIs that are cost per lead, cost per customer, customer lifetine value and return on marketing investment. Pitch your topic with ease and precision using this Leads Tracking Dashboard With Conversion Funnel Ideas PDF. This layout presents information on Audience, Prospects, Conversion Funnel. It is also available for immediate download and adjustment. So, changes can be made in the color, design, graphics or any other component to create a unique layout.

International Apparel Manufacturing Report With Market Growth Forecast Inspiration PDF
This slide showcases global manufacturing insights for apparel market that can help organization to identify the growth in last financial years and make investment decisions on the basis of past data. It also showcases growth forecast for a period of next 6 financial years. Pitch your topic with ease and precision using this International Apparel Manufacturing Report With Market Growth Forecast Inspiration PDF. This layout presents information on Apparel Manufacturing, Market Growth Forecast, Billion. It is also available for immediate download and adjustment. So, changes can be made in the color, design, graphics or any other component to create a unique layout.
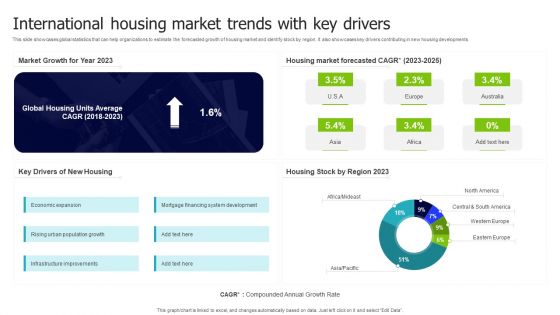
International Housing Market Trends With Key Drivers Inspiration PDF
This slide showcases global statistics that can help organizations to estimate the forecasted growth of housing market and identify stock by region. It also showcases key drivers contributing in new housing developments. Pitch your topic with ease and precision using this International Housing Market Trends With Key Drivers Inspiration PDF. This layout presents information on Key Drivers, Housing Market, Forecasted. It is also available for immediate download and adjustment. So, changes can be made in the color, design, graphics or any other component to create a unique layout.

International Sales Performance Dashboard With Regional Market Report Inspiration PDF
This slide showcases global report that can help organization to estimate forecast of the sales and identify yearly revenue generated. Its key elements are yearly sales, market share, regional outlook, competitor analysis and geographical sales. Pitch your topic with ease and precision using this International Sales Performance Dashboard With Regional Market Report Inspiration PDF. This layout presents information on Regional Outlook, Sales And Forecast, Market Share Overview. It is also available for immediate download and adjustment. So, changes can be made in the color, design, graphics or any other component to create a unique layout.

Strategic Dashboard To Track The Progress Of Drug Launch Structure PDF
Following slide presents a strategic dashboard which can be used by business organizations to track the progress of drug launch in the market. The key tasks are drug development, fund generation, testing, clinical trials, promotion, launch, feedback generation among many others. Pitch your topic with ease and precision using this Strategic Dashboard To Track The Progress Of Drug Launch Structure PDF. This layout presents information on Drug Development, Fund Generation, Testing, Clinical Trials, Promotion, Launch, Feedback Generation. It is also available for immediate download and adjustment. So, changes can be made in the color, design, graphics or any other component to create a unique layout.

Paid Media Search Advertisement Lead Generation Survey Report Comparison Clipart PDF
This slide showcase per fence of digital marketers toward paid search marketing tools strategy for product promotion. It includes elements such as organic search, paid search, social media and email marketing strategy. Pitch your topic with ease and precision using this Paid Media Search Advertisement Lead Generation Survey Report Comparison Clipart PDF. This layout presents information on Search Marketing, B2B Marketing, Higher Profit. It is also available for immediate download and adjustment. So, changes can be made in the color, design, graphics or any other component to create a unique layout.

Digital KPI Dashboard To Track Email Bounce Slides PDF
This slide shows dashboard which can e used by organizations to monitor performance of email. It includes key performance indicators such as traffic status, conversions, behaviors, etc. Pitch your topic with ease and precision using this Digital KPI Dashboard To Track Email Bounce Slides PDF. This layout presents information on Digital Kpi Dashboard, Track Email Bounce. It is also available for immediate download and adjustment. So, changes can be made in the color, design, graphics or any other component to create a unique layout.

Key Statistics Of High And Soft Digital Email Bounce Rate Summary PDF
This slide shows rate which can be used by organization to represent email bounce rate. It includes hard bounce rate and soft bounce rate. Pitch your topic with ease and precision using this Key Statistics Of High And Soft Digital Email Bounce Rate Summary PDF. This layout presents information on Key Statistics, Soft Digital, Email Bounce Rate. It is also available for immediate download and adjustment. So, changes can be made in the color, design, graphics or any other component to create a unique layout.
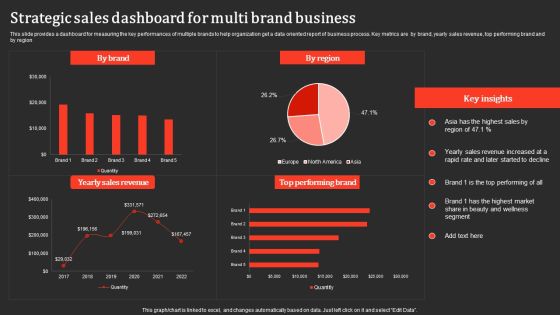
Strategic Sales Dashboard For Multi Brand Business Professional PDF
This slide provides a dashboard for measuring the key performances of multiple brands to help organization get a data oriented report of business process. Key metrics are by brand, yearly sales revenue, top performing brand and by region. Pitch your topic with ease and precision using this Strategic Sales Dashboard For Multi Brand Business Professional PDF. This layout presents information on Yearly Sales Revenue, Performing Brand. It is also available for immediate download and adjustment. So, changes can be made in the color, design, graphics or any other component to create a unique layout.

Change Metrics To Analyze Status By Priority Formats PDF
The following slide displays dashboard for real time tracking of major change kpis of the organization. It includes elements such as requests, projects, open, approved, review, in- progress, etc. Pitch your topic with ease and precision using this Change Metrics To Analyze Status By Priority Formats PDF This layout presents information on Project, Request Statistics, Priority. It is also available for immediate download and adjustment. So, changes can be made in the color, design, graphics or any other component to create a unique layout.
