Numbers

Motion Pictures Production Company Profile Key Stats And Figure Background PDF
This slide showcases the statistics associated with film production house which includes global box office collection, revenue, number of released movies, average hours of production, number of crew members, etc. This is a Motion Pictures Production Company Profile Key Stats And Figure Background PDF template with various stages. Focus and dispense information on one stages using this creative set, that comes with editable features. It contains large content boxes to add your information on topics like Global Box Office, Collection 2022, Revenue Till Date, Number Production. You can also showcase facts, figures, and other relevant content using this PPT layout. Grab it now.

Marketing Key Performance Indicators For Business Plan Review Template PDF
The following slide showcases targets of essential KPIs used in marketing to be tracked in campaign. Key indicators covered are number of conversions, leads and customer acquisition. Presenting Marketing Key Performance Indicators For Business Plan Review Template PDF to dispense important information. This template comprises three stages. It also presents valuable insights into the topics including Number Of Conversion, Number Of Leads, Customer Acquisition. This is a completely customizable PowerPoint theme that can be put to use immediately. So, download it and address the topic impactfully.

Key Performance Indicators Of Service Desk Problem Management Elements PDF
This slide showcases key metrics tracked and measured for incident management. Metrics included are incident response time, number of unresolved incidents, reopen rate, total cost per contact, customer satisfaction and first call resolution rate. Presenting Key Performance Indicators Of Service Desk Problem Management Elements PDF to dispense important information. This template comprises eight stages. It also presents valuable insights into the topics including Incident Response Time, Number Of Unresolved Incidents, Number Of Contacts Handled. This is a completely customizable PowerPoint theme that can be put to use immediately. So, download it and address the topic impactfully.

Cyber Intelligent Computing System Overview Of The CPS Company Mockup PDF
This slide describes the overview of the company including the number of countries in which services are provided, total number of certified experts, number of tools and technologies used and so on. Presenting Cyber Intelligent Computing System Overview Of The CPS Company Mockup PDF to provide visual cues and insights. Share and navigate important information on four stages that need your due attention. This template can be used to pitch topics like Certified Experts, Technologies, Countries. In addtion, this PPT design contains high resolution images, graphics, etc, that are easily editable and available for immediate download.

Customer Service KPI Dashboard For Technical Support Ppt Model Vector PDF
This slide covers customer service KPI dashboard for technical support. It involves details such as total number of issues arise daily, overall average response time, number of issues by channel and top performing technical engineers. Pitch your topic with ease and precision using this Customer Service KPI Dashboard For Technical Support Ppt Model Vector PDF. This layout presents information on Overall Average, Response Time, Total Number, Issues Arise Daily. It is also available for immediate download and adjustment. So, changes can be made in the color, design, graphics or any other component to create a unique layout.

Social Media Monitoring Platform Tool KPI Dashboard Ppt Gallery Show PDF
The following slide highlights the key insights of social media monitoring tools. It includes elements such as number of followers, total posts, impression, number of views, type of content breakdown etc. Showcasing this set of slides titled Social Media Monitoring Platform Tool KPI Dashboard Ppt Gallery Show PDF. The topics addressed in these templates are Number Followers, New Followers Added, Total Impressions. All the content presented in this PPT design is completely editable. Download it and make adjustments in color, background, font etc. as per your unique business setting.

Backlog Refinement Process Report With Tasks And Status Ppt Pictures Clipart Images PDF
This slide covers the tasks that are in process of backlog refinement and their status. It also includes the number of sprints, priority level, release number and their acceptance criteria. Showcasing this set of slides titled Backlog Refinement Process Report With Tasks And Status Ppt Pictures Clipart Images PDF. The topics addressed in these templates are Priority, Release number, Acceptance criteria. All the content presented in this PPT design is completely editable. Download it and make adjustments in color, background, font etc. as per your unique business setting.

Kpis To Track Partnership Project Administration Graphics PDF
This slide covers KPIs which can be measure performance of partnership project management. It includes key performance indicators such as number of partners, revenue through partners, proper satisfaction and number of deal registrations. Pitch your topic with ease and precision using this Kpis To Track Partnership Project Administration Graphics PDF. This layout presents information on Partner Satisfaction, Revenue Through Partners, Number Of Partners. It is also available for immediate download and adjustment. So, changes can be made in the color, design, graphics or any other component to create a unique layout.
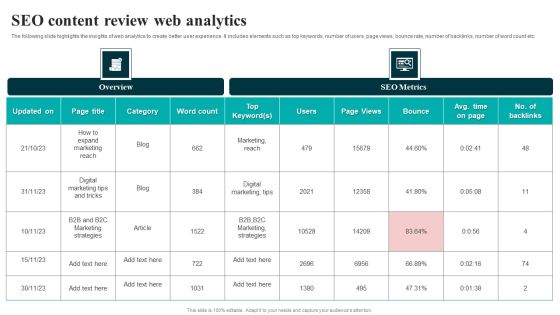
SEO Content Review Web Analytics Download PDF
The following slide highlights the insights of web analytics to create better user experience. It includes elements such as top keywords, number of users, page views, bounce rate, number of backlinks, number of word count etc. Showcasing this set of slides titled SEO Content Review Web Analytics Download PDF. The topics addressed in these templates are Marketing Reach, Digital Marketing Tips. All the content presented in this PPT design is completely editable. Download it and make adjustments in color, background, font etc. as per your unique business setting.

In Store Product Pickup Process Flow Diagram Rules PDF
This slide illustrates in store product pickup process to improve customer purchase experience. It includes steps such as customer product selection with instore pick up option, payment, send acceptance email, order tracking number, check order tracking number, deliver product to customers. Pitch your topic with ease and precision using this In Store Product Pickup Process Flow Diagram Rules PDF. This layout presents information on Number Customer, Order Acceptance, Delivery Management. It is also available for immediate download and adjustment. So, changes can be made in the color, design, graphics or any other component to create a unique layout.
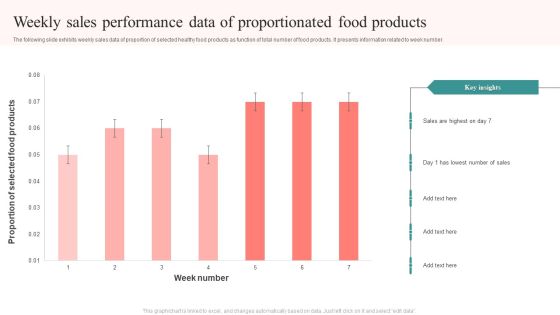
Weekly Sales Performance Data Of Proportionated Food Products Structure PDF
The following slide exhibits weekly sales data of proportion of selected healthy food products as function of total number of food products. It presents information related to week number. Showcasing this set of slides titled Weekly Sales Performance Data Of Proportionated Food Products Structure PDF. The topics addressed in these templates are Proportion Selected, Food Products, Week Number, Sales Highest. All the content presented in this PPT design is completely editable. Download it and make adjustments in color, background, font etc. as per your unique business setting.

Impact Of Compliance Trainings One Pager Documents
This slide highlights the impact of compliance training in terms of the number of employees trained, the absolute number of accidents at work and, the number of work related fatalities. Presenting you an exemplary Impact Of Compliance Trainings One Pager Documents. Our one-pager comprises all the must-have essentials of an inclusive document. You can edit it with ease, as its layout is completely editable. With such freedom, you can tweak its design and other elements to your requirements. Download this Impact Of Compliance Trainings One Pager Documents brilliant piece now.
Tracker For Time Based Quality Kpis In Project Management Ideas PDF
This slide displays project wise comparative analysis on the basis of planned and actual time it takes for completion. It includes details such as number of tasks and work completed, average number of hours, start and end dates, etc. Pitch your topic with ease and precision using this Tracker For Time Based Quality Kpis In Project Management Ideas PDF. This layout presents information on Time, Work Completed, Avg Number, Hours Per Task. It is also available for immediate download and adjustment. So, changes can be made in the color, design, graphics or any other component to create a unique layout.

Consumer Partition Dashboard For Email Campaigns Infographics PDF
The following slide depicts a dashboard which can be used by marketers for sending targeted mails to customers and enhance customer retention. The key performing indicators are number of customers, average value or orders, number of orders, top ten percent customers etc. Showcasing this set of slides titled Consumer Partition Dashboard For Email Campaigns Infographics PDF. The topics addressed in these templates are Average Life Time Value, Average Value Of Orders, Returns, Average Number Of Orders. All the content presented in this PPT design is completely editable. Download it and make adjustments in color, background, font etc. as per your unique business setting.

PowerPoint Design Gear Process Company Ppt Template
PowerPoint Design Gear Process Company PPT Template-This PowerPoint diagram shows three gears that represent three processes. You can add data depending on the number of processes you want to include in your presentation.-PowerPoint Design Gear Process Company PPT Template
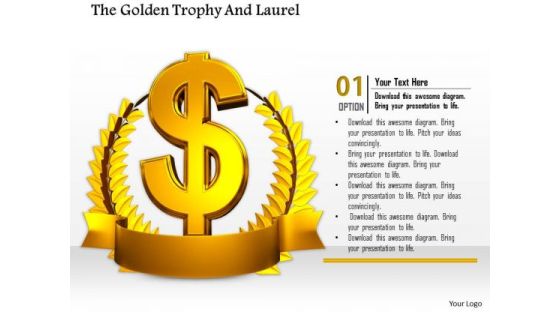
Stock Photo Golden Wreath Around Dollar Symbol PowerPoint Slide
Our unique image is designed with golden laurel trophy for number one position. This image clearly defines the award, win bravery, merit etc. Special effects of this image will surely interest the audience.

0814 1 Label Ribbon Batch Image For Championship Image Graphics For PowerPoint
This business image has been designed with number 1 label ribbon batch. This image shows the concept of championship and winner. Use this image in your sports and tournament related topics. Make awesome presentation with this innovative image.

0814 3 Label Ribbon Batch For Championship Image Graphics For PowerPoint
Define the concepts of Sports, Award and winners with this unique image. This image has been designed with graphic of ribbon batch with number 3 label. Make a professional presentation for your audience with this unique image.

Business Framework Portfolio Risk 01 PowerPoint Presentation
This business framework image slide displays portfolio risk graph PowerPoint template. Use this image slide, in your presentations to depict portfolio risk measures like number of stocks and returns. Make your presentations outshine using this image slide.
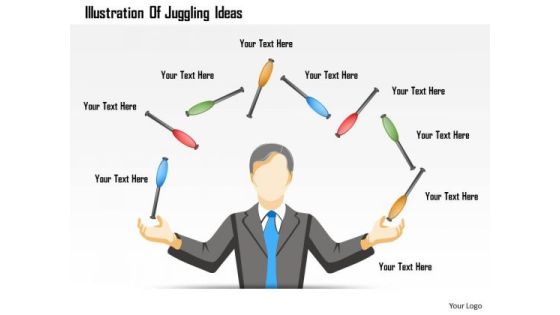
Business Diagram Illustration Of Juggling Ideas Presentation Template
This business diagram has been designed with graphic of 3d man who is doing juggling sticks. This diagram can be used to display number of decisions and juggling many ideas. Use this image template to make outstanding presentation.
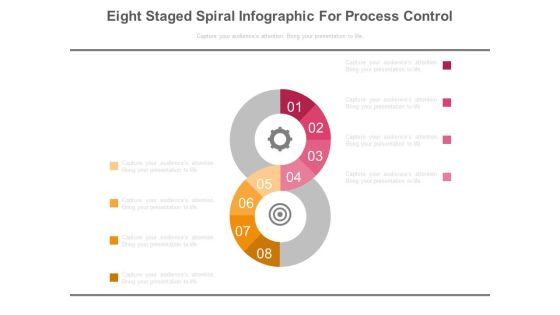
Eight Steps Dashboard Matrics Powerpoint Slides
This PowerPoint template eight number infographic chart. Download this PPT chart to depict target planning. This PowerPoint slide is of great help in the business sector to make realistic presentations and provides effective way of presenting your newer thoughts.

Pentagon Shape Infographic Diagram Powerpoint Template
Our above business diagram has been designed with number banners and record and file icons. This slide is suitable to present steps of book keeping. Use this business diagram to present your work in a more smart and precise manner.
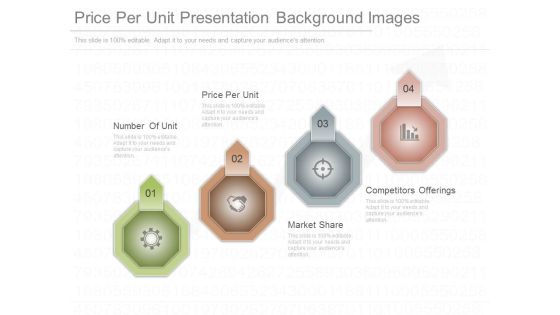
Price Per Unit Presentation Background Images
This is a price per unit presentation background images. This is a four stage process. The stages in this process are number of unit, price per unit, market share, competitors offerings.

Qualified Sales Leads From Social Powerpoint Slide Clipart
This is a qualified sales leads from social powerpoint slide clipart. This is a four stage process. The stages in this process are qualified sales leads from social, reach within target audience, number of issues resolved, products innovation.
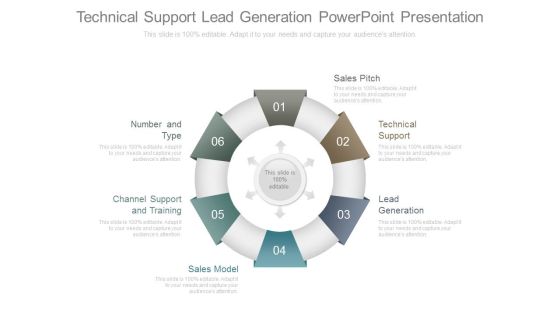
Technical Support Lead Generation Powerpoint Presentation
This is a technical support lead generation powerpoint presentation. This is a six stage process. The stages in this process are sales pitch, technical support, lead generation, sales model, channel support and training, number and type.

Customer Injury Rate Powerpoint Slides Download
This is a customer injury rate powerpoint slides download. This is a seven stage process. The stages in this process are customer injury rate, number of positions filled, customer commendation, crime rate, capital found expanding, customer complaint rate, escalator availability.
Sales Call Tracking Diagram Powerpoint Shapes
This is a sales call tracking diagram powerpoint shapes. This is a four stage process. The stages in this process are online search clicks on adds, unique phone number for customer call, call to customer care, tracking to ppc campaign.

Dashboard Design And Development For Travel Diagram Background
This is a dashboard design and development for travel diagram background. This is a five stage process. The stages in this process are number of trips, sales, delayed flights, regional load, flight expense.

Bargaining Strength Presentation Visual Aids
This is a bargaining strength presentation visual aids. This is a six stage process. The stages in this process are number of suppliers, bargaining strength, price sensitivity, switching costs, uniqueness of offering, economies of scale.

Diversification To Risk Reduction Template Ppt Examples Slides
This is a diversification to risk reduction template ppt examples slides. This is a six stage process. The stages in this process are portfolio risk, total risk, unique risk, market risk, systematic risk, number of stocks.
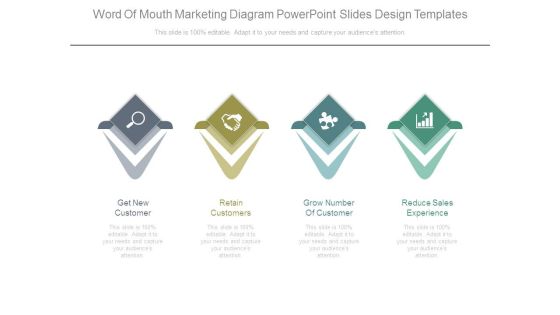
Word Of Mouth Marketing Diagram Powerpoint Slides Design Templates
This is a word of mouth marketing diagram powerpoint slides design templates. This is a four stage process. The stages in this process are get new customer, retain customers, grow number of customer, reduce sales experience.

Brainstorming Session Attribute Listing Technique Presentation Layouts
This is a brainstorming session attribute listing technique presentation layouts. This is a four stage process. The stages in this process are voting criteria, total number of votes, idea.

Business Competition Comparison Table Ppt Icon
This is a business competition comparison table ppt icon. This is a seven stage process. The stages in this process are criteria, revenue, profit, market share, main activity, number of employee, product quality, insert your text, competitor.

Business Competition Comparison And Analysis Table Powerpoint Slides
This is a business competition comparison and analysis table powerpoint slides. This is a six stage process. The stages in this process are criteria, revenue, profit, market share, main activity, number of employee, product quality, competitor.

Criteria Based Competition Comparison Table Powerpoint Slides
This is a criteria based competition comparison table powerpoint slides. This is a seven stage process. The stages in this process are revenue, profit, market share, main activity, number of employee, product quality.
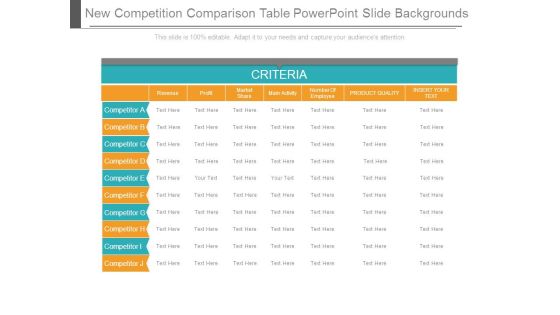
New Competition Comparison Table Powerpoint Slide Backgrounds
This is a new competition comparison table powerpoint slide backgrounds. This is a seven stage process. The stages in this process are revenue, profit, market share, main activity, number of employee, product quality, insert your text.

Competition Comparison Table With New Criteria Powerpoint Ideas
This is a competition comparison table with new criteria powerpoint ideas. This is a seven stage process. The stages in this process are revenu, profit, market share, main activity, number of employee, product quality, insert your text.

Competition Comparison Criteria Review Table Powerpoint Slide Templates Download
This is a competition comparison criteria review table powerpoint slide templates download. This is a six stage process. The stages in this process are criteria, competitor revenue, profit, market share, main activity, number of employee, product quality, insert your text.

Competition Comparison Table For New Business Presentation Powerpoint Templates
This is a competition comparison table for new business presentation powerpoint templates. This is a seven stage process. The stages in this process are criteria, revenue, profit, market share, main activity, number of employee, product quality, insert your text.

Business Comparison Table Sample Ppt Presentation
This is a business comparison table sample ppt presentation. This is a seven stage process. The stages in this process are criteria, revenue, profit, market, share, main activity, number of employee, product quality, insert your text, competitor.

Competitor Analysis Tools Ppt PowerPoint Presentation Example File
This is a competitor analysis tools ppt powerpoint presentation example file. This is a five stage process. The stages in this process are criteria, revenue, profit, market share, main activity, number of employee, product quality.

Competition Comparison Table For New Business Ppt PowerPoint Presentation Slides
This is a competition comparison table for new business ppt powerpoint presentation slides. This is a seven stage process. The stages in this process are criteria, revenue, profit, market share, main activity, number of employee, product quality, competitor.

Competitor Analysis Chart Ppt PowerPoint Presentation Visuals
This is a competitor analysis chart ppt powerpoint presentation visuals. This is a five stage process. The stages in this process are revenue, profit, market share, main activity, number of employee, product quality.

Competitors Analysis Report Ppt PowerPoint Presentation Introduction
This is a competitors analysis report ppt powerpoint presentation introduction. This is a seven stage process. The stages in this process are criteria, revenue, profit, market share, main activity, number of employee.

Measuring Content Marketing Performance Ppt PowerPoint Presentation Design Ideas
This is a measuring content marketing performance ppt powerpoint presentation design ideas. This is a eight stage process. The stages in this process are conversion rate, quality of leads, website traffic, number of leads, sales revenue, subscriber list growth.

Competition Comparison Table Ppt PowerPoint Presentation Outline
This is a competition comparison table ppt powerpoint presentation outline. This is a seven stage process. The stages in this process are revenue, profit, market share, main activity, number of employee, product quality.

Current State Analysis Our Market Share Ppt PowerPoint Presentation Topics
This is a current state analysis our market share ppt powerpoint presentation topics. This is a six stage process. The stages in this process are we took number 3 spot in the market, competitor.

Competition Comparison Table Ppt PowerPoint Presentation Slide
This is a competition comparison table ppt powerpoint presentation slide. This is a six stage process. The stages in this process are revenue, profit, market share, main activity, number of employee, product quality.

Competitor Analysis Template Ppt PowerPoint Presentation Guidelines
This is a competitor analysis template ppt powerpoint presentation guidelines. This is a five stage process. The stages in this process are revenue, profit, market share, competitor, number of employee.

Competition Comparison Table Ppt PowerPoint Presentation Visual Aids
This is a competition comparison table ppt powerpoint presentation visual aids. This is a six stage process. The stages in this process are revenue, profit, market share, main activity, number of employee, product quality.

Competition Comparison Table Ppt PowerPoint Presentation Backgrounds
This is a competition comparison table ppt powerpoint presentation backgrounds. This is a seven stage process. The stages in this process are revenue, profit, market share , main activity, number of employee, product quality , insert your text.

Competitor Analysis Template Ppt PowerPoint Presentation Model
This is a competitor analysis template ppt powerpoint presentation model. This is a five stage process. The stages in this process are revenue, profit, market share, main activity, number of employee, product quality.

Competition Comparison Table Ppt PowerPoint Presentation Microsoft
This is a competition comparison table ppt powerpoint presentation microsoft. This is a seven stage process. The stages in this process are criteria, revenue, market share, number of employee, insert your text.

Competitor Analysis Template Ppt PowerPoint Presentation Example File
This is a competitor analysis template ppt powerpoint presentation example file. This is a five stage process. The stages in this process are revenue, profit, market share, main activity, number of employee, product quality.

Analyse Competition Ppt PowerPoint Presentation Themes
This is a analyse competition ppt powerpoint presentation themes. This is a seven stage process. The stages in this process are profit, revenue, market share, main activity, number of employee.

Competitor Analysis Template Ppt PowerPoint Presentation Ideas
This is a competitor analysis template ppt powerpoint presentation ideas. This is a five stage process. The stages in this process are revenue, profit, market share, number of employee, product quality, main activity, revenue.

Competitor Analysis Template Ppt PowerPoint Presentation Outline Format Ideas
This is a competitor analysis template ppt powerpoint presentation outline format ideas. This is a four stage process. The stages in this process are revenue, profit, market share, number of employee, product quality, main activity, revenue.

Competitor Analysis Comparison Table Ppt PowerPoint Presentation Outline Slides
This is a competitor analysis comparison table ppt powerpoint presentation outline slides. This is a two stage process. The stages in this process are revenue, profit, market share, main activity, number of employee, product quality.

Competitor Analysis Comparison Table Ppt PowerPoint Presentation Icon Designs Download
This is a competitor analysis comparison table ppt powerpoint presentation icon designs download. This is a seven stage process. The stages in this process are revenue, profit, market share, main activity, number of employee, product quality.
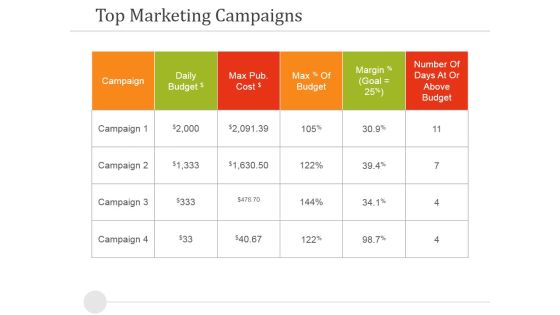
Top Marketing Campaigns Ppt PowerPoint Presentation Pictures Ideas
This is a top marketing campaigns ppt powerpoint presentation pictures ideas. This is a six stage process. The stages in this process are campaign, daily budget, max of budget, number of days at or above budget.

 Home
Home