Numbers
Students In Maths Class Vector Icon Ppt Powerpoint Presentation Icon Graphics
Presenting this set of slides with name students in maths class vector icon ppt powerpoint presentation icon graphics. The topics discussed in these slides are number icon, mathematical, number bar vector. This is a completely editable PowerPoint presentation and is available for immediate download. Download now and impress your audience.

Key Product Distribution Channels Distribution Strategy Template Ppt Ideas Good PDF
Presenting this set of slides with name key product distribution channels distribution strategy template ppt ideas good pdf. The topics discussed in these slides are gross margin, online sales, number of channel partners, number of partner retail stores, revenue per location. This is a completely editable PowerPoint presentation and is available for immediate download. Download now and impress your audience.

Artificial Intelligence Machine Learning Deep Learning How To Choose Machine Learning Algorithm Ppt PowerPoint Presentation PDF
Presenting this set of slides with name artificial intelligence machine learning deep learning how to choose machine learning algorithm ppt powerpoint presentation pdf. The topics discussed in these slides are additional requirements, accuracy, training time linearity, number parameters, number features. This is a completely editable PowerPoint presentation and is available for immediate download. Download now and impress your audience.

AI High Tech PowerPoint Templates How To Choose Machine Learning Algorithm Themes PDF
Presenting this set of slides with name ai high tech powerpoint templates how to choose machine learning algorithm themes pdf. The topics discussed in these slides are algorithm cheat sheet, accuracy, training time, linearity, number of parameters, number of features. This is a completely editable PowerPoint presentation and is available for immediate download. Download now and impress your audience.

Pitch Deck For Raising Funds From Product Crowdsourcing Revenue Forecast For The New Product Infographics PDF
Presenting this set of slides with name pitch deck for raising funds from product crowdsourcing revenue forecast for the new product infographics pdf. The topics discussed in these slides are number users, number product sold, price per product, total revenue, 2020 to 2024. This is a completely editable PowerPoint presentation and is available for immediate download. Download now and impress your audience.

Boosting Machine Learning How To Choose Machine Learning Algorithm Ppt PowerPoint Presentation Model Slide Download PDF
Presenting this set of slides with name boosting machine learning how to choose machine learning algorithm ppt powerpoint presentation model slide download pdf. The topics discussed in these slides are additional requirements, accuracy, training time linearity, number parameters, number features. This is a completely editable PowerPoint presentation and is available for immediate download. Download now and impress your audience.

Back Propagation Program AI How To Choose Machine Learning Algorithm Ideas PDF
Deliver an awe-inspiring pitch with this creative back propagation program ai how to choose machine learning algorithm ideas pdf bundle. Topics like additional requirements, accuracy, training time, linearity, number parameters, number features can be discussed with this completely editable template. It is available for immediate download depending on the needs and requirements of the user.
Google Search Console Performance Report Metrics Training Ppt
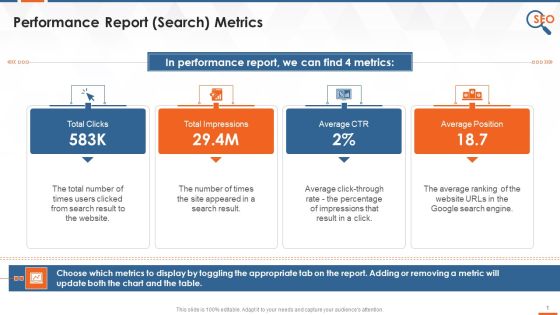
This slide Covers a description of webmaster performance report metrics. It depicts The total number of times users clicked on a website, the number of times the site appeared in the search result, the average click-through rate, and an average ranking of the website URLs in the Google search engine.

PowerPoint Template Vertical Steps To Create Marketing Templates Plan Graphic
We present our PowerPoint template vertical slide numbers for commerce strategy Graphic. Use our Circle Charts PowerPoint Templates because; illustrate your plans to your listeners with the same accuracy. Use our Shapes PowerPoint Templates because; Use this template containing to highlight the key issues of your presentation. Use our Business PowerPoint Templates because; Place them where they need to be. Use our Arrows PowerPoint Templates because, guaranteed to focus the minds of your team. Use our Process and Flows PowerPoint Templates because, Signpost your preferred roadmap to your eager co- travelers and demonstrate clearly how you intend to navigate them towards the desired corporate goal. Use these PowerPoint slides for presentations relating to Background, Blog, Business, Chain, Communication, Concept, Connection, Constructive, Contact, Design, Destination, Flow, Information, Internet, Line, Linear, Location, Logistic, Movement, Network, Path, Pointer, Reaction, Structure, System, Team. The prominent colors used in the PowerPoint template are Red, Gray, and Black

Consecutive Process 10 Stages Business Plan Flow Chart PowerPoint Templates
We present our consecutive process 10 stages business plan flow chart PowerPoint templates. Use our Arrows PowerPoint Templates because; amplify on this basic corporate concept and forefront the benefits of overlapping processes to arrive at common goals. Use our Business PowerPoint Templates because, Marketing Strategy Business Template:- Maximizing sales of your product is the intended destination. Use our Shapes PowerPoint Templates because; Outline your targets to your team. Use our Finance PowerPoint Templates because, Ideas roll along in your mind like billiard balls. Use our Process and Flows PowerPoint Templates because, are the seeds of many of our successes. Use these PowerPoint slides for presentations relating to abstract arrow blank business chart circular circulation concept conceptual consecutive design diagram executive flow icon idea illustration management model numbers organization procedure process. The prominent colors used in the PowerPoint template are Blue, Gray, and Black
Consecutive Process 10 Stages Creating Flowchart PowerPoint Templates
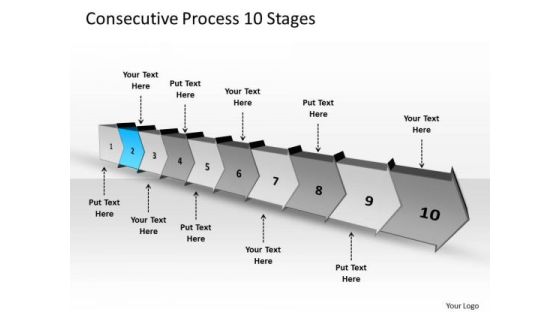
We present our consecutive process 10 stages creating flowchart PowerPoint templates. Use our Arrows PowerPoint Templates because; you have the ideas to develop the teams vision of where they need to be in the future. Use our Business PowerPoint Templates because, you have played a stellar role and have a few ideas. Use our Shapes PowerPoint Templates because, prove how they mesh to motivate the company team and provide the steam to activate the composite machine. Use our Finance PowerPoint Templates because, our presentation designs are for those on the go. Use our Process and Flows PowerPoint Templates because, they are indicators of the path you have in mind. Use these PowerPoint slides for presentations relating to abstract arrow blank business chart circular circulation concept conceptual consecutive design diagram executive flow icon idea illustration management model numbers organization procedure process. The prominent colors used in the PowerPoint template are Blue, Gray, and Black
Consecutive Process 10 Stages Flowchart PowerPoint Freeware Slides
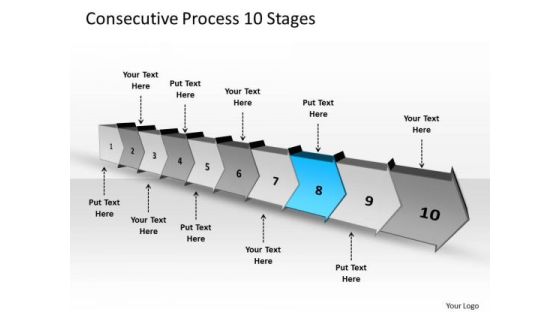
We present our consecutive process 10 stages flowchart PowerPoint freeware Slides. Use our Arrows PowerPoint Templates because, have always been a source of inspiration for us all. Use our Business PowerPoint Templates because, are the triggers of our growth. Use our Shapes PowerPoint Templates because, be the cynosure of all eyes with our template depicting. Use our Finance PowerPoint Templates because, to achieve sure shot success they need to come together at the right time, place and manner. Use our Process and Flows PowerPoint Templates because, Business Template: - There is a vision, a need you can meet. Use these PowerPoint slides for presentations relating to abstract arrow blank business chart circular circulation concept conceptual consecutive design diagram executive flow icon idea illustration management model numbers organization procedure process. The prominent colors used in the PowerPoint template are Blue, Gray, and Black

Consecutive Process 10 Stages Free Schematic PowerPoint Templates
We present our consecutive process 10 stages free schematic PowerPoint templates. Use our Arrows PowerPoint Templates because, are the Tools of the Trade. Use our Business PowerPoint Templates because, Marketing Strategy Business Template:- maximizing sales of your product is the intended destination. Use our Shapes PowerPoint Templates because, Probe the minds of your colleagues, see their faces light up as they assimilate and understand the value of your suggestions. Use our Finance PowerPoint Templates because, they are logical, accurate and to the point. Use our Process and Flows PowerPoint Templates because, Pinpoint the critical paths and areas in your process and set the timelines for their completion. Use these PowerPoint slides for presentations relating to abstract arrow blank business chart circular circulation concept conceptual consecutive design diagram executive flow icon idea illustration management model numbers organization procedure process. The prominent colors used in the PowerPoint template are Blue, Gray, and Black
Consecutive Process 10 Stages Planning Flow Chart PowerPoint Templates
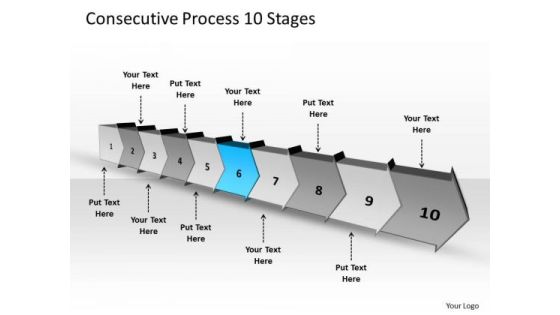
We present our consecutive process 10 stages planning flow chart PowerPoint templates. Use our Arrows PowerPoint Templates because; unravel the desired and essential elements of your overall strategy. Use our Business PowerPoint Templates because, Ideas roll along in your mind like billiard balls. Use our Shapes PowerPoint Templates because; educate your team and the attention you have paid. Use our Finance PowerPoint Templates because, Now you have to coordinate and motivate your team. Use our Process and Flows PowerPoint Templates because; illustrate your thoughts and experiences to your staff. Use these PowerPoint slides for presentations relating to abstract arrow blank business chart circular circulation concept conceptual consecutive design diagram executive flow icon idea illustration management model numbers organization procedure process. The prominent colors used in the PowerPoint template are Blue, Gray, and Black
Consecutive Process 10 Stages Ppt Support Flow Chart PowerPoint Slides
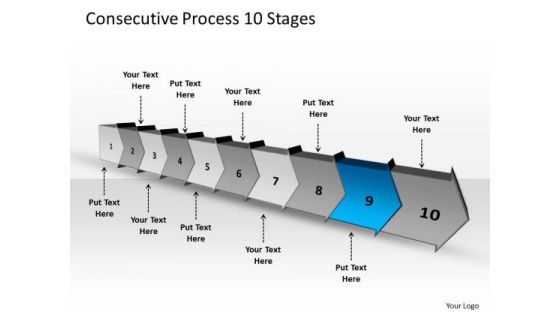
We present our consecutive process 10 stages ppt support flow chart PowerPoint Slides. Use our Arrows PowerPoint Templates because, Start with the fundamental basic activities and slowly but surely hone them down to the top of the pyramid, the ultimate goal. Use our Business PowerPoint Templates because; Get them in the desired sequence into the bracket. Use our Shapes PowerPoint Templates because, Like your thoughts arrows are inherently precise and true. Use our Finance PowerPoint Templates because; explain the process by which you intend to right it. Use our Process and Flows PowerPoint Templates because; Break it all down to Key Result Areas. Use these PowerPoint slides for presentations relating to abstract arrow blank business chart circular circulation concept conceptual consecutive design diagram executive flow icon idea illustration management model numbers organization procedure process. The prominent colors used in the PowerPoint template are Blue, Gray, and Black
Consecutive Process 10 Stages Schematic PowerPoint Templates
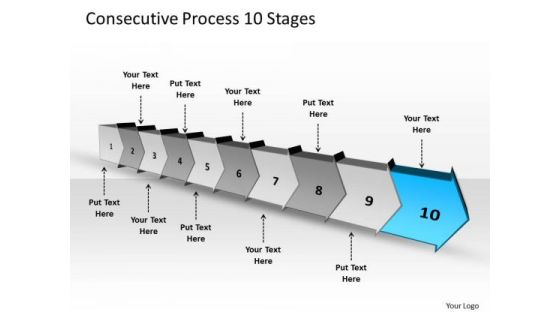
We present our consecutive process 10 stages schematic PowerPoint templates. Use our Arrows PowerPoint Templates because; you understand the ailment and how to fight it. Use our Business PowerPoint Templates because, Marketing Strategy Business Template: - maximizing sales of your product is the intended destination. Use our Shapes PowerPoint Templates because, Clear thinking is your strength, transmit your thoughts to your eager team. Use our Finance PowerPoint Templates because, the lessons have been analyzed, studied and conclusions drawn. Use our Process and Flows PowerPoint Templates because, Timelines Template: - Getting it done may not be enough. Use these PowerPoint slides for presentations relating to abstract arrow blank business chart circular circulation concept conceptual consecutive design diagram executive flow icon idea illustration management model numbers organization procedure process. The prominent colors used in the PowerPoint template are Blue, Gray, and Black

Four Triangles In Progressive Order Powerpoint Slides
The multicolored triangles in this slide can be used for various purposes. The differently sized triangles can be used by a company or an organization to present their growth over the years. The triangles can also be used to portray a comparison between different products or services being offered by a business and the increasing size can portray the added advantages of opting for the next package. The numbers inside the triangles can be used to demonstrate progressive steps involved in a process or a procedure. It can also be used to depict ways to get closer or to achieve a target. The triangles can effectively represent the departments as per their workload or importance.
PPM Private Equity Company Statistics Related To Its Operations And Financials Statement Ppt PowerPoint Presentation Show Portrait PDF
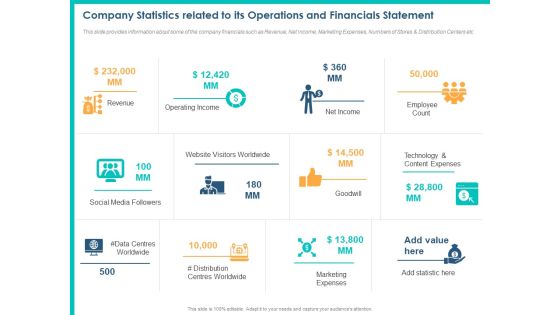
This slide provides information about some of the company financials such as Revenue, Net Income, Marketing Expenses, Numbers of Stores and Distribution Centers etc. This is a ppm private equity company statistics related to its operations and financials statement ppt powerpoint presentation show portrait pdf template with various stages. Focus and dispense information on one stages using this creative set, that comes with editable features. It contains large content boxes to add your information on topics like revenue, operating income, net income, employee count, website visitors worldwide, technology and content expenses, social media followers, data centres worldwide, distribution centres worldwide, marketing expenses. You can also showcase facts, figures, and other relevant content using this PPT layout. Grab it now.
Store Positioning In Retail Management Retail Location Factor Rating Scores Icons PDF
This slide signifies that a company can rate each site with a value from the range based on the costs and benefits offered by the alternative locations and multiply this value by the appropriate weight. These numbers are then summed to get an overall factor rating. Then a company can compare the overall ratings of alternative sites. This technique enables a company to choose a location systematically based on the best rating Deliver an awe inspiring pitch with this creative store positioning in retail management retail location factor rating scores icons pdf bundle. Topics like energy availability, traffic volume, operating cost can be discussed with this completely editable template. It is available for immediate download depending on the needs and requirements of the user.

Positioning Store Brands Retail Location Factor Rating Taxes Ppt Show Infographics PDF
This slide signifies that a company can rate each site with a value from the range based on the costs and benefits offered by the alternative locations and multiply this value by the appropriate weight. These numbers are then summed to get an overall factor rating. Then a company can compare the overall ratings of alternative sites. This technique enables a company to choose a location systematically based on the best rating. Deliver an awe-inspiring pitch with this creative positioning store brands retail location factor rating taxes ppt show infographics pdf bundle. Topics like retail location factor rating can be discussed with this completely editable template. It is available for immediate download depending on the needs and requirements of the user.
Retail Location Factor Rating Cost STP Approaches In Retail Marketing Graphics PDF
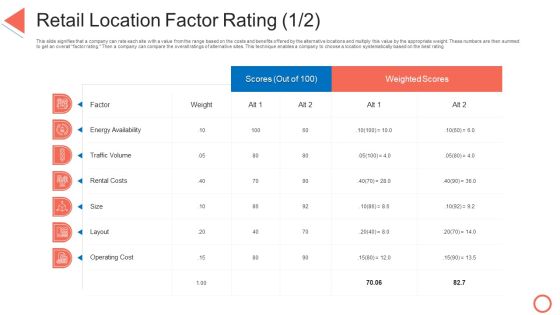
This slide signifies that a company can rate each site with a value from the range based on the costs and benefits offered by the alternative locations and multiply this value by the appropriate weight. These numbers are then summed to get an overall factor rating. Then a company can compare the overall ratings of alternative sites. This technique enables a company to choose a location systematically based on the best rating. Deliver an awe inspiring pitch with this creative retail location factor rating cost stp approaches in retail marketing graphics pdf bundle. Topics like costs, energy availability, traffic volume can be discussed with this completely editable template. It is available for immediate download depending on the needs and requirements of the user.

Marketing Strategies For Retail Store Retail Location Factor Rating Factor Introduction PDF
This slide signifies that a company can rate each site with a value from the range based on the costs and benefits offered by the alternative locations and multiply this value by the appropriate weight. These numbers are then summed to get an overall factor rating. Then a company can compare the overall ratings of alternative sites. This technique enables a company to choose a location systematically based on the best rating Deliver and pitch your topic in the best possible manner with this marketing strategies for retail store retail location factor rating factor introduction pdf. Use them to share invaluable insights on energy availability, traffic volume, operating cost and impress your audience. This template can be altered and modified as per your expectations. So, grab it now.

Retail Location Factor Rating Cost Retail Store Positioning Ppt Styles Demonstration PDF
This slide signifies that a company can rate each site with a value from the range based on the costs and benefits offered by the alternative locations and multiply this value by the appropriate weight. These numbers are then summed to get an overall factor rating. Then a company can compare the overall ratings of alternative sites. This technique enables a company to choose a location systematically based on the best rating. Deliver an awe inspiring pitch with this creative retail location factor rating cost retail store positioning ppt styles demonstration pdf bundle. Topics like costs, energy availability, traffic volume can be discussed with this completely editable template. It is available for immediate download depending on the needs and requirements of the user.
Retail Location Factor Rating Cost Retail Outlet Positioning And Merchandising Approaches Designs PDF
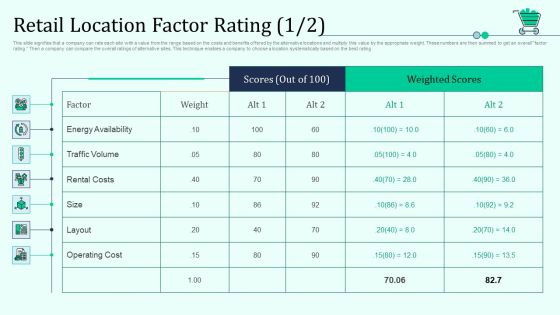
This slide signifies that a company can rate each site with a value from the range based on the costs and benefits offered by the alternative locations and multiply this value by the appropriate weight. These numbers are then summed to get an overall factor rating. Then a company can compare the overall ratings of alternative sites. This technique enables a company to choose a location systematically based on the best rating. Deliver an awe inspiring pitch with this creative retail location factor rating cost retail outlet positioning and merchandising approaches designs pdf bundle. Topics like costs, energy availability, traffic volume can be discussed with this completely editable template. It is available for immediate download depending on the needs and requirements of the user.
Distribution Strategies For Increasing Company Sales From Current Distribution Channels Infographics PDF
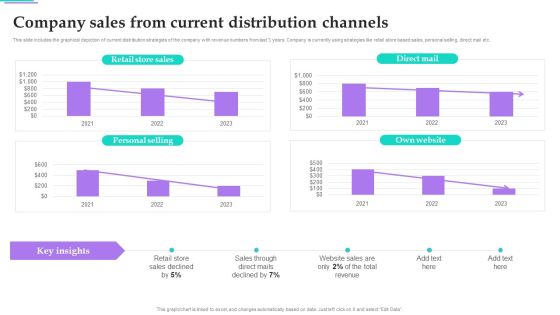
This slide includes the graphical depiction of current distribution strategies of the company with revenue numbers from last 3 years. Company is currently using strategies like retail store based sales, personal selling, direct mail etc. Do you have an important presentation coming up Are you looking for something that will make your presentation stand out from the rest Look no further than Distribution Strategies For Increasing Company Sales From Current Distribution Channels Infographics PDF. With our professional designs, you can trust that your presentation will pop and make delivering it a smooth process. And with Slidegeeks, you can trust that your presentation will be unique and memorable. So why wait Grab Distribution Strategies For Increasing Company Sales From Current Distribution Channels Infographics PDF today and make your presentation stand out from the rest
Implementing Effective Distribution Company Sales From Current Distribution Channels Icons PDF
This slide includes the graphical depiction of current distribution strategies of the company with revenue numbers from last 3 years. Company is currently using strategies like retail store based sales, personal selling, direct mail etc. If you are looking for a format to display your unique thoughts, then the professionally designed Implementing Effective Distribution Company Sales From Current Distribution Channels Icons PDF is the one for you. You can use it as a Google Slides template or a PowerPoint template. Incorporate impressive visuals, symbols, images, and other charts. Modify or reorganize the text boxes as you desire. Experiment with shade schemes and font pairings. Alter, share or cooperate with other people on your work. Download Implementing Effective Distribution Company Sales From Current Distribution Channels Icons PDF and find out how to give a successful presentation. Present a perfect display to your team and make your presentation unforgettable.
Optimize Business Sales Company Sales From Current Distribution Channels Clipart PDF
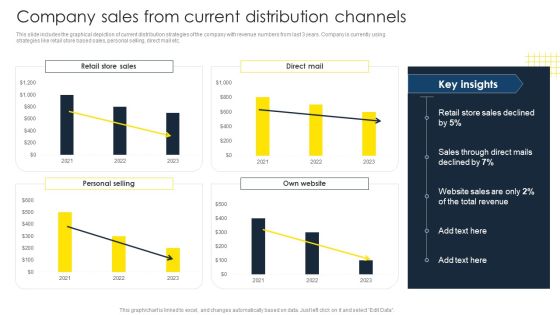
This slide includes the graphical depiction of current distribution strategies of the company with revenue numbers from last 3 years. Company is currently using strategies like retail store based sales, personal selling, direct mail etc. Welcome to our selection of the Optimize Business Sales Company Sales From Current Distribution Channels Clipart PDF. These are designed to help you showcase your creativity and bring your sphere to life. Planning and Innovation are essential for any business that is just starting out. This collection contains the designs that you need for your everyday presentations. All of our PowerPoints are 100 percent editable, so you can customize them to suit your needs. This multi-purpose template can be used in various situations. Grab these presentation templates today.

Omnichannel Distribution System To Satisfy Customer Needs Company Sales From Current Distribution Channels Diagrams PDF
This slide includes the graphical depiction of current distribution strategies of the company with revenue numbers from last 3 years. Company is currently using strategies like retail store based sales, personal selling, direct mail etc. Get a simple yet stunning designed Omnichannel Distribution System To Satisfy Customer Needs Company Sales From Current Distribution Channels Diagrams PDF. It is the best one to establish the tone in your meetings. It is an excellent way to make your presentations highly effective. So, download this PPT today from Slidegeeks and see the positive impacts. Our easy-to-edit Omnichannel Distribution System To Satisfy Customer Needs Company Sales From Current Distribution Channels Diagrams PDF can be your go-to option for all upcoming conferences and meetings. So, what are you waiting for Grab this template today.

Criterion For Choosing Distribution Channel For Efficient Sales Administration Company Sales From Current Distribution Channels Themes PDF
This slide includes the graphical depiction of current distribution strategies of the company with revenue numbers from last 3 years. Company is currently using strategies like retail store based sales, personal selling, direct mail etc. Do you have to make sure that everyone on your team knows about any specific topic. I yes, then you should give Criterion For Choosing Distribution Channel For Efficient Sales Administration Company Sales From Current Distribution Channels Themes PDF a try. Our experts have put a lot of knowledge and effort into creating this impeccable Criterion For Choosing Distribution Channel For Efficient Sales Administration Company Sales From Current Distribution Channels Themes PDF. You can use this template for your upcoming presentations, as the slides are perfect to represent even the tiniest detail. You can download these templates from the Slidegeeks website and these are easy to edit. So grab these today.

Utilizing Neuromarketing Techniques Dunkin Donuts Implementing Sensory Marketing Portrait PDF
This slide represents case study for Dunkin Donuts who used sensory marketing with the aim to target potential customer base. It covers radio advertisement, sales, numbers of visitors etc. Do you have to make sure that everyone on your team knows about any specific topic I yes, then you should give Utilizing Neuromarketing Techniques Dunkin Donuts Implementing Sensory Marketing Portrait PDF a try. Our experts have put a lot of knowledge and effort into creating this impeccable Utilizing Neuromarketing Techniques Dunkin Donuts Implementing Sensory Marketing Portrait PDF. You can use this template for your upcoming presentations, as the slides are perfect to represent even the tiniest detail. You can download these templates from the Slidegeeks website and these are easy to edit. So grab these today.

Digital Marketing Toolkit Business To Business Marketing Transformation Success Metrics Sample PDF
This slide covers the B2B marketing transformation success metrics such as influenced pipelines, overall numbers of engaged accounts, marketing qualified accounts, individual campaign and channel metrics etc. If you are looking for a format to display your unique thoughts, then the professionally designed Digital Marketing Toolkit Business To Business Marketing Transformation Success Metrics Sample PDF is the one for you. You can use it as a Google Slides template or a PowerPoint template. Incorporate impressive visuals, symbols, images, and other charts. Modify or reorganize the text boxes as you desire. Experiment with shade schemes and font pairings. Alter, share or cooperate with other people on your work. Download Digital Marketing Toolkit Business To Business Marketing Transformation Success Metrics Sample PDF and find out how to give a successful presentation. Present a perfect display to your team and make your presentation unforgettable.

Content Advertising Pyramid For Lead Generation Structure PDF
This slide represents content marketing pyramid that showcase levels of content used by marketers to enhance numbers of leads. It covers blogs, infographics etc. Formulating a presentation can take up a lot of effort and time, so the content and message should always be the primary focus. The visuals of the PowerPoint can enhance the presenters message, so our Content Advertising Pyramid For Lead Generation Structure PDF was created to help save time. Instead of worrying about the design, the presenter can concentrate on the message while our designers work on creating the ideal templates for whatever situation is needed. Slidegeeks has experts for everything from amazing designs to valuable content, we have put everything into Content Advertising Pyramid For Lead Generation Structure PDF.

New Year Holidays PowerPoint Templates Ppt Backgrounds For Slides 1212
We present our New Year Holidays PowerPoint Templates PPT Backgrounds For Slides 1212.Download our New year PowerPoint Templates because you can see In any endeavour people matter most. Use our Festival PowerPoint Templates because you can Inform your team of the various means they have to achieve them. Present our Festival PowerPoint Templates because you have configured your targets, identified your goals as per priority and importance. Download and present our Holidays PowerPoint Templates because You have some unique ones up your sleeve. Expose the special features of these hotspots to the world around you. Use our Shapes PowerPoint Templates because it gives you really bright ideas.Use these PowerPoint slides for presentations relating to 2013 new year modeled with tridimensional numbers, new year, sign, festival, shape, holidays. The prominent colors used in the PowerPoint template are Green, White, Black. The feedback we get is that our New Year Holidays PowerPoint Templates PPT Backgrounds For Slides 1212 are One-of-a-kind. Customers tell us our with PowerPoint templates and PPT Slides help you meet deadlines which are an element of today's workplace. Just browse and pick the slides that appeal to your intuitive senses. PowerPoint presentation experts tell us our New Year Holidays PowerPoint Templates PPT Backgrounds For Slides 1212 look good visually. You can be sure our modeled PowerPoint templates and PPT Slides are effectively colour coded to prioritise your plans They automatically highlight the sequence of events you desire. We assure you our New Year Holidays PowerPoint Templates PPT Backgrounds For Slides 1212 look good visually. The feedback we get is that our numbers PowerPoint templates and PPT Slides are Radiant.
Key Statistics And Facts Of Our Company Graphics PDF
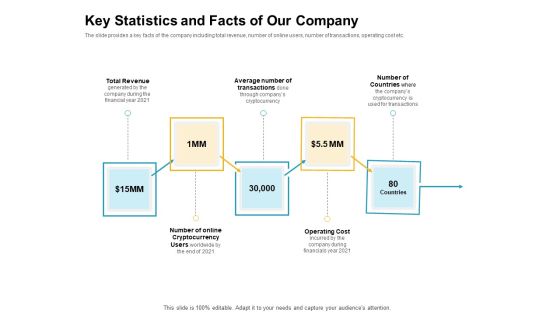
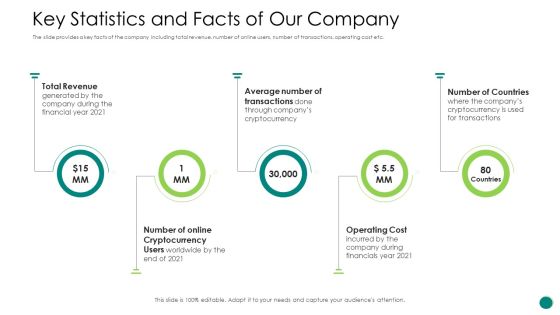
The slide provides a key facts of the company including total revenue, number of online users, number of transactions, operating cost etc. This is a key statistics and facts of our company graphics pdf template with various stages. Focus and dispense information on five stages using this creative set, that comes with editable features. It contains large content boxes to add your information on topics like revenue, operating cost, number of online cryptocurrency. You can also showcase facts, figures, and other relevant content using this PPT layout. Grab it now.
Investor Pitch Gain Funding From ICO Key Statistics And Facts Of Our Company Portrait PDF
The slide provides a key facts of the company including total revenue, number of online users, number of transactions, operating cost etc.Presenting investor pitch gain funding from ico key statistics and facts of our company portrait pdf. to provide visual cues and insights. Share and navigate important information on five stages that need your due attention. This template can be used to pitch topics like total revenue, average number of transactions, operating cost. In addtion, this PPT design contains high resolution images, graphics, etc, that are easily editable and available for immediate download.
Diminishing Market Share Of A Telecommunication Firm Case Competition Key Performance Indicators Summary PDF
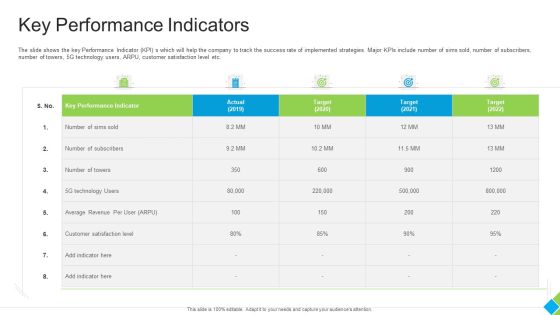
The slide shows the key Performance Indicator KPIs which will help the company to track the success rate of implemented strategies. Major KPIs include number of sims sold, number of subscribers, number of towers, 5G technology users, ARPU, customer satisfaction level etc. Deliver an awe inspiring pitch with this creative diminishing market share of a telecommunication firm case competition key performance indicators summary pdf bundle. Topics like technology, average revenue, customer satisfaction level, key performance indicator, target can be discussed with this completely editable template. It is available for immediate download depending on the needs and requirements of the user.

Key Performance Indicators Ppt Infographics Mockup PDF
The slide shows the key Performance Indicator KPI s which will help the company to track the success rate of implemented strategies. Major KPIs include number of sims sold, number of subscribers, number of towers, 5G technology users, ARPU, customer satisfaction level etc. This is a key performance indicators ppt infographics mockup pdf template with various stages. Focus and dispense information on one stage using this creative set, that comes with editable features. It contains large content boxes to add your information on topics like key performance indicator, technology, customer satisfaction level, target, 2019 to 2022. You can also showcase facts, figures, and other relevant content using this PPT layout. Grab it now.

Business Case Contest Car Company Sales Deficit Key Performance Indicators Formats PDF
The slide shows the key Performance Indicator KPIs which will help the company to track the success rate of implemented strategies. Major KPIs include number of vehicle sold and manufactured, utilization rate, number of visitors, customer satisfaction level etc.Deliver an awe-inspiring pitch with this creative business case contest car company sales deficit key performance indicators formats pdf. bundle. Topics like number of vehicle sold, defective units recall rates, 2020 to 2023 can be discussed with this completely editable template. It is available for immediate download depending on the needs and requirements of the user.
Key Performance Indicators To Tract Success Rate Of Strategy Designs PDF
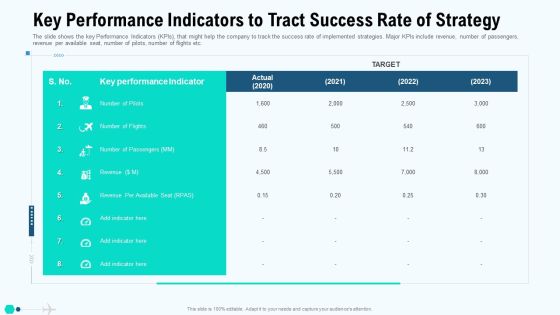
The slide shows the key Performance Indicators KPIs, that might help the company to track the success rate of implemented strategies. Major KPIs include revenue, number of passengers, revenue per available seat, number of pilots, number of flights etc. Deliver an awe inspiring pitch with this creative key performance indicators to tract success rate of strategy designs pdf bundle. Topics like key performance indicators to tract success rate of strategy can be discussed with this completely editable template. It is available for immediate download depending on the needs and requirements of the user.
Other Kpis Key Performance Indicators After Strategy Implementation Professional PDF
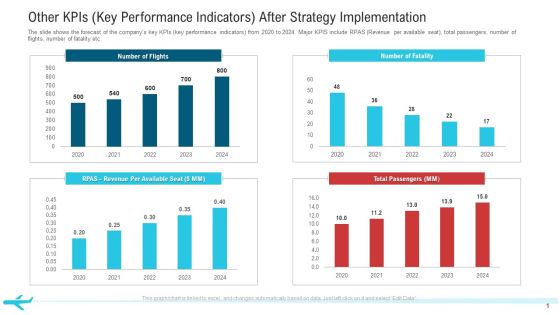
The slide shows the forecast of the companys key KPIs key performance indicators from 2020 to 2024. Major KPIS include RPAS Revenue per available seat, total passengers, number of flights, number of fatality etc.Deliver and pitch your topic in the best possible manner with this other KPIs key performance indicators after strategy implementation professional pdf. Use them to share invaluable insights on total passengers, number of flights, 2020 to 2024 and impress your audience. This template can be altered and modified as per your expectations. So, grab it now.

Key Performance Indicators To Tract Success Rate Of Strategy Summary PDF
The slide shows the key Performance Indicators KPIs, that might help the company to track the success rate of implemented strategies. Major KPIs include revenue, number of passengers, revenue per available seat, number of pilots, number of flights etc. Deliver and pitch your topic in the best possible manner with this key performance indicators to tract success rate of strategy summary pdf. Use them to share invaluable insights on revenue per available seat, target and impress your audience. This template can be altered and modified as per your expectations. So, grab it now.

Decreasing Insurance Rate In Countryside Communities Case Competition Key Performance Indicators Target Demonstration PDF
This slide shows the key performance indicators which includes number of insurance policies sold, number of households, total number of private companies etc.Deliver and pitch your topic in the best possible manner with this decreasing insurance rate in countryside communities case competition key performance indicators target demonstration pdf. Use them to share invaluable insights on policies sold in rural areas, premium collected, key performance indicator and impress your audience. This template can be altered and modified as per your expectations. So, grab it now.

Impact Of Using Advanced Product Designing Tools Ppt Show Clipart Images PDF
Mentioned slide shows monthly performance of current and forecasted performance of advanced product designing tools. Here the performance impact is measured by the number of prototypes developed and accepted. Deliver and pitch your topic in the best possible manner with this impact of using advanced product designing tools ppt show clipart images pdf. Use them to share invaluable insights on current performance, forecasted performance, number of prototypes developed, number of prototypes developed and impress your audience. This template can be altered and modified as per your expectations. So, grab it now.

Key Performance Indicators To Tract Success Rate Of Strategy Brochure PDF
The slide shows the key Performance Indicators KPIs, that might help the company to track the success rate of implemented strategies. Major KPIs include revenue, number of passengers, revenue per available seat, number of pilots, number of flights etc. Deliver an awe-inspiring pitch with this creative key performance indicators to tract success rate of strategy brochure pdf bundle. Topics like key performance indicator, target can be discussed with this completely editable template. It is available for immediate download depending on the needs and requirements of the user.

Construction Defect Claims Tracking Top 3 Countries Ppt Portfolio Influencers PDF
The slide shows the forecasted vehicle sale of company ABC construction company in top three countries United States, United Kingdom, India. For each country, it provides number of number of projects, number of defect claims in next five years 2020 to 2024. Deliver an awe inspiring pitch with this creative construction defect claims tracking top 3 countries ppt portfolio influencers pdf bundle. Topics like projects, construction defect claims tracking top 3 countries can be discussed with this completely editable template. It is available for immediate download depending on the needs and requirements of the user.
Rising Construction Defect Claims Against The Corporation Construction Defect Claims Tracking Top 3 Countries Introduction PDF
The slide shows the forecasted vehicle sale of company ABC construction company in top three countries United States, United Kingdom, India. For each country, it provides number of number of projects, number of defect claims in next five years 2021 2025. Deliver and pitch your topic in the best possible manner with this rising construction defect claims against the corporation construction defect claims tracking top 3 countries introduction pdf. Use them to share invaluable insights on construction projects, construction defect claims tracking top 3 countries and impress your audience. This template can be altered and modified as per your expectations. So, grab it now.

Key Performance Indicators To Tract Success Rate Of Strategy Structure PDF
The slide shows the key Performance Indicators KPIs, that might help the company to track the success rate of implemented strategies. Major KPIs include revenue, number of passengers, revenue per available seat, number of pilots, number of flights etc. Deliver an awe inspiring pitch with this creative key performance indicators to tract success rate of strategy structure pdf bundle. Topics like key performance indicators to tract success rate of strategy can be discussed with this completely editable template. It is available for immediate download depending on the needs and requirements of the user.

Construction Defect Claims Tracking Top 3 Countries Graphics PDF
The slide shows the forecasted vehicle sale of company ABC construction company in top three countries United States, United Kingdom, India. For each country, it provides number of number of projects, number of defect claims in next five years 2021 2025. Deliver and pitch your topic in the best possible manner with this construction defect claims tracking top 3 countries graphics pdf. Use them to share invaluable insights on construction defect claims tracking top 3 countries and impress your audience. This template can be altered and modified as per your expectations. So, grab it now.

Construction Defect Claims Tracking Top 3 Countries Guidelines PDF
The slide shows the forecasted vehicle sale of company ABC construction company in top three countries United States, United Kingdom, India. For each country, it provides number of number of projects, number of defect claims in next five years 2021 to 2025 Deliver and pitch your topic in the best possible manner with this construction defect claims tracking top 3 countries guidelines pdf. Use them to share invaluable insights on construction defect claims tracking top 3 countries and impress your audience. This template can be altered and modified as per your expectations. So, grab it now.
Surge In Construction Faults Lawsuits Case Competition Construction Defect Claims Tracking Top 3 Countries Structure PDF
The slide shows the forecasted vehicle sale of company ABC construction company in top three countries United States, United Kingdom, India. For each country, it provides number of number of projects, number of defect claims in next five years 2021 2025. Deliver and pitch your topic in the best possible manner with this surge in construction faults lawsuits case competition construction defect claims tracking top 3 countries structure pdf. Use them to share invaluable insights on construction defect claims tracking top 3 countries and impress your audience. This template can be altered and modified as per your expectations. So, grab it now.

Recruitment Training Enhance Candidate Hiring Process New Employee Retention Rate Ideas PDF
This slide provides the table of new employee retention rate with the details such as year, number of new hires, number of employee left the company, and number of employee retain by the company. Deliver an awe inspiring pitch with this creative recruitment training enhance candidate hiring process new employee retention rate ideas pdf bundle. Topics like new employee retention rate can be discussed with this completely editable template. It is available for immediate download depending on the needs and requirements of the user.

Details Of Monzos Funded Account Monzo Investor Funding Elevator Portrait PDF
The following slide provides information about the number of users that have a Monzo account that is funded along with the reasons for such a large number of funded account users. The increase in number of users is primarily due to organic social channel and word of mouth referral, exclusive PR and press coverage etc. Deliver an awe inspiring pitch with this creative details of monzos funded account monzo investor funding elevator portrait pdf bundle. Topics like organic social, cost, account can be discussed with this completely editable template. It is available for immediate download depending on the needs and requirements of the user.

Overview Of Ethical Hacking Company Ppt Professional Rules PDF
This slide describes the overview of the company including the number of countries in which services are provided, total number of certified experts, number of tools and technologies and so on. Presenting overview of ethical hacking company ppt professional rules pdf to provide visual cues and insights. Share and navigate important information on four stages that need your due attention. This template can be used to pitch topics like development, technologies. In addtion, this PPT design contains high resolution images, graphics, etc, that are easily editable and available for immediate download.
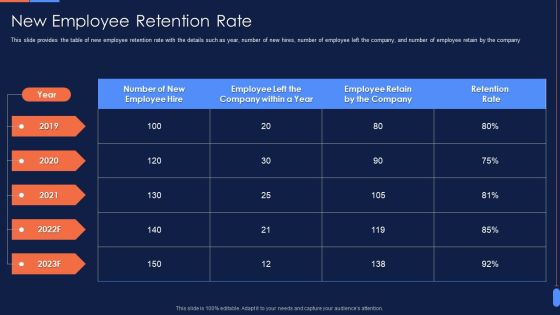
Recruitment Training To Optimize New Employee Retention Rate Portrait PDF
This slide provides the table of new employee retention rate with the details such as year, number of new hires, number of employee left the company, and number of employee retain by the company. Deliver and pitch your topic in the best possible manner with this Recruitment Training To Optimize New Employee Retention Rate Portrait PDF. Use them to share invaluable insights on Employee, Retention Rate, 2019 To 2023 and impress your audience. This template can be altered and modified as per your expectations. So, grab it now.

Automotive Company Introduction With Enterprise Profile Pictures PDF
This slide shows the company introduction of an automotive firm. It includes company details such as the year of establishment, number of employees, number of branches worldwide, range of products offered, number of satisfied customers. Presenting Automotive Company Introduction With Enterprise Profile Pictures PDF to dispense important information. This template comprises five stages. It also presents valuable insights into the topics including Founded, Products, Satisfied Customers. This is a completely customizable PowerPoint theme that can be put to use immediately. So, download it and address the topic impactfully.
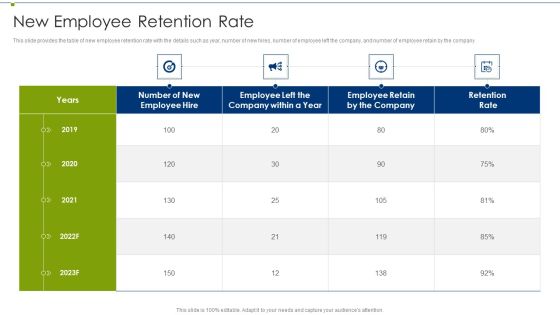
Recruitment Training Program For Workforce New Employee Retention Rate Themes PDF
This slide provides the table of new employee retention rate with the details such as year, number of new hires, number of employee left the company, and number of employee retain by the company Deliver and pitch your topic in the best possible manner with this Recruitment Training Program For Workforce New Employee Retention Rate Themes PDF Use them to share invaluable insights on New Employee Retention Rate and impress your audience. This template can be altered and modified as per your expectations. So, grab it now.
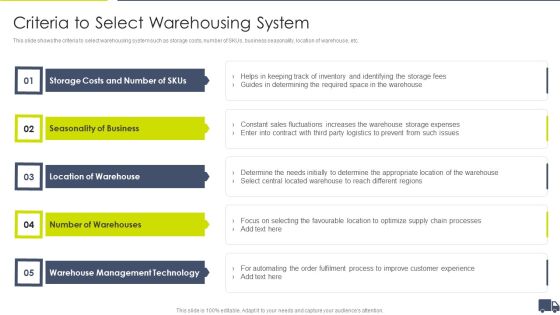
Enhancing Logistics Customer Service Criteria To Select Warehousing System Structure PDF
This slide shows the criteria to select warehousing system such as storage costs, number of SKUs, business seasonality, location of warehouse, etc. Presenting Enhancing Logistics Customer Service Criteria To Select Warehousing System Structure PDF to provide visual cues and insights. Share and navigate important information on five stages that need your due attention. This template can be used to pitch topics like Storage Costs Number, Seasonality Business Location, Warehouse Number Warehouses. In addtion, this PPT design contains high resolution images, graphics, etc, that are easily editable and available for immediate download.

Overview Of The CPS Company Ppt Ideas Graphics Tutorials PDF
This slide describes the overview of the company including the number of countries in which services are provided, total number of certified experts, number of tools and technologies used and so on. This is a Overview Of The CPS Company Ppt Ideas Graphics Tutorials PDF template with various stages. Focus and dispense information on four stages using this creative set, that comes with editable features. It contains large content boxes to add your information on topics like Certified Experts, Technologies. You can also showcase facts, figures, and other relevant content using this PPT layout. Grab it now.

Business Monthly Customer Engagement Report Summary For Website Sample PDF
The following slide highlights the customer engagement report for website for December month. It showcases number of users, number of sessions, number of page view, bounce rate, session trend, sessions by city, sessions by medium, channel engagement, device used and sessions by operating system.Showcasing this set of slides titled Business Monthly Customer Engagement Report Summary For Website Sample PDF The topics addressed in these templates are Channel Engagement, Operating System, Bounce Rate All the content presented in this PPT design is completely editable. Download it and make adjustments in color, background, font etc. as per your unique business setting.

Film Making Firm Profile Key Stats And Figure Ppt PowerPoint Presentation File Graphics PDF
This slide showcases the statistics associated with film production house which includes global box office collection, revenue, number of released movies, average hours of production, number of crew members, etc. This is a Film Making Firm Profile Key Stats And Figure Ppt PowerPoint Presentation File Graphics PDF template with various stages. Focus and dispense information on one stages using this creative set, that comes with editable features. It contains large content boxes to add your information on topics like Global Box Office, Collection Average Hours, Number Production. You can also showcase facts, figures, and other relevant content using this PPT layout. Grab it now.

Motion Pictures Production Company Profile Key Stats And Figure Background PDF
This slide showcases the statistics associated with film production house which includes global box office collection, revenue, number of released movies, average hours of production, number of crew members, etc. This is a Motion Pictures Production Company Profile Key Stats And Figure Background PDF template with various stages. Focus and dispense information on one stages using this creative set, that comes with editable features. It contains large content boxes to add your information on topics like Global Box Office, Collection 2022, Revenue Till Date, Number Production. You can also showcase facts, figures, and other relevant content using this PPT layout. Grab it now.

Marketing Key Performance Indicators For Business Plan Review Template PDF
The following slide showcases targets of essential KPIs used in marketing to be tracked in campaign. Key indicators covered are number of conversions, leads and customer acquisition. Presenting Marketing Key Performance Indicators For Business Plan Review Template PDF to dispense important information. This template comprises three stages. It also presents valuable insights into the topics including Number Of Conversion, Number Of Leads, Customer Acquisition. This is a completely customizable PowerPoint theme that can be put to use immediately. So, download it and address the topic impactfully.

Key Performance Indicators Of Service Desk Problem Management Elements PDF
This slide showcases key metrics tracked and measured for incident management. Metrics included are incident response time, number of unresolved incidents, reopen rate, total cost per contact, customer satisfaction and first call resolution rate. Presenting Key Performance Indicators Of Service Desk Problem Management Elements PDF to dispense important information. This template comprises eight stages. It also presents valuable insights into the topics including Incident Response Time, Number Of Unresolved Incidents, Number Of Contacts Handled. This is a completely customizable PowerPoint theme that can be put to use immediately. So, download it and address the topic impactfully.

Cyber Intelligent Computing System Overview Of The CPS Company Mockup PDF
This slide describes the overview of the company including the number of countries in which services are provided, total number of certified experts, number of tools and technologies used and so on. Presenting Cyber Intelligent Computing System Overview Of The CPS Company Mockup PDF to provide visual cues and insights. Share and navigate important information on four stages that need your due attention. This template can be used to pitch topics like Certified Experts, Technologies, Countries. In addtion, this PPT design contains high resolution images, graphics, etc, that are easily editable and available for immediate download.

Customer Service KPI Dashboard For Technical Support Ppt Model Vector PDF
This slide covers customer service KPI dashboard for technical support. It involves details such as total number of issues arise daily, overall average response time, number of issues by channel and top performing technical engineers. Pitch your topic with ease and precision using this Customer Service KPI Dashboard For Technical Support Ppt Model Vector PDF. This layout presents information on Overall Average, Response Time, Total Number, Issues Arise Daily. It is also available for immediate download and adjustment. So, changes can be made in the color, design, graphics or any other component to create a unique layout.

Social Media Monitoring Platform Tool KPI Dashboard Ppt Gallery Show PDF
The following slide highlights the key insights of social media monitoring tools. It includes elements such as number of followers, total posts, impression, number of views, type of content breakdown etc. Showcasing this set of slides titled Social Media Monitoring Platform Tool KPI Dashboard Ppt Gallery Show PDF. The topics addressed in these templates are Number Followers, New Followers Added, Total Impressions. All the content presented in this PPT design is completely editable. Download it and make adjustments in color, background, font etc. as per your unique business setting.

Backlog Refinement Process Report With Tasks And Status Ppt Pictures Clipart Images PDF
This slide covers the tasks that are in process of backlog refinement and their status. It also includes the number of sprints, priority level, release number and their acceptance criteria. Showcasing this set of slides titled Backlog Refinement Process Report With Tasks And Status Ppt Pictures Clipart Images PDF. The topics addressed in these templates are Priority, Release number, Acceptance criteria. All the content presented in this PPT design is completely editable. Download it and make adjustments in color, background, font etc. as per your unique business setting.

Kpis To Track Partnership Project Administration Graphics PDF
This slide covers KPIs which can be measure performance of partnership project management. It includes key performance indicators such as number of partners, revenue through partners, proper satisfaction and number of deal registrations. Pitch your topic with ease and precision using this Kpis To Track Partnership Project Administration Graphics PDF. This layout presents information on Partner Satisfaction, Revenue Through Partners, Number Of Partners. It is also available for immediate download and adjustment. So, changes can be made in the color, design, graphics or any other component to create a unique layout.
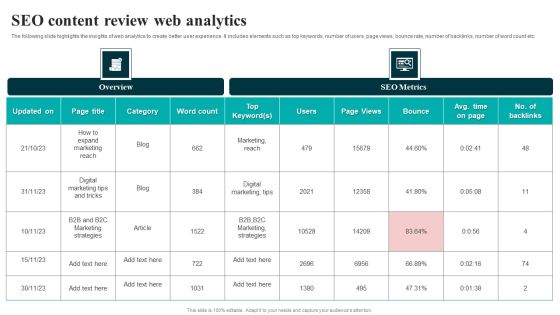
SEO Content Review Web Analytics Download PDF
The following slide highlights the insights of web analytics to create better user experience. It includes elements such as top keywords, number of users, page views, bounce rate, number of backlinks, number of word count etc. Showcasing this set of slides titled SEO Content Review Web Analytics Download PDF. The topics addressed in these templates are Marketing Reach, Digital Marketing Tips. All the content presented in this PPT design is completely editable. Download it and make adjustments in color, background, font etc. as per your unique business setting.

In Store Product Pickup Process Flow Diagram Rules PDF
This slide illustrates in store product pickup process to improve customer purchase experience. It includes steps such as customer product selection with instore pick up option, payment, send acceptance email, order tracking number, check order tracking number, deliver product to customers. Pitch your topic with ease and precision using this In Store Product Pickup Process Flow Diagram Rules PDF. This layout presents information on Number Customer, Order Acceptance, Delivery Management. It is also available for immediate download and adjustment. So, changes can be made in the color, design, graphics or any other component to create a unique layout.
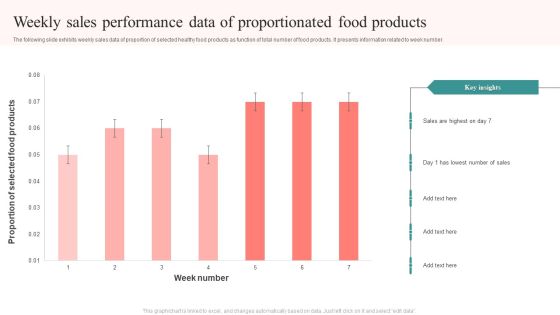
Weekly Sales Performance Data Of Proportionated Food Products Structure PDF
The following slide exhibits weekly sales data of proportion of selected healthy food products as function of total number of food products. It presents information related to week number. Showcasing this set of slides titled Weekly Sales Performance Data Of Proportionated Food Products Structure PDF. The topics addressed in these templates are Proportion Selected, Food Products, Week Number, Sales Highest. All the content presented in this PPT design is completely editable. Download it and make adjustments in color, background, font etc. as per your unique business setting.

Impact Of Compliance Trainings One Pager Documents
This slide highlights the impact of compliance training in terms of the number of employees trained, the absolute number of accidents at work and, the number of work related fatalities. Presenting you an exemplary Impact Of Compliance Trainings One Pager Documents. Our one-pager comprises all the must-have essentials of an inclusive document. You can edit it with ease, as its layout is completely editable. With such freedom, you can tweak its design and other elements to your requirements. Download this Impact Of Compliance Trainings One Pager Documents brilliant piece now.
Tracker For Time Based Quality Kpis In Project Management Ideas PDF
This slide displays project wise comparative analysis on the basis of planned and actual time it takes for completion. It includes details such as number of tasks and work completed, average number of hours, start and end dates, etc. Pitch your topic with ease and precision using this Tracker For Time Based Quality Kpis In Project Management Ideas PDF. This layout presents information on Time, Work Completed, Avg Number, Hours Per Task. It is also available for immediate download and adjustment. So, changes can be made in the color, design, graphics or any other component to create a unique layout.

Consumer Partition Dashboard For Email Campaigns Infographics PDF
The following slide depicts a dashboard which can be used by marketers for sending targeted mails to customers and enhance customer retention. The key performing indicators are number of customers, average value or orders, number of orders, top ten percent customers etc. Showcasing this set of slides titled Consumer Partition Dashboard For Email Campaigns Infographics PDF. The topics addressed in these templates are Average Life Time Value, Average Value Of Orders, Returns, Average Number Of Orders. All the content presented in this PPT design is completely editable. Download it and make adjustments in color, background, font etc. as per your unique business setting.

PowerPoint Design Gear Process Company Ppt Template
PowerPoint Design Gear Process Company PPT Template-This PowerPoint diagram shows three gears that represent three processes. You can add data depending on the number of processes you want to include in your presentation.-PowerPoint Design Gear Process Company PPT Template

Stock Photo Golden Wreath Around Dollar Symbol PowerPoint Slide
Our unique image is designed with golden laurel trophy for number one position. This image clearly defines the award, win bravery, merit etc. Special effects of this image will surely interest the audience.

0814 1 Label Ribbon Batch Image For Championship Image Graphics For PowerPoint
This business image has been designed with number 1 label ribbon batch. This image shows the concept of championship and winner. Use this image in your sports and tournament related topics. Make awesome presentation with this innovative image.

0814 3 Label Ribbon Batch For Championship Image Graphics For PowerPoint
Define the concepts of Sports, Award and winners with this unique image. This image has been designed with graphic of ribbon batch with number 3 label. Make a professional presentation for your audience with this unique image.

Business Framework Portfolio Risk 01 PowerPoint Presentation
This business framework image slide displays portfolio risk graph PowerPoint template. Use this image slide, in your presentations to depict portfolio risk measures like number of stocks and returns. Make your presentations outshine using this image slide.
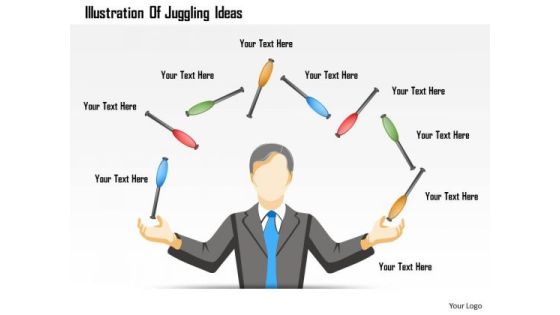
Business Diagram Illustration Of Juggling Ideas Presentation Template
This business diagram has been designed with graphic of 3d man who is doing juggling sticks. This diagram can be used to display number of decisions and juggling many ideas. Use this image template to make outstanding presentation.
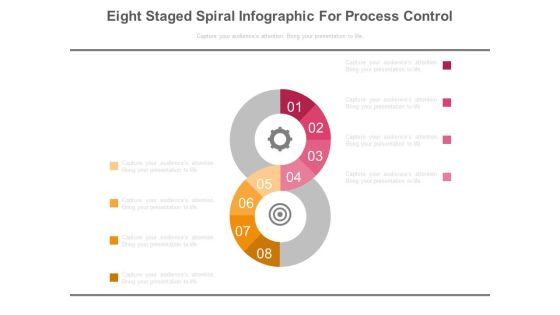
Eight Steps Dashboard Matrics Powerpoint Slides
This PowerPoint template eight number infographic chart. Download this PPT chart to depict target planning. This PowerPoint slide is of great help in the business sector to make realistic presentations and provides effective way of presenting your newer thoughts.

Pentagon Shape Infographic Diagram Powerpoint Template
Our above business diagram has been designed with number banners and record and file icons. This slide is suitable to present steps of book keeping. Use this business diagram to present your work in a more smart and precise manner.
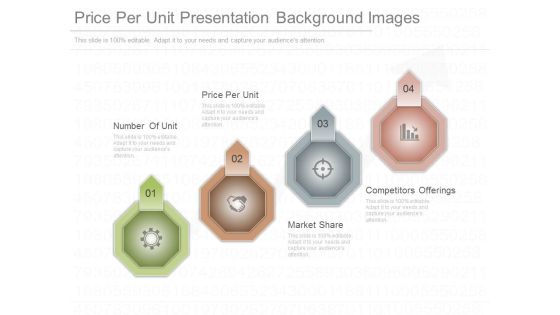
Price Per Unit Presentation Background Images
This is a price per unit presentation background images. This is a four stage process. The stages in this process are number of unit, price per unit, market share, competitors offerings.

Qualified Sales Leads From Social Powerpoint Slide Clipart
This is a qualified sales leads from social powerpoint slide clipart. This is a four stage process. The stages in this process are qualified sales leads from social, reach within target audience, number of issues resolved, products innovation.
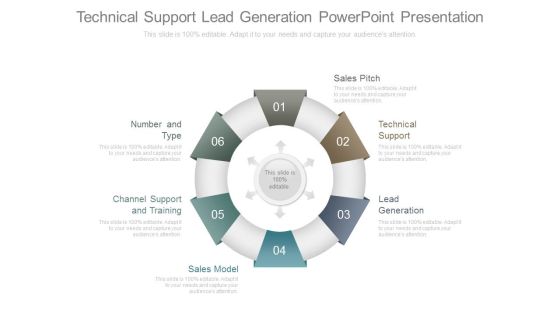
Technical Support Lead Generation Powerpoint Presentation
This is a technical support lead generation powerpoint presentation. This is a six stage process. The stages in this process are sales pitch, technical support, lead generation, sales model, channel support and training, number and type.

Customer Injury Rate Powerpoint Slides Download
This is a customer injury rate powerpoint slides download. This is a seven stage process. The stages in this process are customer injury rate, number of positions filled, customer commendation, crime rate, capital found expanding, customer complaint rate, escalator availability.
Sales Call Tracking Diagram Powerpoint Shapes
This is a sales call tracking diagram powerpoint shapes. This is a four stage process. The stages in this process are online search clicks on adds, unique phone number for customer call, call to customer care, tracking to ppc campaign.

Dashboard Design And Development For Travel Diagram Background
This is a dashboard design and development for travel diagram background. This is a five stage process. The stages in this process are number of trips, sales, delayed flights, regional load, flight expense.

Bargaining Strength Presentation Visual Aids
This is a bargaining strength presentation visual aids. This is a six stage process. The stages in this process are number of suppliers, bargaining strength, price sensitivity, switching costs, uniqueness of offering, economies of scale.

Diversification To Risk Reduction Template Ppt Examples Slides
This is a diversification to risk reduction template ppt examples slides. This is a six stage process. The stages in this process are portfolio risk, total risk, unique risk, market risk, systematic risk, number of stocks.
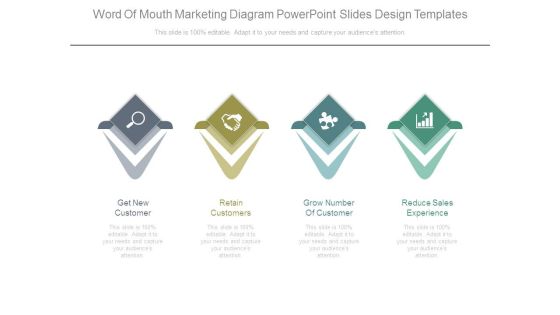
Word Of Mouth Marketing Diagram Powerpoint Slides Design Templates
This is a word of mouth marketing diagram powerpoint slides design templates. This is a four stage process. The stages in this process are get new customer, retain customers, grow number of customer, reduce sales experience.

Brainstorming Session Attribute Listing Technique Presentation Layouts
This is a brainstorming session attribute listing technique presentation layouts. This is a four stage process. The stages in this process are voting criteria, total number of votes, idea.

Business Competition Comparison Table Ppt Icon
This is a business competition comparison table ppt icon. This is a seven stage process. The stages in this process are criteria, revenue, profit, market share, main activity, number of employee, product quality, insert your text, competitor.

Business Competition Comparison And Analysis Table Powerpoint Slides
This is a business competition comparison and analysis table powerpoint slides. This is a six stage process. The stages in this process are criteria, revenue, profit, market share, main activity, number of employee, product quality, competitor.

Criteria Based Competition Comparison Table Powerpoint Slides
This is a criteria based competition comparison table powerpoint slides. This is a seven stage process. The stages in this process are revenue, profit, market share, main activity, number of employee, product quality.
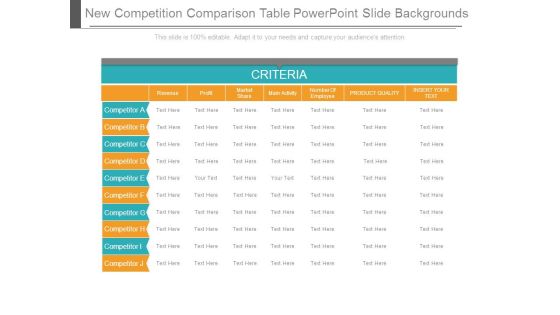
New Competition Comparison Table Powerpoint Slide Backgrounds
This is a new competition comparison table powerpoint slide backgrounds. This is a seven stage process. The stages in this process are revenue, profit, market share, main activity, number of employee, product quality, insert your text.

Competition Comparison Table With New Criteria Powerpoint Ideas
This is a competition comparison table with new criteria powerpoint ideas. This is a seven stage process. The stages in this process are revenu, profit, market share, main activity, number of employee, product quality, insert your text.

Competition Comparison Criteria Review Table Powerpoint Slide Templates Download
This is a competition comparison criteria review table powerpoint slide templates download. This is a six stage process. The stages in this process are criteria, competitor revenue, profit, market share, main activity, number of employee, product quality, insert your text.

Competition Comparison Table For New Business Presentation Powerpoint Templates
This is a competition comparison table for new business presentation powerpoint templates. This is a seven stage process. The stages in this process are criteria, revenue, profit, market share, main activity, number of employee, product quality, insert your text.

Business Comparison Table Sample Ppt Presentation
This is a business comparison table sample ppt presentation. This is a seven stage process. The stages in this process are criteria, revenue, profit, market, share, main activity, number of employee, product quality, insert your text, competitor.

Competitor Analysis Tools Ppt PowerPoint Presentation Example File
This is a competitor analysis tools ppt powerpoint presentation example file. This is a five stage process. The stages in this process are criteria, revenue, profit, market share, main activity, number of employee, product quality.

Competition Comparison Table For New Business Ppt PowerPoint Presentation Slides
This is a competition comparison table for new business ppt powerpoint presentation slides. This is a seven stage process. The stages in this process are criteria, revenue, profit, market share, main activity, number of employee, product quality, competitor.

Competitor Analysis Chart Ppt PowerPoint Presentation Visuals
This is a competitor analysis chart ppt powerpoint presentation visuals. This is a five stage process. The stages in this process are revenue, profit, market share, main activity, number of employee, product quality.

Competitors Analysis Report Ppt PowerPoint Presentation Introduction
This is a competitors analysis report ppt powerpoint presentation introduction. This is a seven stage process. The stages in this process are criteria, revenue, profit, market share, main activity, number of employee.

Measuring Content Marketing Performance Ppt PowerPoint Presentation Design Ideas
This is a measuring content marketing performance ppt powerpoint presentation design ideas. This is a eight stage process. The stages in this process are conversion rate, quality of leads, website traffic, number of leads, sales revenue, subscriber list growth.

Competition Comparison Table Ppt PowerPoint Presentation Outline
This is a competition comparison table ppt powerpoint presentation outline. This is a seven stage process. The stages in this process are revenue, profit, market share, main activity, number of employee, product quality.

Current State Analysis Our Market Share Ppt PowerPoint Presentation Topics
This is a current state analysis our market share ppt powerpoint presentation topics. This is a six stage process. The stages in this process are we took number 3 spot in the market, competitor.

Competition Comparison Table Ppt PowerPoint Presentation Slide
This is a competition comparison table ppt powerpoint presentation slide. This is a six stage process. The stages in this process are revenue, profit, market share, main activity, number of employee, product quality.

Competitor Analysis Template Ppt PowerPoint Presentation Guidelines
This is a competitor analysis template ppt powerpoint presentation guidelines. This is a five stage process. The stages in this process are revenue, profit, market share, competitor, number of employee.

Competition Comparison Table Ppt PowerPoint Presentation Visual Aids
This is a competition comparison table ppt powerpoint presentation visual aids. This is a six stage process. The stages in this process are revenue, profit, market share, main activity, number of employee, product quality.

Competition Comparison Table Ppt PowerPoint Presentation Backgrounds
This is a competition comparison table ppt powerpoint presentation backgrounds. This is a seven stage process. The stages in this process are revenue, profit, market share , main activity, number of employee, product quality , insert your text.

Competitor Analysis Template Ppt PowerPoint Presentation Model
This is a competitor analysis template ppt powerpoint presentation model. This is a five stage process. The stages in this process are revenue, profit, market share, main activity, number of employee, product quality.

Competition Comparison Table Ppt PowerPoint Presentation Microsoft
This is a competition comparison table ppt powerpoint presentation microsoft. This is a seven stage process. The stages in this process are criteria, revenue, market share, number of employee, insert your text.

Competitor Analysis Template Ppt PowerPoint Presentation Example File
This is a competitor analysis template ppt powerpoint presentation example file. This is a five stage process. The stages in this process are revenue, profit, market share, main activity, number of employee, product quality.

Analyse Competition Ppt PowerPoint Presentation Themes
This is a analyse competition ppt powerpoint presentation themes. This is a seven stage process. The stages in this process are profit, revenue, market share, main activity, number of employee.

Competitor Analysis Template Ppt PowerPoint Presentation Ideas
This is a competitor analysis template ppt powerpoint presentation ideas. This is a five stage process. The stages in this process are revenue, profit, market share, number of employee, product quality, main activity, revenue.

Competitor Analysis Template Ppt PowerPoint Presentation Outline Format Ideas
This is a competitor analysis template ppt powerpoint presentation outline format ideas. This is a four stage process. The stages in this process are revenue, profit, market share, number of employee, product quality, main activity, revenue.

Competitor Analysis Comparison Table Ppt PowerPoint Presentation Outline Slides
This is a competitor analysis comparison table ppt powerpoint presentation outline slides. This is a two stage process. The stages in this process are revenue, profit, market share, main activity, number of employee, product quality.

Competitor Analysis Comparison Table Ppt PowerPoint Presentation Icon Designs Download
This is a competitor analysis comparison table ppt powerpoint presentation icon designs download. This is a seven stage process. The stages in this process are revenue, profit, market share, main activity, number of employee, product quality.
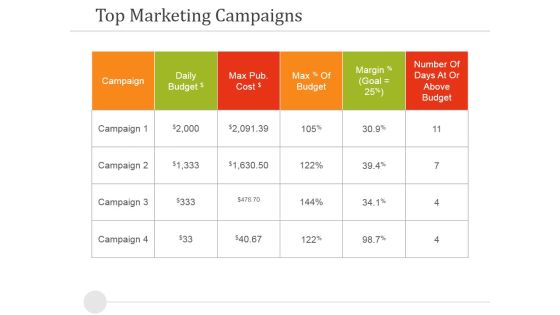
Top Marketing Campaigns Ppt PowerPoint Presentation Pictures Ideas
This is a top marketing campaigns ppt powerpoint presentation pictures ideas. This is a six stage process. The stages in this process are campaign, daily budget, max of budget, number of days at or above budget.

 Home
Home