Number Icons
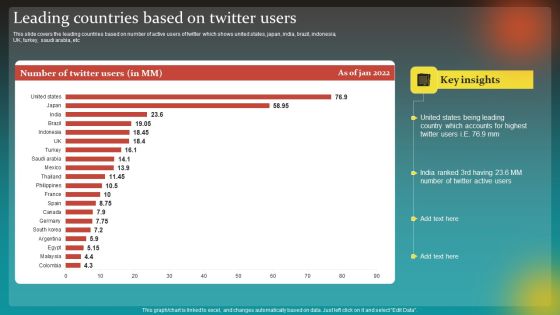
Social Network Business Summary Leading Countries Based On Twitter Users Summary PDF
This slide covers the leading countries based on number of active users of twitter which shows united states, japan, india, brazil, indonesia, UK, turkey, saudi arabia, etc Boost your pitch with our creative Social Network Business Summary Leading Countries Based On Twitter Users Summary PDF. Deliver an awe-inspiring pitch that will mesmerize everyone. Using these presentation templates you will surely catch everyones attention. You can browse the ppts collection on our website. We have researchers who are experts at creating the right content for the templates. So you do not have to invest time in any additional work. Just grab the template now and use them.
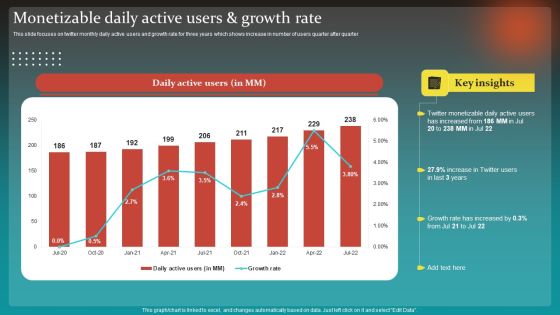
Social Network Business Summary Monetizable Daily Active Users And Growth Rate Professional PDF
This slide focuses on twitter monthly daily active users and growth rate for three years which shows increase in number of users quarter after quarter Slidegeeks is one of the best resources for PowerPoint templates. You can download easily and regulate Social Network Business Summary Monetizable Daily Active Users And Growth Rate Professional PDF for your personal presentations from our wonderful collection. A few clicks is all it takes to discover and get the most relevant and appropriate templates. Use our Templates to add a unique zing and appeal to your presentation and meetings. All the slides are easy to edit and you can use them even for advertisement purposes.

Dashboard For Monthly Procurement Process Automated Workflow Brochure PDF
This slide presents a dashboard for monthly procurement activities in an organization. It includes number of suppliers, contract attainted, supplier share, top supplier report, average procurement cycle time, etc. Want to ace your presentation in front of a live audience Our Dashboard For Monthly Procurement Process Automated Workflow Brochure PDF can help you do that by engaging all the users towards you. Slidegeeks experts have put their efforts and expertise into creating these impeccable powerpoint presentations so that you can communicate your ideas clearly. Moreover, all the templates are customizable, and easy to edit and downloadable. Use these for both personal and commercial use.
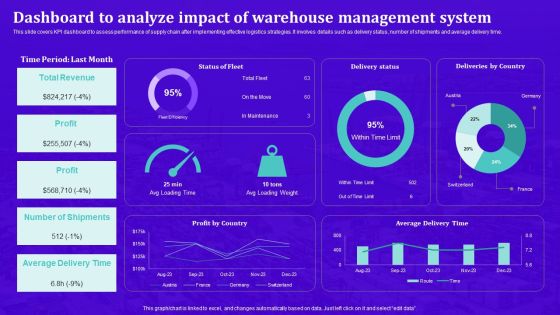
Techniques For Effective Supply Chain Management Dashboard To Analyze Impact Warehouse Management Background PDF
This slide covers KPI dashboard to assess performance of supply chain after implementing effective logistics strategies. It involves details such as delivery status, number of shipments and average delivery time. The best PPT templates are a great way to save time, energy, and resources. Slidegeeks have 100 percent editable powerpoint slides making them incredibly versatile. With these quality presentation templates, you can create a captivating and memorable presentation by combining visually appealing slides and effectively communicating your message. Download Techniques For Effective Supply Chain Management Dashboard To Analyze Impact Warehouse Management Portrait PDF from Slidegeeks and deliver a wonderful presentation.
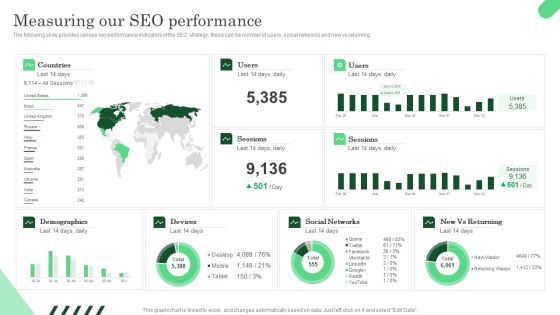
Measuring Our SEO Performance Ppt PowerPoint Presentation File Gallery PDF
The following slide provides various key performance indicators of the SEO strategy, these can be number of users, social networks and new vs returning. This Measuring Our SEO Performance Ppt PowerPoint Presentation File Gallery PDF is perfect for any presentation, be it in front of clients or colleagues. It is a versatile and stylish solution for organizing your meetings. The Measuring Our SEO Performance Ppt PowerPoint Presentation File Gallery PDF features a modern design for your presentation meetings. The adjustable and customizable slides provide unlimited possibilities for acing up your presentation. Slidegeeks has done all the homework before launching the product for you. So, do not wait, grab the presentation templates today

Review Yearly Employee Engagement Score With Kpi Dashboard Ppt Pictures Design Ideas PDF
The following slide showcases annual employee engagement scores to measure employee activeness. It includes elements such as response rate, net promotor score, monthly engagement rate, number of responses, teams, accuracy etc. From laying roadmaps to briefing everything in detail, our templates are perfect for you. You can set the stage with your presentation slides. All you have to do is download these easy to edit and customizable templates. Review Yearly Employee Engagement Score With Kpi Dashboard Ppt Pictures Design Ideas PDF will help you deliver an outstanding performance that everyone would remember and praise you for. Do download this presentation today.

Online Video Content Provider Business Profile Netflix Subscribers By Year Infographics PDF
This slide represents the number of Netflix paid subscribers in last five years from 2018 to 2022 which shows increase in subscribers year after year. Make sure to capture your audiences attention in your business displays with our gratis customizable Online Video Content Provider Business Profile Netflix Subscribers By Year Infographics PDF. These are great for business strategies, office conferences, capital raising or task suggestions. If you desire to acquire more customers for your tech business and ensure they stay satisfied, create your own sales presentation with these plain slides.
Monthly Sales Performance Tracking And Monitoring Dashboard Designs PDF
This slide showcases a dashboard presenting various metrics to measure and analyze sales performance for revenue growth. It includes key components such as number of sales, revenue, profit, cost, sales revenue, sales increment, cost analysis and cross sell. Make sure to capture your audiences attention in your business displays with our gratis customizable Monthly Sales Performance Tracking And Monitoring Dashboard Designs PDF. These are great for business strategies, office conferences, capital raising or task suggestions. If you desire to acquire more customers for your tech business and ensure they stay satisfied, create your own sales presentation with these plain slides.

Corporate Driving Innovation Hub Trends Download PDF
The following slide highlights the key statistical trends in corporate innovation center to attain expertise and optimize resources. It includes the data associated with the number of innovation centers across worldwide. Pitch your topic with ease and precision using this Corporate Driving Innovation Hub Trends Download PDF. This layout presents information on Worldwide, Key Insights, Hub Trends. It is also available for immediate download and adjustment. So, changes can be made in the color, design, graphics or any other component to create a unique layout.

Skill Enhancement Plan Dashboard For Training Program Evaluation Download PDF
This slide showcases dashboard that can help organization to evaluate the training program implemented in organization. Its key components are training cost, number of participants, hours of training, cost per participant and occupancy rate. From laying roadmaps to briefing everything in detail, our templates are perfect for you. You can set the stage with your presentation slides. All you have to do is download these easy-to-edit and customizable templates. Skill Enhancement Plan Dashboard For Training Program Evaluation Download PDF will help you deliver an outstanding performance that everyone would remember and praise you for. Do download this presentation today.
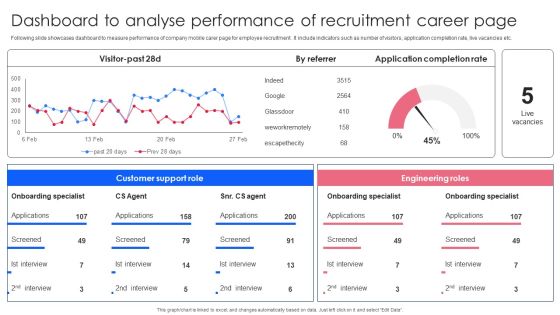
Effective Guide To Build Strong Online Hiring Strategy Dashboard To Analyse Performance Of Recruitment Download PDF
Following slide showcases dashboard to measure performance of company mobile carer page for employee recruitment . It include indicators such as number of visitors, application completion rate, live vacancies etc. Boost your pitch with our creative Effective Guide To Build Strong Online Hiring Strategy Dashboard To Analyse Performance Of Recruitment Download PDF. Deliver an awe-inspiring pitch that will mesmerize everyone. Using these presentation templates you will surely catch everyones attention. You can browse the ppts collection on our website. We have researchers who are experts at creating the right content for the templates. So you do not have to invest time in any additional work. Just grab the template now and use them.

Impact 1 Increased Customer Churn Rate And Support Tickets Sample PDF
This slide showcases the negative impact of customer onboarding challenges on the business. The challenges covered are increased user churn rate and number of onboarding support tickets. Create an editable Impact 1 Increased Customer Churn Rate And Support Tickets Sample PDF that communicates your idea and engages your audience. Whether youre presenting a business or an educational presentation, pre designed presentation templates help save time. Impact 1 Increased Customer Churn Rate And Support Tickets Sample PDF is highly customizable and very easy to edit, covering many different styles from creative to business presentations. Slidegeeks has creative team members who have crafted amazing templates. So, go and get them without any delay.

Safety Kpis Dashboard For Manufacturing Company Slides PDF
This slide shows the metrics dashboard representing the safety metrics for the manufacturing company. It includes details related to incidents per employee, total number of incidents in the company, incidents accumulated total etc.. Pitch your topic with ease and precision using this Safety Kpis Dashboard For Manufacturing Company Slides PDF. This layout presents information on Incidents Per Employee, Safety Incident Reported, Incidence Avoidance Quiz Score. It is also available for immediate download and adjustment. So, changes can be made in the color, design, graphics or any other component to create a unique layout.
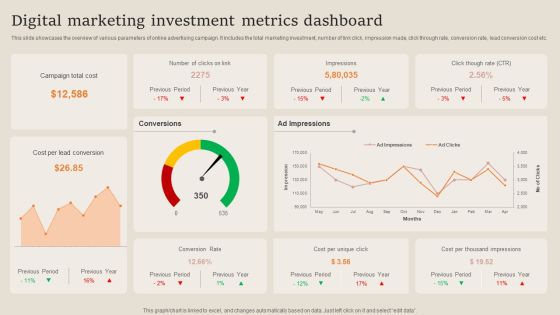
Digital Marketing Investment Metrics Dashboard Professional PDF
This slide showcases the overview of various parameters of online advertising campaign. It includes the total marketing investment, number of link click, impression made, click through rate, conversion rate, lead conversion cost etc. Showcasing this set of slides titled Digital Marketing Investment Metrics Dashboard Professional PDF. The topics addressed in these templates are Campaign Total Cost, Cost Per Lead Conversion, Investment Metrics Dashboard. All the content presented in this PPT design is completely editable. Download it and make adjustments in color, background, font etc. as per your unique business setting.

Call Center Kpis Agent Performance Dashboard Clipart PDF
This slide covers contact center agent performance metrics KPI dashboard. It involves metrics such as number of calls, average response time, average hold time, daily average transfer rate and agents with most hold time and transfer rate. Showcasing this set of slides titled Call Center Kpis Agent Performance Dashboard Clipart PDF. The topics addressed in these templates are Transfer Rate, Call Center, Hold Time. All the content presented in this PPT design is completely editable. Download it and make adjustments in color, background, font etc. as per your unique business setting.

Call Center Kpis Dashboard For Chat Management Graphics PDF
This slide covers contact center KPI dashboard for chat management. It involves details such as chats over time by site, location and language, total number of chats, average response time by employees. Showcasing this set of slides titled Call Center Kpis Dashboard For Chat Management Graphics PDF. The topics addressed in these templates are Management, Employees, Chats. All the content presented in this PPT design is completely editable. Download it and make adjustments in color, background, font etc. as per your unique business setting.

Call Center Kpis Dashboard With Data Management Infographics PDF
This slide covers contact center metrics KPI dashboard with call data details. It involves details such as total number of contacts handled, product sales, repeated calls and contact handles per day. Pitch your topic with ease and precision using this Call Center Kpis Dashboard With Data Management Infographics PDF. This layout presents information on Achieved, Contacts Handled, Repeated Calls. It is also available for immediate download and adjustment. So, changes can be made in the color, design, graphics or any other component to create a unique layout.

Call Center Performance KPI Dashboard Formats PDF
This slide covers contact center performance metrics KPI dashboard. It involves details such as number of total calls, average answer speed, abandon rate, data of agents performance and call abandon rate by departments. Showcasing this set of slides titled Call Center Performance KPI Dashboard Formats PDF. The topics addressed in these templates are Department, Dashboard, Agreement Limits. All the content presented in this PPT design is completely editable. Download it and make adjustments in color, background, font etc. as per your unique business setting.
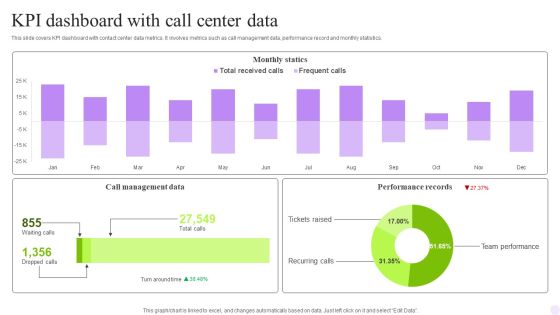
KPI Dashboard With Call Center Data Rules PDF
This slide covers contact center performance metrics KPI dashboard. It involves details such as number of total calls, average answer speed, abandon rate, data of agents performance and call abandon rate by departments. Pitch your topic with ease and precision using this KPI Dashboard With Call Center Data Rules PDF. This layout presents information on Monthly Statics, Management Data, Performance Records. It is also available for immediate download and adjustment. So, changes can be made in the color, design, graphics or any other component to create a unique layout.

Smartphone Application User Acquisition Techniques Company Application Current Performance Challenges Guidelines PDF
Following slide shows graph representing ,major challenges faced by company mobile application. It includes pointers such as number od users, click through rates, profit generation, retention rate etc. Slidegeeks is one of the best resources for PowerPoint templates. You can download easily and regulate Smartphone Application User Acquisition Techniques Company Application Current Performance Challenges Guidelines PDF for your personal presentations from our wonderful collection. A few clicks is all it takes to discover and get the most relevant and appropriate templates. Use our Templates to add a unique zing and appeal to your presentation and meetings. All the slides are easy to edit and you can use them even for advertisement purposes.
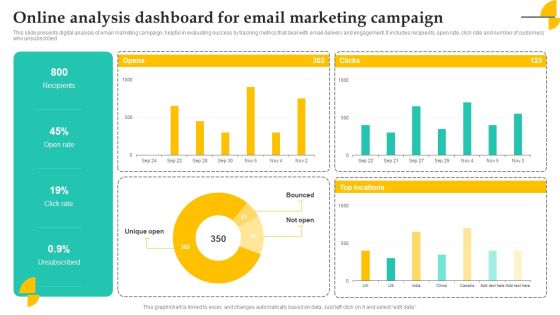
Online Analysis Dashboard For Email Marketing Campaign Elements PDF
This slide presents digital analysis of email marketing campaign, helpful in evaluating success by tracking metrics that deal with email delivery and engagement. It includes recipients, open rate, click rate and number of customers who unsubscribed Showcasing this set of slides titled Online Analysis Dashboard For Email Marketing Campaign Elements PDF. The topics addressed in these templates are Recipients, Open Rate, Campaign. All the content presented in this PPT design is completely editable. Download it and make adjustments in color, background, font etc. as per your unique business setting.

Cybersecurity Operations Cybersecops Secops Effective Implementation Impact Summary PDF
This slide outlines the successful implementation impact of SecOps on organizational security breaches. The purpose of this slide is to highlight the number of reduced security breaches inside a company after implementing SecOps. Security breaches include phishing, network intrusion, and so on. Make sure to capture your audiences attention in your business displays with our gratis customizable Cybersecurity Operations Cybersecops Secops Effective Implementation Impact Summary PDF. These are great for business strategies, office conferences, capital raising or task suggestions. If you desire to acquire more customers for your tech business and ensure they stay satisfied, create your own sales presentation with these plain slides.

HR Security Training And Wellbeing KPI Dashboard Professional PDF
This slide showcases dashboard for HR safety training and wellbeing. This template aims to improve employee working efficiency and enhance working conditions to foster their working efficiency. It provides details regarding incidents reported, training programs implemented to reduce number of incidents, cost of providing training and level of employee satisfaction with training. Showcasing this set of slides titled HR Security Training And Wellbeing KPI Dashboard Professional PDF. The topics addressed in these templates are Severity, Injury Consequence, Employee Satisfaction Training. All the content presented in this PPT design is completely editable. Download it and make adjustments in color, background, font etc. as per your unique business setting.

Dashboard For Risk Reporting Of Plan Effectiveness Download PDF
This slide depicts a dashboard for communication of hazard plan effectiveness to effectively manage the major incidents and take action accordingly. The key performing indicators are days since hazard incident, number of incidents in a year, risk assessments, etc. Showcasing this set of slides titled Dashboard For Risk Reporting Of Plan Effectiveness Download PDF. The topics addressed in these templates are Risk Assessments, Awaiting Submission, Awaiting Submission. All the content presented in this PPT design is completely editable. Download it and make adjustments in color, background, font etc. as per your unique business setting.
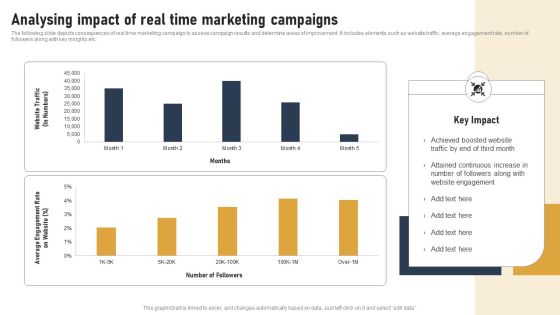
Incorporating Real Time Marketing For Improved Consumer Analysing Impact Of Real Time Marketing Introduction PDF
The following slide depicts consequences of real time marketing campaign to assess campaign results and determine areas of improvement. It includes elements such as website traffic, average engagement rate, number of followers along with key insights etc. If your project calls for a presentation, then Slidegeeks is your go to partner because we have professionally designed, easy to edit templates that are perfect for any presentation. After downloading, you can easily edit Incorporating Real Time Marketing For Improved Consumer Analysing Impact Of Real Time Marketing Introduction PDF and make the changes accordingly. You can rearrange slides or fill them with different images. Check out all the handy templates
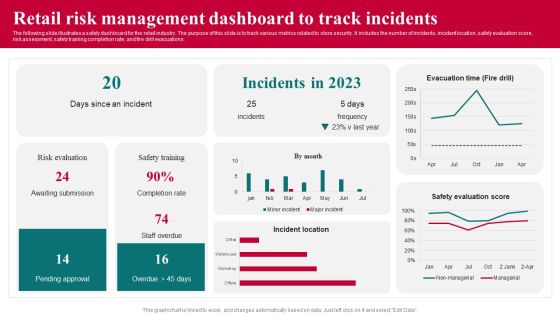
Retail Risk Management Dashboard To Track Incidents Professional PDF
The following slide illustrates a safety dashboard for the retail industry. The purpose of this slide is to track various metrics related to store security. It includes the number of incidents, incident location, safety evaluation score,risk assessment, safety training completion rate, and fire drill evacuations. Showcasing this set of slides titled Retail Risk Management Dashboard To Track Incidents Professional PDF. The topics addressed in these templates are Risk Evaluation, Retail Risk Management Dashboard, Track Incidents. All the content presented in this PPT design is completely editable. Download it and make adjustments in color, background, font etc. as per your unique business setting.
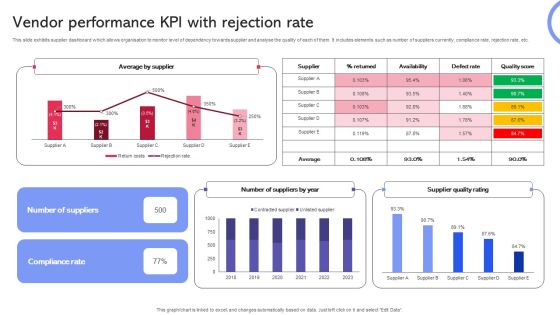
Vendor Performance KPI With Rejection Rate Inspiration PDF
This slide exhibits supplier dashboard which allows organisation to monitor level of dependency towards supplier and analyse the quality of each of them. It includes elements such as number of suppliers currently, compliance rate, rejection rate, etc. Pitch your topic with ease and precision using this Vendor Performance KPI With Rejection Rate Inspiration PDF. This layout presents information on Vendor Performance KPI, Rejection Rate. It is also available for immediate download and adjustment. So, changes can be made in the color, design, graphics or any other component to create a unique layout.

Six Months Lead Generation Marketing Dashboard Inspiration PDF
The slide carries lead generation dashboard to build deeper understanding of business and customer journey. Various KPIs included are lead values per month, number of leads per month and lead marketing channels. Showcasing this set of slides titled Six Months Lead Generation Marketing Dashboard Inspiration PDF. The topics addressed in these templates are Six Months Lead Generation, Marketing Dashboard. All the content presented in this PPT design is completely editable. Download it and make adjustments in color, background, font etc. as per your unique business setting.

360 Degree Sales Analysis Dashboard After Marketing Plan Implementation Pictures PDF
This template shows the sales analysis dashboard after implementing an effective marketing plan. This slide aims to measure the potential and actual results of the sales target. It includes KPIs such as the number of page views on the website, total sales, subscribers, etc.Pitch your topic with ease and precision using this 360 Degree Sales Analysis Dashboard After Marketing Plan Implementation Pictures PDF. This layout presents information on Lead Generation Life, Conversion Rate. It is also available for immediate download and adjustment. So, changes can be made in the color, design, graphics or any other component to create a unique layout.

Loyalty Incentives Program Performance Dashboard Microsoft PDF
This slide illustrates statistics to measure buying activity of potential and existing customers. It includes information on the overall volume of new clients, the typical number of orders per client, all time churned customers, etc.Showcasing this set of slides titled Loyalty Incentives Program Performance Dashboard Microsoft PDF. The topics addressed in these templates are Total Churned Customer, Passive Churned Customer. All the content presented in this PPT design is completely editable. Download it and make adjustments in color, background, font etc. as per your unique business setting.

Property Trust Investment Fundraising Facts And Figures Background PDF
This slide highlights a statistical data showing global facts in private real estate fundraising investments. It includes key components such as yearly statistics, number of funds closed, aggregate capital raised, debt, core, core plus, value added, opportunistic, distressed, etc.Showcasing this set of slides titled Property Trust Investment Fundraising Facts And Figures Background PDF. The topics addressed in these templates are Closed At Maximum, Opportunistic Funds. All the content presented in this PPT design is completely editable. Download it and make adjustments in color, background, font etc. as per your unique business setting.
HR Attrition Rate By Company Size Elements PDF
This slide consists of turnover rate of employees which can be used by recruiters, business owners, industry decision-makers, organizations, and data analysts to obtain a general understanding of the turnover rate in the economy. Key elements covered are number of employees working in the organization, duration of employment and turnover rate. Pitch your topic with ease and precision using this HR Attrition Rate By Company Size Elements PDF. This layout presents information on Key Takeaways, Business Sizes, Employees. It is also available for immediate download and adjustment. So, changes can be made in the color, design, graphics or any other component to create a unique layout.
Forecasted Land Asset Management Software Market Share Introduction PDF
Following slide demonstrates forecasted market share of asset management software by different regions to determine business future potential. It includes key components such as users growth by different countries and number of users. Showcasing this set of slides titled Forecasted Land Asset Management Software Market Share Introduction PDF. The topics addressed in these templates are Services Requirement, Asset Management, Maximum Growth. All the content presented in this PPT design is completely editable. Download it and make adjustments in color, background, font etc. as per your unique business setting.
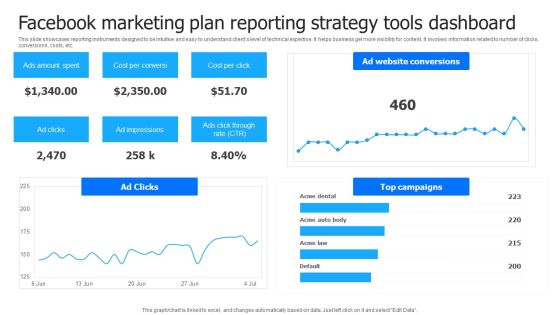
Facebook Marketing Plan Reporting Strategy Tools Dashboard Information PDF
This slide showcases reporting instruments designed to be intuitive and easy to understand clients level of technical expertise. It helps business get more visibility for content. It involves information related to number of clicks, conversions, costs, etc. Showcasing this set of slides titled Facebook Marketing Plan Reporting Strategy Tools Dashboard Information PDF Elements. The topics addressed in these templates are Ads Amount Spent, Cost Per Conversion, Cost Per Click. All the content presented in this PPT design is completely editable. Download it and make adjustments in color, background, font etc. as per your unique business setting.
Dashboard For Managing Support Ticket Resolution In Customer Services Ideas PDF
The following slide represents dashboard to track tickets in progress, including ones that are pending or overdue in customer support services. It also covers meantime to resolve and support status, number of tickets resolved, monthly analysis of ticket resolved and unresolved etc. Showcasing this set of slides titled Dashboard For Managing Support Ticket Resolution In Customer Services Ideas PDF. The topics addressed in these templates are Resolved Tickets, Ticket Resolved Unresolved, Support Status. All the content presented in this PPT design is completely editable. Download it and make adjustments in color, background, font etc. as per your unique business setting.
Dashboard To Track Automated Manufacturing Workflow Progress Professional PDF
Following slide demonstrates KPI dashboard for monitoring automated manufacturing processes performance which can be used by businesses to increase organization efficiency. It includes key components such as total business revenue, Number of customers, total units produced, production rate, monthly production by manufacturing lines, etc. Showcasing this set of slides titled Dashboard To Track Automated Manufacturing Workflow Progress Professional PDF. The topics addressed in these templates are Machine Utilization, Product Delivery, Defective Units Produced. All the content presented in this PPT design is completely editable. Download it and make adjustments in color, background, font etc. as per your unique business setting.
KPI Dashboard To Track Services Company Strategy Business Marketing Performance Guidelines PDF
Following slide demonstrates dashboard for monitoring services company sales strategy impact on maximizing business profits. It includes elements such as number of sales, revenue, profit, cost, monthly sales revenue, cost breakdown, up and cross sell, revenue collected and sales by communication channel. Showcasing this set of slides titled KPI Dashboard To Track Services Company Strategy Business Marketing Performance Guidelines PDF. The topics addressed in these templates are Revenue, Profit, Cost. All the content presented in this PPT design is completely editable. Download it and make adjustments in color, background, font etc. as per your unique business setting.
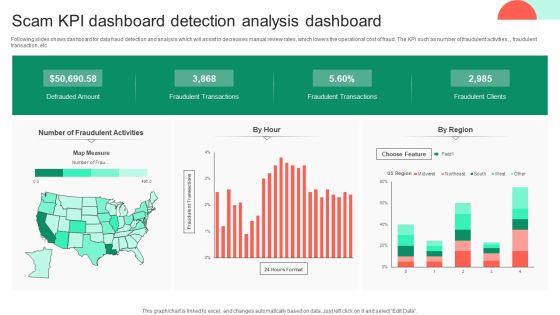
Scam KPI Dashboard Detection Analysis Dashboard Background PDF
Following slides shows dashboard for data fraud detection and analysis which will assist in decreases manual review rates, which lowers the operational cost of fraud. The KPI such as number of fraudulent activities, , fraudulent transaction, etc. Showcasing this set of slides titled Scam KPI Dashboard Detection Analysis Dashboard Background PDF. The topics addressed in these templates are Scam Kpi Dashboard, Detection Analysis Dashboard. All the content presented in this PPT design is completely editable. Download it and make adjustments in color, background, font etc. as per your unique business setting.
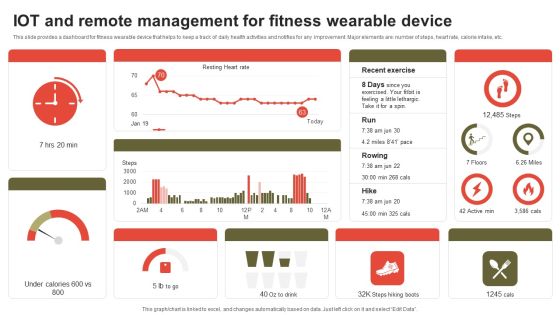
IOT And Remote Management For Fitness Wearable Device Download PDF
This slide provides a dashboard for fitness wearable device that helps to keep a track of daily health activities and notifies for any improvement. Major elements are number of steps, heart rate, calorie intake, etc. Showcasing this set of slides titled IOT And Remote Management For Fitness Wearable Device Download PDF. The topics addressed in these templates are Recent Exercise, Run, Rowing. All the content presented in this PPT design is completely editable. Download it and make adjustments in color, background, font etc. as per your unique business setting.

KPI Analytics Dashboard With Sourcing Raw Material Cycle Time Inspiration PDF
Following slide shows the key performance indicator KPI dashboard which will assist corporates to effectively monitor procurement process. The metrics are number of suppliers, contract compliance, average procurement cycle time, etc. Showcasing this set of slides titled KPI Analytics Dashboard With Sourcing Raw Material Cycle Time Inspiration PDF. The topics addressed in these templates are Kpi Analytics Dashboard, Sourcing Raw Material, Cycle Time. All the content presented in this PPT design is completely editable. Download it and make adjustments in color, background, font etc. as per your unique business setting.
Investment Fund Performance Tracking Dashboard Microsoft PDF
This slide showcases a dashboard to track and supervise funds performance for portfolio balancing . it includes key components such as amount invested in funds, number of invested funds, rate of return, annual investments and rating wise investments. Pitch your topic with ease and precision using this Investment Fund Performance Tracking Dashboard Microsoft PDF. This layout presents information on Amount Invented Funds, Rate Return, Rating Wise Investments. It is also available for immediate download and adjustment. So, changes can be made in the color, design, graphics or any other component to create a unique layout.

Dashboard To Track Extensive Diversity Training Status For Employees Developement Elements PDF
This slide showcases the dashboard to track current diversity training status in the organization. Key metrics included here are training cost actual and budgeted, cost per partcipant, number of participants every month, hours of training provided etc. Showcasing this set of slides titled Dashboard To Track Extensive Diversity Training Status For Employees Developement Elements PDF. The topics addressed in these templates are Training Cost, Budget, Occupancy Rate. All the content presented in this PPT design is completely editable. Download it and make adjustments in color, background, font etc. as per your unique business setting.
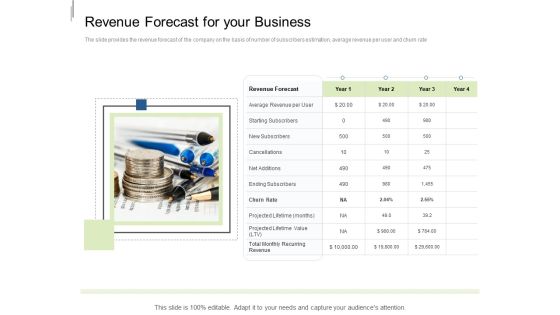
Equity Crowdfunding Pitch Deck Revenue Forecast For Your Business Diagrams PDF
The slide provides the revenue forecast of the company on the basis of number of subscribers estimation, average revenue per user and churn rate. This is a equity crowdfunding pitch deck revenue forecast for your business diagrams pdf template with various stages. Focus and dispense information on four stages using this creative set, that comes with editable features. It contains large content boxes to add your information on topics like average revenue, starting subscribers, new subscribers, cancellations. You can also showcase facts, figures, and other relevant content using this PPT layout. Grab it now.
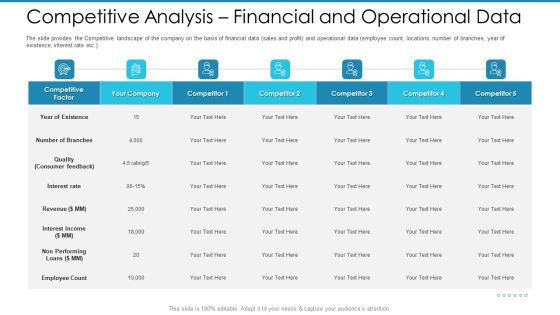
Post Initial Pubic Offering Market Pitch Deck Competitive Analysis Financial And Operational Data Diagrams PDF
The slide provides the Competitive landscape of the company on the basis of financial data sales and profit and operational data employee count, locations, number of branches, year of existence, interest rate etc.Deliver an awe-inspiring pitch with this creative post initial pubic offering market pitch deck competitive analysis financial and operational data diagrams pdf. bundle. Topics like interest rate, revenue interest income, non performing can be discussed with this completely editable template. It is available for immediate download depending on the needs and requirements of the user.
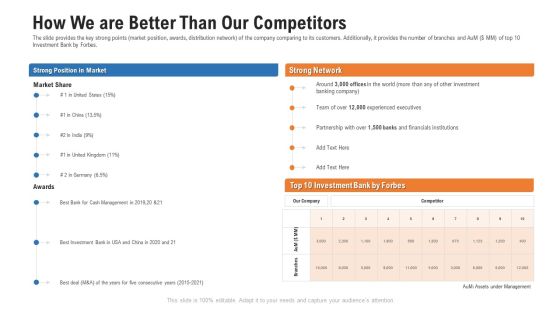
Pitch Deck For Procurement Deal How We Are Better Than Our Competitors Ppt Professional Diagrams PDF
The slide provides the key strong points market position, awards, distribution network of the company comparing to its customers. Additionally, it provides the number of branches and AuM dollar MM of top 10 Investment Bank by Forbes. Deliver and pitch your topic in the best possible manner with this pitch deck for procurement deal how we are better than our competitors ppt professional diagrams pdf. Use them to share invaluable insights on strong position in market, financials institutions, cash management and impress your audience. This template can be altered and modified as per your expectations. So, grab it now.

Professional Scrum Master Vs Certified Scrum Master IT Certification Differences Diagrams PDF
This template covers Certified Scrum Master and Professional Scrum Master differences based on common factors such as passing marks, number of attempts etc. This is a professional scrum master vs certified scrum master it certification differences diagrams pdf template with various stages. Focus and dispense information on three stages using this creative set, that comes with editable features. It contains large content boxes to add your information on topics like quality, materials, cost. You can also showcase facts, figures, and other relevant content using this PPT layout. Grab it now.
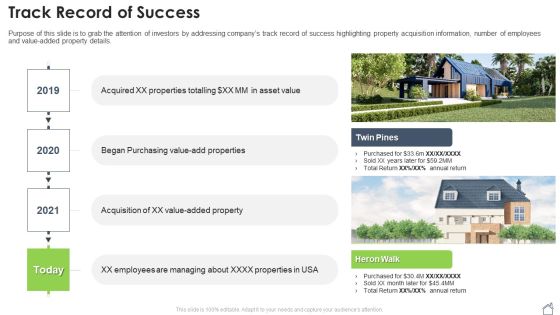
Real Estate Property Pitch Deck Track Record Of Success Ppt Diagrams PDF
Purpose of this slide is to grab the attention of investors by addressing companys track record of success highlighting property acquisition information, number of employees and value-added property details. Presenting real estate property pitch deck track record of success ppt diagrams pdf to provide visual cues and insights. Share and navigate important information on four stages that need your due attention. This template can be used to pitch topics like track record of success. In addtion, this PPT design contains high resolution images, graphics, etc, that are easily editable and available for immediate download.
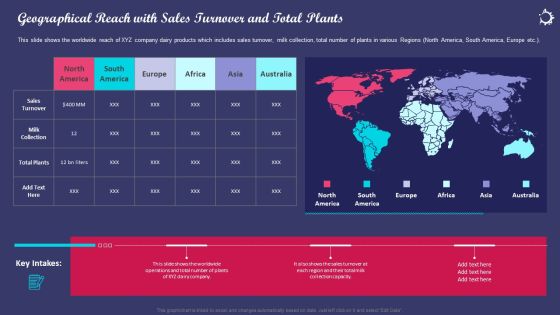
Enhancing Consumers Perception Towards Geographical Reach With Sales Turnover And Total Plants Diagrams PDF
This slide shows the worldwide reach of XYZ company dairy products which includes sales turnover, milk collection, total number of plants in various Regions North America, South America, Europe etc. Presenting enhancing consumers perception towards geographical reach with sales turnover and total plants diagrams pdf to provide visual cues and insights. Share and navigate important information on one stages that need your due attention. This template can be used to pitch topics like geographical reach with sales turnover and total plants. In addtion, this PPT design contains high resolution images, graphics, etc, that are easily editable and available for immediate download.
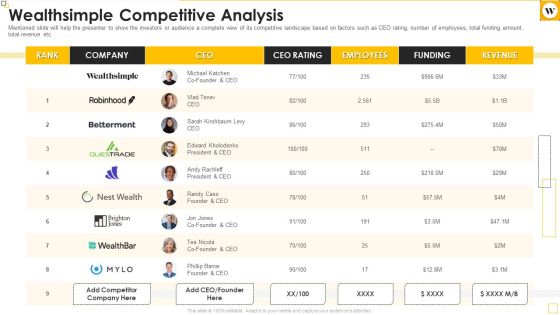
Wealthsimple Capital Raising Elevator Pitch Deck Wealthsimple Competitive Analysis Diagrams Pdf
Mentioned slide will help the presenter to show the investors or audience a complete view of its competitive landscape based on factors such as CEO rating, number of employees, total funding amount, total revenue etc. Deliver and pitch your topic in the best possible manner with this wealthsimple capital raising elevator pitch deck wealthsimple competitive analysis diagrams pdf. Use them to share invaluable insights on competitive landscape, funding amount, revenue and impress your audience. This template can be altered and modified as per your expectations. So, grab it now.

Business To Business Sales Management Playbook Metrices To Track Sales Team Performance Diagrams PDF
This slide provides information regarding various metrics catered to track sales team performance in terms of average revenue per account, win rate, NPS, along with sales representative performance tracking through number of opportunities created, lead response time, etc.Deliver an awe inspiring pitch with this creative Business To Business Sales Management Playbook Metrices To Track Sales Team Performance Diagrams PDF bundle. Topics like Sales Representatives, Client Conversations, Lead Response can be discussed with this completely editable template. It is available for immediate download depending on the needs and requirements of the user.

Cloud Based Service Models Market Rate Of Cloud Computing Diagrams PDF
This slide depicts the overview of the cloud service provider company, including its functionality, number of customers and partners, security, and operational expertise.This is a Cloud Based Service Models Market Rate Of Cloud Computing Diagrams PDF template with various stages. Focus and dispense information on one stage using this creative set, that comes with editable features. It contains large content boxes to add your information on topics like Most Functionality, Largest Community, Operational Expertise. You can also showcase facts, figures, and other relevant content using this PPT layout. Grab it now.

Project Time Management To Enhance Productivity Parameters To Measure Timeliness Of Project Activities Diagrams PDF
This slide shows the parameters to measure timeliness of project activities which includes cycle time, time spent, on-time completion percentage, number of adjustments, planned hours vs. actual time spent, etc.Deliver an awe inspiring pitch with this creative Project Time Management To Enhance Productivity Parameters To Measure Timeliness Of Project Activities Diagrams PDF bundle. Topics like Development Process, Completion Percentage, Completion Allocated can be discussed with this completely editable template. It is available for immediate download depending on the needs and requirements of the user.

About The Organization Guide To Enhance Organic Growth By Advancing Business Procedures Diagrams PDF
Purpose of the following slide is to displays the key details of the organization as it highlights the year in which the organization was founded in, along with its services, its geographical presence and total number of employees. This is a About The Organization Guide To Enhance Organic Growth By Advancing Business Procedures Diagrams PDF template with various stages. Focus and dispense information on one stage using this creative set, that comes with editable features. It contains large content boxes to add your information on topics like Geographical Presence, Various Regions, Budget Management. You can also showcase facts, figures, and other relevant content using this PPT layout. Grab it now.

Pricing Plan Of The Selected Social Media Automation Tool Achieving Operational Efficiency Diagrams PDF
The following slide outlines the different pricing plan of the automation tool which is selected to optimize the social media performance. The pricing plan consists of various features such as number of social media accounts, users, clients, etc.This is a Pricing Plan Of The Selected Social Media Automation Tool Achieving Operational Efficiency Diagrams PDF template with various stages. Focus and dispense information on three stages using this creative set, that comes with editable features. It contains large content boxes to add your information on topics like Media Accounts, Unlimited Clients, Most Popular. You can also showcase facts, figures, and other relevant content using this PPT layout. Grab it now.

Impact Of Social Media Management Platform Tools Ppt Styles Diagrams PDF
The following slide highlights the impact of social media tools in marketing efforts. It includes elements such as social engagement, reports, its presence, number of pages etc. Persuade your audience using this Impact Of Social Media Management Platform Tools Ppt Styles Diagrams PDF. This PPT design covers three stages, thus making it a great tool to use. It also caters to a variety of topics including Social Engagement, Social Media Pages, Reports. Download this PPT design now to present a convincing pitch that not only emphasizes the topic but also showcases your presentation skills.

Organizing Security Awareness Pricing Plan Of Security Awareness Packages Diagrams PDF
The purpose of this slide is to showcase the pricing plan of cyber security awareness package. It covers information about the total number of employees along with different packages such as silver, gold, platinum and diamond. Take your projects to the next level with our ultimate collection of Organizing Security Awareness Pricing Plan Of Security Awareness Packages Diagrams PDF. Slidegeeks has designed a range of layouts that are perfect for representing task or activity duration, keeping track of all your deadlines at a glance. Tailor these designs to your exact needs and give them a truly corporate look with your own brand colors theyll make your projects stand out from the rest.

Data Center Infrastructure Technologies Comparison Between CPU And GPU Diagrams PDF
This slide depicts a comparison between CPU and GPU processing based on the number of cores, latency, processing, and hardware. If your project calls for a presentation, then Slidegeeks is your go-to partner because we have professionally designed, easy-to-edit templates that are perfect for any presentation. After downloading, you can easily edit Data Center Infrastructure Technologies Comparison Between CPU And GPU Diagrams PDF and make the changes accordingly. You can rearrange slides or fill them with different images. Check out all the handy templates.

Search Engine Marketing Potential Benefits Of Sem Campaign Investment Diagrams PDF
The following slide covers some practices to improve website landing page experience and increase number of conversions from visitors. It includes activities such as displaying offer clearly, using contrasting colors, reducing page loading time, call to action button etc. If your project calls for a presentation, then Slidegeeks is your go-to partner because we have professionally designed, easy-to-edit templates that are perfect for any presentation. After downloading, you can easily edit Search Engine Marketing Potential Benefits Of Sem Campaign Investment Diagrams PDF and make the changes accordingly. You can rearrange slides or fill them with different images. Check out all the handy templates.

Media Advertising Types Of Ads Format Published On Youtube Channel Diagrams PDF
This slide is used to evaluate the followers, clicks and number of posts liked and shared by the user in a month on social media channel. Want to ace your presentation in front of a live audience Our Media Advertising Types Of Ads Format Published On Youtube Channel Diagrams PDF can help you do that by engaging all the users towards you. Slidegeeks experts have put their efforts and expertise into creating these impeccable powerpoint presentations so that you can communicate your ideas clearly. Moreover, all the templates are customizable, and easy-to-edit and downloadable. Use these for both personal and commercial use.

Chat Messenger Investor Funding Elevator Pitch Deck Why Invest With Us Diagrams PDF
The slide mentions the reasons for investing with the company such as huge market opportunities, large number of app downloads, organic growth, etc. If your project calls for a presentation, then Slidegeeks is your go to partner because we have professionally designed, easy to edit templates that are perfect for any presentation. After downloading, you can easily edit Chat Messenger Investor Funding Elevator Pitch Deck Why Invest With Us Diagrams PDF and make the changes accordingly. You can rearrange slides or fill them with different images. Check out all the handy templates.

 Home
Home