Number Icons
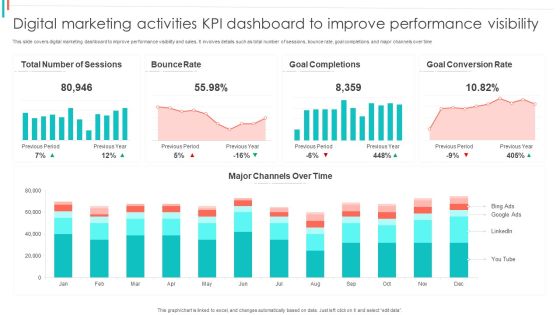
Digital Marketing Activities KPI Dashboard To Improve Performance Visibility Summary PDF
This slide covers digital marketing dashboard to improve performance visibility and sales. It involves details such as total number of sessions, bounce rate, goal completions and major channels over time.Showcasing this set of slides titled Digital Marketing Activities KPI Dashboard To Improve Performance Visibility Summary PDF. The topics addressed in these templates are Bounce Rate, Goal Completions, Goal Conversion. All the content presented in this PPT design is completely editable. Download it and make adjustments in color, background, font etc. as per your unique business setting.

Ecommerce Marketing Activities KPI Dashboard To Analyse Performance Guidelines PDF
This slide covers ecommerce marketing KPI dashboard to track performance. It involves details such as ecommerce revenue generated, number of new customers, repeat buying rate, attribute revenue and conversion rate and attributed revenue and conversion rate by marketing channel.Pitch your topic with ease and precision using this Ecommerce Marketing Activities KPI Dashboard To Analyse Performance Guidelines PDF. This layout presents information on Revenue Generated, Ecommerce Revenue, Generate Conversion. It is also available for immediate download and adjustment. So, changes can be made in the color, design, graphics or any other component to create a unique layout.

Online Marketing Activities KPI Dashboard To Improve Sales Ideas PDF
This slide covers online marketing dashboard to improve sales. It involves details such as web performance, conversion funnel, revenue this month, traffic sources and number of followers on social media.Pitch your topic with ease and precision using this Online Marketing Activities KPI Dashboard To Improve Sales Ideas PDF. This layout presents information on Email Performance, Web Performance, Cost Conversion. It is also available for immediate download and adjustment. So, changes can be made in the color, design, graphics or any other component to create a unique layout.

Four Year Company Sales Unsatisfactory Performance Demonstration PDF
This slide covers the data on the performance of sales department of the company to have a clear idea about the revenues. It shows decrease in the number of sales in the last 4 years 2020 to 2023 which leads in degrading companys reputation and loss of stakeholders.Showcasing this set of slides titled Four Year Company Sales Unsatisfactory Performance Demonstration PDF. The topics addressed in these templates are Declining Sales, Restrictions, Insights. All the content presented in this PPT design is completely editable. Download it and make adjustments in color, background, font etc. as per your unique business setting.

ISO 27001 Organizational Qualifying Procedure Dashboard For Information Security Risk Management Background PDF
This slide displays dashboard for information security risk management. It includes KPIs such as risk analysis progress, persent risk, response progress for risks and number of risks encountered.Deliver and pitch your topic in the best possible manner with this ISO 27001 Organizational Qualifying Procedure Dashboard For Information Security Risk Management Background PDF. Use them to share invaluable insights on Analysis Progress, Response Progress, Plan Breakdown and impress your audience. This template can be altered and modified as per your expectations. So, grab it now.
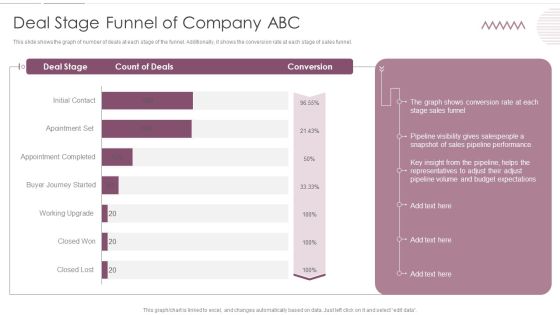
Sales Management Pipeline For Effective Lead Generation Deal Stage Funnel Of Company ABC Inspiration PDF
This slide shows the graph of number of deals at each stage of the funnel. Additionally, it shows the conversion rate at each stage of sales funnel. Deliver and pitch your topic in the best possible manner with this Sales Management Pipeline For Effective Lead Generation Deal Stage Funnel Of Company ABC Inspiration PDF. Use them to share invaluable insights on Pipeline Performance, Sales Funnel, Budget Expectations and impress your audience. This template can be altered and modified as per your expectations. So, grab it now.

Strategy Playbook For Ecommerce Business Statistics Associated With Global Ecommerce Growth Infographics PDF
This slide provides information regarding statistics associated to ecommerce growth in terms of expected ecommerce sales, ecommerce share of retails sales, number of global internet users preferring products online on monthly basis, etc. Deliver and pitch your topic in the best possible manner with this Strategy Playbook For Ecommerce Business Statistics Associated With Global Ecommerce Growth Infographics PDF. Use them to share invaluable insights on Global Ecommerce, People Preferring, Ecommerce Share and impress your audience. This template can be altered and modified as per your expectations. So, grab it now.
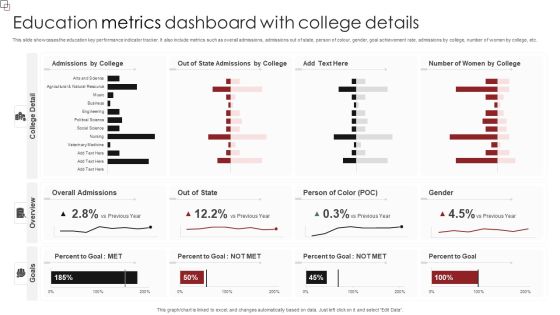
Education Metrics Dashboard With College Details Formats PDF
This slide showcases the education key performance indicator tracker. It also include metrics such as overall admissions, admissions out of state, person of colour, gender, goal achievement rate, admissions by college, number of women by college, etc. Pitch your topic with ease and precision using this Education Metrics Dashboard With College Details Formats PDF. This layout presents information on Overall Admissions, Person Of Color, Percent To Goal. It is also available for immediate download and adjustment. So, changes can be made in the color, design, graphics or any other component to create a unique layout.

Annual Human Resource Report With Employee Hiring And Promotion Graph Mockup PDF
This slide showcases HR report and graph that can help organization to identify number of of employees demoted and promoted in the company. It showcases comparison for a period of last three years. Pitch your topic with ease and precision using this Annual Human Resource Report With Employee Hiring And Promotion Graph Mockup PDF. This layout presents information on Technology, Product, Employees. It is also available for immediate download and adjustment. So, changes can be made in the color, design, graphics or any other component to create a unique layout.
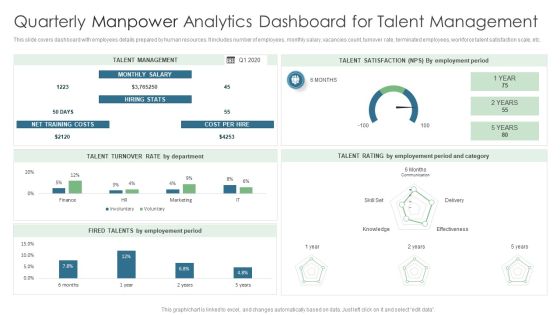
Quarterly Manpower Analytics Dashboard For Talent Management Infographics PDF
This slide covers dashboard with employees details prepared by human resources. It includes number of employees, monthly salary, vacancies count, turnover rate, terminated employees, workforce talent satisfaction scale, etc. Showcasing this set of slides titled Quarterly Manpower Analytics Dashboard For Talent Management Infographics PDF. The topics addressed in these templates are Talent Management, Cost Per Hire, Net Training Costs. All the content presented in this PPT design is completely editable. Download it and make adjustments in color, background, font etc. as per your unique business setting.
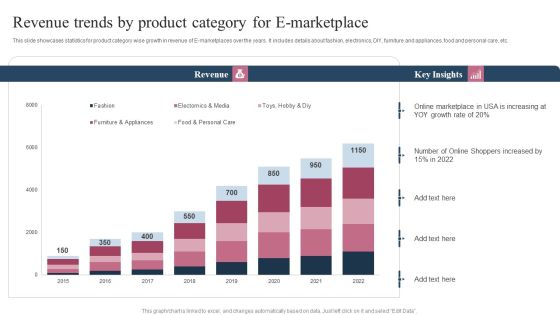
Revenue Trends By Product Category For E Marketplace Ppt Pictures Slide Portrait PDF
This slide showcases statistics for product category wise growth in revenue of E-marketplaces over the years. It includes details about fashion, electronics, DIY, furniture and appliances, food and personal care, etc. Pitch your topic with ease and precision using this Revenue Trends By Product Category For E Marketplace Ppt Pictures Slide Portrait PDF. This layout presents information on Revenue, Online Marketplace, Number Online, Shoppers Increased, 2015 To 2022. It is also available for immediate download and adjustment. So, changes can be made in the color, design, graphics or any other component to create a unique layout.
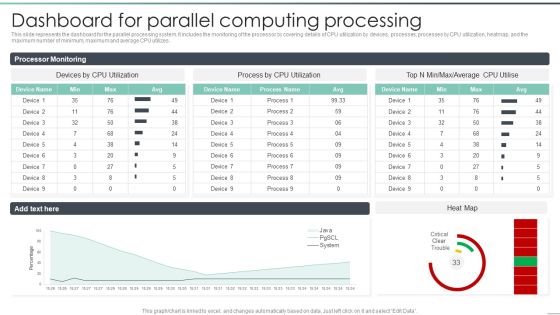
Parallel Computing Processing Dashboard For Parallel Computing Processing Template PDF
This slide represents the dashboard for the parallel processing system. It includes the monitoring of the processor by covering details of CPU utilization by devices, processes, processes by CPU utilization, heatmap, and the maximum number of minimum, maximum and average CPU utilizes. Deliver an awe inspiring pitch with this creative Parallel Computing Processing Dashboard For Parallel Computing Processing Template PDF bundle. Topics like Average, Processor Monitoring, Device can be discussed with this completely editable template. It is available for immediate download depending on the needs and requirements of the user.
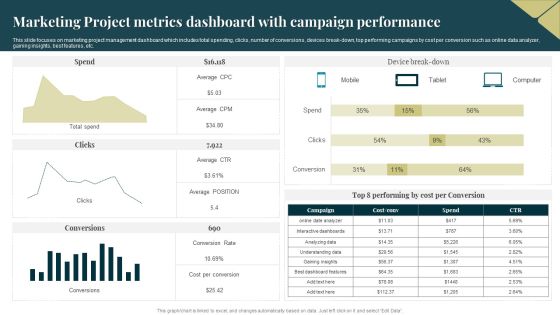
Marketing Project Metrics Dashboard With Campaign Performance Topics PDF
This slide focuses on marketing project management dashboard which includes total spending, clicks, number of conversions, devices break down, top performing campaigns by cost per conversion such as online data analyzer, gaining insights, best features, etc. Showcasing this set of slides titled Marketing Project Metrics Dashboard With Campaign Performance Topics PDF. The topics addressed in these templates are Average, Cost, Analyzing Data. All the content presented in this PPT design is completely editable. Download it and make adjustments in color, background, font etc. as per your unique business setting.

Project Metrics Dashboard With Active Issues Topics PDF
This slide focuses on the project management dashboard which shows the number of active emergency risks and issues, projects, current user count, splitting of project status by priority level, capacity percentage, top recent assignees with open, resolved and closed projects. Pitch your topic with ease and precision using this Project Metrics Dashboard With Active Issues Topics PDF. This layout presents information on Project Metrics, Dashboard With Active Issues. It is also available for immediate download and adjustment. So, changes can be made in the color, design, graphics or any other component to create a unique layout.
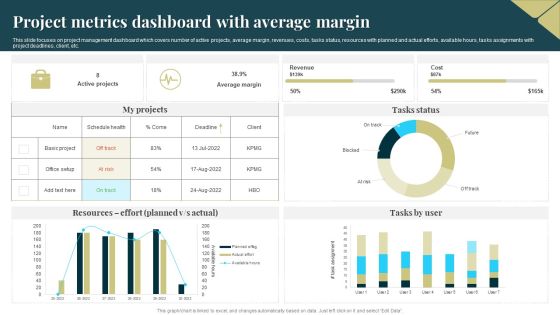
Project Metrics Dashboard With Average Margin Sample PDF
This slide focuses on project management dashboard which covers number of active projects, average margin, revenues, costs, tasks status, resources with planned and actual efforts, available hours, tasks assignments with project deadlines, client, etc. Pitch your topic with ease and precision using this Project Metrics Dashboard With Average Margin Sample PDF. This layout presents information on Average Margin, Revenue, Cost. It is also available for immediate download and adjustment. So, changes can be made in the color, design, graphics or any other component to create a unique layout.

Project Metrics Dashboard With Monthly Workload Topics PDF
This slide shows the project management dashboard which covers the number of tasks completed in last one week, return on investment on overall project, milestones covered, performance of employees, tasks created, competed, work in progress, started, etc. Pitch your topic with ease and precision using this Project Metrics Dashboard With Monthly Workload Topics PDF. This layout presents information on Investment, Employee Performance, Project Metrics Dashboard. It is also available for immediate download and adjustment. So, changes can be made in the color, design, graphics or any other component to create a unique layout.
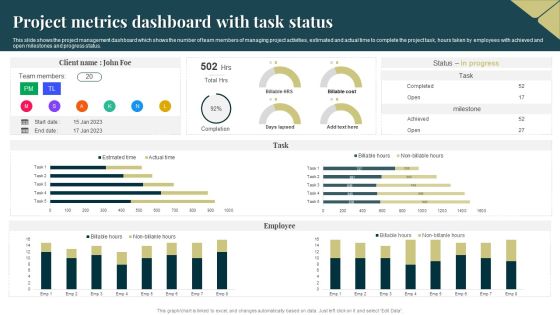
Project Metrics Dashboard With Task Status Rules PDF
This slide shows the project management dashboard which shows the number of team members of managing project activities, estimated and actual time to complete the project task, hours taken by employees with achieved and open milestones and progress status. Pitch your topic with ease and precision using this Project Metrics Dashboard With Task Status Rules PDF. This layout presents information on Team Members, Employee. It is also available for immediate download and adjustment. So, changes can be made in the color, design, graphics or any other component to create a unique layout.

Project Portfolio Metrics Dashboard With Activity Plan Clipart PDF
This slide focuses on project portfolio management dashboard which includes completed projects, budget spent, number of team members, associated risks and issues, activity plan with duration, status percentage, budget allocation, critical issues, tasks, comments, etc. Pitch your topic with ease and precision using this Project Portfolio Metrics Dashboard With Activity Plan Clipart PDF. This layout presents information on Budgets, Team, Risks. It is also available for immediate download and adjustment. So, changes can be made in the color, design, graphics or any other component to create a unique layout.
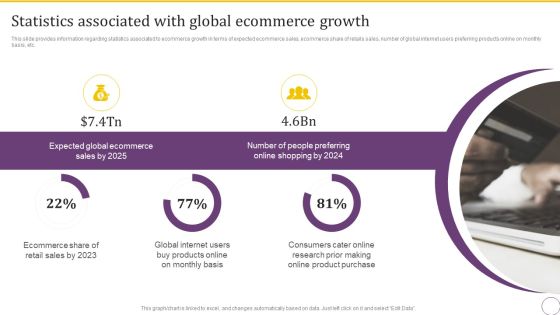
Online Business Client Experience Improvement Strategy Playbook Statistics Associated With Global Ecommerce Growth Designs PDF
This slide provides information regarding statistics associated to ecommerce growth in terms of expected ecommerce sales, ecommerce share of retails sales, number of global internet users preferring products online on monthly basis, etc. Deliver and pitch your topic in the best possible manner with this Online Business Client Experience Improvement Strategy Playbook Statistics Associated With Global Ecommerce Growth Designs PDF. Use them to share invaluable insights on Expected Global Ecommerce, Product Purchase, Ecommerce and impress your audience. This template can be altered and modified as per your expectations. So, grab it now.
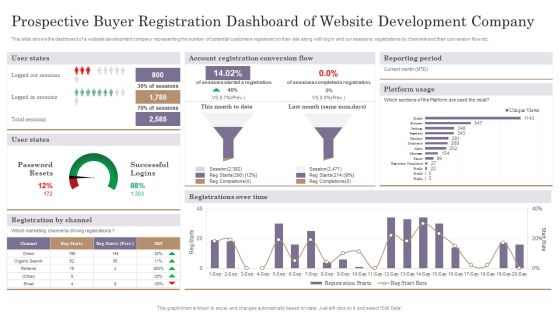
Prospective Buyer Registration Dashboard Of Website Development Company Sample PDF
This slide shows the dashboard of a website development company representing the number of potential customers registered on their site along with log in and our sessions, registrations by channels and their conversion flow etc. Showcasing this set of slides titled Prospective Buyer Registration Dashboard Of Website Development Company Sample PDF. The topics addressed in these templates are Account Registration, Reporting Period, Registrations Over. All the content presented in this PPT design is completely editable. Download it and make adjustments in color, background, font etc. as per your unique business setting.

Customer Satisfaction Survey Outcome Report Template PDF
This slide showcases outcome report for customer satisfaction survey that can help organization to identify the number of satisfied consumers and detect areas of improvement for future. Its key elements are Satisfaction survey and percentage of satisfied consumers. Showcasing this set of slides titled Customer Satisfaction Survey Outcome Report Template PDF. The topics addressed in these templates are Customers, Satisfaction Survey, Service Speed. All the content presented in this PPT design is completely editable. Download it and make adjustments in color, background, font etc. as per your unique business setting.

Customer Service Metrics Dashboard With Active Customers Ideas PDF
This slide showcases dashboard for customer service metrics that can help organization to prioritize the issue requests of consumers and ensure good response times. Its key components are active customer, active tickets, highly urgent rickets and average number of tickets. Showcasing this set of slides titled Customer Service Metrics Dashboard With Active Customers Ideas PDF. The topics addressed in these templates are Customer Service, Metrics Dashboard, Active Customers. All the content presented in this PPT design is completely editable. Download it and make adjustments in color, background, font etc. as per your unique business setting.
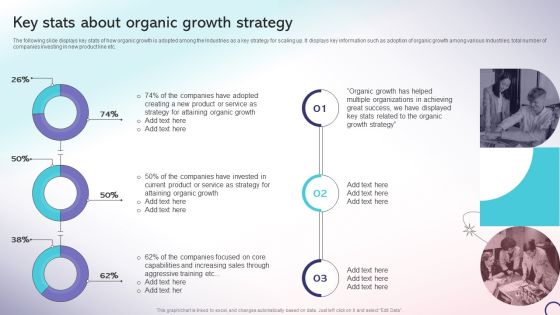
Key Stats About Organic Growth Strategy Strategic Playbook For Internal Sales Advancement Infographics PDF
The following slide displays key stats of how organic growth is adopted among the Industries as a key strategy for scaling up. It displays key information such as adoption of organic growth among various Industries, total number of companies investing in new product line etc. Deliver and pitch your topic in the best possible manner with this Key Stats About Organic Growth Strategy Strategic Playbook For Internal Sales Advancement Infographics PDF. Use them to share invaluable insights on Attaining Organic, Companies Invested, Service Strategy and impress your audience. This template can be altered and modified as per your expectations. So, grab it now.

Project Management Revenue And Customer Progress Report Clipart PDF
This slide exhibits revenue and customer progress status report in the project. It includes revenue, the number of new customers, average revenue per customer, and customer acquisition cost. Pitch your topic with ease and precision using this Project Management Revenue And Customer Progress Report Clipart PDF. This layout presents information on Customer Acquisition Cost, Average Revenue, Per Customer. It is also available for immediate download and adjustment. So, changes can be made in the color, design, graphics or any other component to create a unique layout.
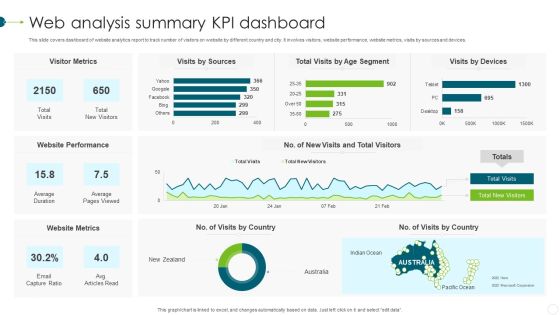
Web Analysis Summary KPI Dashboard Template PDF
This slide covers dashboard of website analytics report to track number of visitors on website by different country and city. It involves visitors, website performance, website metrics, visits by sources and devices. Showcasing this set of slides titled Web Analysis Summary KPI Dashboard Template PDF. The topics addressed in these templates are Website Metrics, Website Performance, Visitor Metrics. All the content presented in this PPT design is completely editable. Download it and make adjustments in color, background, font etc. as per your unique business setting.

Web Analysis Summary KPI Dashboard With Visit Trends Professional PDF
This slide covers website analytics report KPI dashboard to track website performance. It involves details such as total number of visits, visit trends by medium, pagers per visit and new vs returning visitors. Pitch your topic with ease and precision using this Web Analysis Summary KPI Dashboard With Visit Trends Professional PDF. This layout presents information on Web Analysis Summary, KPI Dashboard, Visit Trends. It is also available for immediate download and adjustment. So, changes can be made in the color, design, graphics or any other component to create a unique layout.

Web Usage Analysis Summary Dashboard To Track Performance Background PDF
This slide covers website usage analytics report for tracking performs. It involves all details about number of visitors, leads, consumer, major landing pages and average revenue per consumer. Showcasing this set of slides titled Web Usage Analysis Summary Dashboard To Track Performance Background PDF. The topics addressed in these templates are Customer Churn Rate, Bounce Rate, Monthly Recurring Revenue. All the content presented in this PPT design is completely editable. Download it and make adjustments in color, background, font etc. as per your unique business setting.
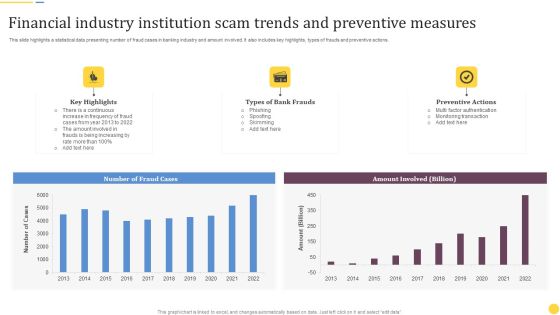
Financial Industry Institution Scam Trends And Preventive Measures Ideas PDF
This slide highlights a statistical data presenting number of fraud cases in banking industry and amount involved. It also includes key highlights, types of frauds and preventive actions. Pitch your topic with ease and precision using this Financial Industry Institution Scam Trends And Preventive Measures Ideas PDF. This layout presents information on Key Highlights, Types Bank Frauds, Preventive Actions. It is also available for immediate download and adjustment. So, changes can be made in the color, design, graphics or any other component to create a unique layout.

Tactical Process For Social Kpis To Measure Social Media Recruitment Success Demonstration PDF
This slide focuses on key performance indicators to measure social media recruitment success which includes time to hire, recruitment costs, age of applicants, recruitment funnel, ratio of male and female. Deliver an awe inspiring pitch with this creative Tactical Process For Social Kpis To Measure Social Media Recruitment Success Demonstration PDF bundle. Topics like Male Female Ratio, Recruitment Funnel, Number Applicants can be discussed with this completely editable template. It is available for immediate download depending on the needs and requirements of the user.
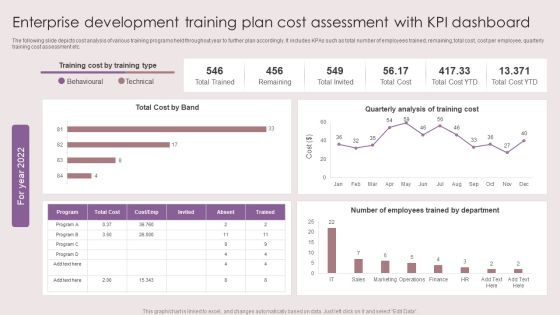
Enterprise Development Training Plan Cost Assessment With KPI Dashboard Mockup PDF
The following slide depicts cost analysis of various training programs held throughout year to further plan accordingly. It includes KPAs such as total number of employees trained, remaining, total cost, cost per employee, quarterly training cost assessment etc. Showcasing this set of slides titled Enterprise Development Training Plan Cost Assessment With KPI Dashboard Mockup PDF. The topics addressed in these templates are Total Cost Band, Quarterly Analysis, Training Cost. All the content presented in this PPT design is completely editable. Download it and make adjustments in color, background, font etc. as per your unique business setting.

Consumer Acquisition And Retention Monthly Graph Background PDF
This slide displays monthly retention rate and number of acquired customers within a business for building a strong customer base and strategy formulation. It also includes graphs showing the customer acquisition and retention with key insights. Pitch your topic with ease and precision using this Consumer Acquisition And Retention Monthly Graph Background PDF. This layout presents information on Consumer Acquisition, Retention Monthly Graph. It is also available for immediate download and adjustment. So, changes can be made in the color, design, graphics or any other component to create a unique layout.

Precooked Food Industry Analysis Employment Generated By Multiple Segments Of Food Industry Professional PDF
This slide provides information regarding the employment generated by multiple segments of food manufacturing industry such as meats, bakery, beverages, grains and oil seeds in given quarter. It also visually reflects which segment is employee highest number of workers.Deliver an awe inspiring pitch with this creative Precooked Food Industry Analysis Employment Generated By Multiple Segments Of Food Industry Professional PDF bundle. Topics like Processed Food, Towards Total, Processed Food can be discussed with this completely editable template. It is available for immediate download depending on the needs and requirements of the user.
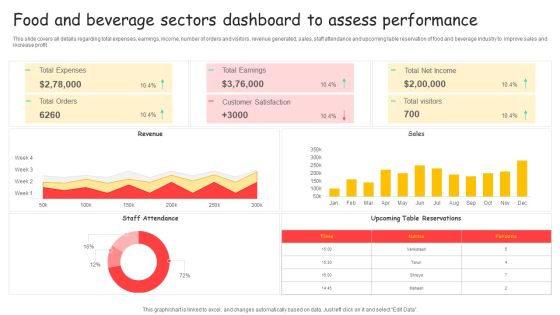
Food And Beverage Sectors Dashboard To Assess Performance Ppt Styles Elements PDF
This slide covers all details regarding total expenses, earnings, income, number of orders and visitors, revenue generated, sales, staff attendance and upcoming table reservation of food and beverage industry to improve sales and increase profit. Showcasing this set of slides titled Food And Beverage Sectors Dashboard To Assess Performance Ppt Styles Elements PDF. The topics addressed in these templates are Total Expenses, Total Earnings, Total Net Income. All the content presented in this PPT design is completely editable. Download it and make adjustments in color, background, font etc. as per your unique business setting.
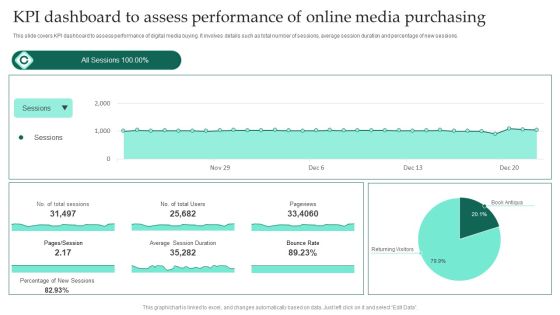
KPI Dashboard To Assess Performance Of Online Media Purchasing Ppt Professional Grid PDF
This slide covers KPI dashboard to assess performance of digital media buying. It involves details such as total number of sessions, average session duration and percentage of new sessions. Showcasing this set of slides titled KPI Dashboard To Assess Performance Of Online Media Purchasing Ppt Professional Grid PDF. The topics addressed in these templates are Average Session Duration, Bounce Rate, Pageviews. All the content presented in this PPT design is completely editable. Download it and make adjustments in color, background, font etc. as per your unique business setting.

Merger And Acquisition Buying Strategy For Business Growth Mergers And Acquisitions By Sector Designs PDF
The slide illustrates the graph of number of merger and acquisition deals by sector that the company has completed in last five years. It also covers key facts CAGR growth, deal value etc. related to merger and acquisition deals of the company. Deliver an awe inspiring pitch with this creative Merger And Acquisition Buying Strategy For Business Growth Mergers And Acquisitions By Sector Designs PDF bundle. Topics like Acquisition Value, Financials Services Sector can be discussed with this completely editable template. It is available for immediate download depending on the needs and requirements of the user.

Retail Outlet Operational Efficiency Analytics Sales Dashboards For Retail Store Inspiration PDF
This slide illustrates the dashboard retail store sales forecasting providing information regarding sales per employee, price unit every transaction, total number of customers and average value of customer transaction. Deliver and pitch your topic in the best possible manner with this Retail Outlet Operational Efficiency Analytics Sales Dashboards For Retail Store Inspiration PDF. Use them to share invaluable insights on Gross Sales, Total No Customers, Value Customer and impress your audience. This template can be altered and modified as per your expectations. So, grab it now.
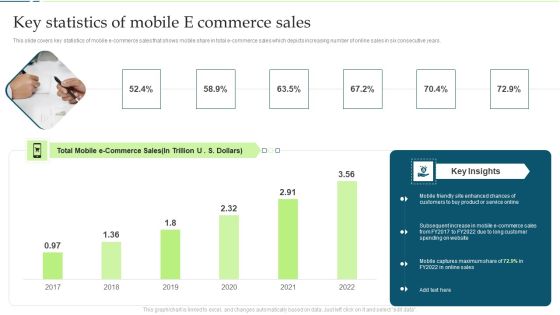
Customer Engagement And Experience Key Statistics Of Mobile E Commerce Sales Structure PDF Brochure PDF
This slide covers key statistics of mobile e commerce sales that shows mobile share in total e commerce sales which depicts increasing number of online sales in six consecutive years.Deliver and pitch your topic in the best possible manner with this Customer Engagement And Experience Key Statistics Of Mobile E Commerce Sales Structure PDF Brochure PDF. Use them to share invaluable insights on Subsequent Increase, Long Customer, Captures Maximum and impress your audience. This template can be altered and modified as per your expectations. So, grab it now.
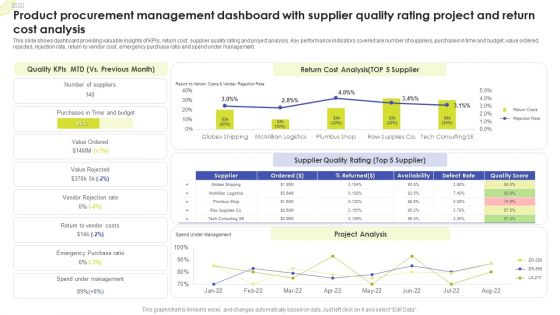
Product Procurement Management Dashboard With Supplier Quality Rating Project And Return Cost Analysis Sample PDF
This slide shows dashboard providing valuable insights of KPIs, return cost, supplier quality rating and project analysis. Key performance indicators covered are number of suppliers, purchases in time and budget, value ordered, rejected, rejection rate, return to vendor cost, emergency purchase ratio and spend under management. Pitch your topic with ease and precision using this Product Procurement Management Dashboard With Supplier Quality Rating Project And Return Cost Analysis Sample PDF. This layout presents information on Quality KPIs, Return Cost Analysis, Supplier Quality Rating. It is also available for immediate download and adjustment. So, changes can be made in the color, design, graphics or any other component to create a unique layout.

Promoting Growth Internal Operations Techniques Playbook Key Stats About Organic Growth Strategy Professional PDF
The following slide displays key stats of how organic growth is adopted among the industries as a key strategy for scaling up. It displays key information such as adoption of organic growth among various industries, total number of companies investing in new product line etc. Deliver an awe inspiring pitch with this creative Promoting Growth Internal Operations Techniques Playbook Key Stats About Organic Growth Strategy Professional PDF bundle. Topics like Organizations, Organic Growth, Strategy can be discussed with this completely editable template. It is available for immediate download depending on the needs and requirements of the user.

Digitalization Guide For Business How Digital Transformation Can Change Your Organization Background PDF
Purpose of the following slide is to show, how digital transformation can change organization as it provides key stats related to the same. It displays adoption rate of digital transformation, total number of companies who have experienced increase in revenues etc. Deliver an awe inspiring pitch with this creative Digitalization Guide For Business How Digital Transformation Can Change Your Organization Background PDF bundle. Topics like Adoption Rate, Digital Transformation, Various Organizations can be discussed with this completely editable template. It is available for immediate download depending on the needs and requirements of the user.

Buy Side Merger And Acquisition Pitch Book Mergers And Acquisitions By Sector Summary PDF
The slide illustrates the graph of number of merger and acquisition deals by sector that the company has completed in last five years. It also covers key facts CAGR growth, deal value etc. related to merger and acquisition deals of the company. Deliver an awe inspiring pitch with this creative Buy Side Merger And Acquisition Pitch Book Mergers And Acquisitions By Sector Summary PDF bundle. Topics like Financials Services, Acquisition Value can be discussed with this completely editable template. It is available for immediate download depending on the needs and requirements of the user.

Risk Key Performance Indicator Dashboard For Manufacturing Company Ppt Gallery Graphics Design PDF
The following slide highlights the safety key performance indicator dashboard for manufacturing company. It showcases safety incident per employee, total number of cases, safety events avoided, accumulated total and safety incidents. Pitch your topic with ease and precision using this Risk Key Performance Indicator Dashboard For Manufacturing Company Ppt Gallery Graphics Design PDF. This layout presents information on Safety Incidents, Safety Incident Avoided, Safety Incident Accumulated. It is also available for immediate download and adjustment. So, changes can be made in the color, design, graphics or any other component to create a unique layout.

Infrastructure Expansion KPI Dashboard For Investment Project Management Inspiration PDF
This slide covers management dashboard for analyzing the project performance and progress. It include KPIs such as total claims to date, total costs to date, project status, profits, number of days left, etc. Showcasing this set of slides titled Infrastructure Expansion KPI Dashboard For Investment Project Management Inspiration PDF. The topics addressed in these templates are Claims And Costs, Project Status, Profits. All the content presented in this PPT design is completely editable. Download it and make adjustments in color, background, font etc. as per your unique business setting.

Cash Flow Metrics To Measure Firm Operations Effectiveness Ppt Outline Infographic Template PDF
This slide showcases yearly cash conversion cycle to determine companys working capital management. It includes DSO, DIO, DPO and CCC that measure the average number of days organization takes to collect payment and pay bills. Pitch your topic with ease and precision using this Cash Flow Metrics To Measure Firm Operations Effectiveness Ppt Outline Infographic Template PDF. This layout presents information on Cash Conversion Cycle, 2019 To 2022, Cash Flow. It is also available for immediate download and adjustment. So, changes can be made in the color, design, graphics or any other component to create a unique layout.

Audit Firm Market Share By Company Earnings Stats Formats PDF
This slide depicts market share of audit firms in a graph. It also includes companies total revenue range and total number of audit firm along with a trend line. Showcasing this set of slides titled Audit Firm Market Share By Company Earnings Stats Formats PDF. The topics addressed in these templates are Company Earnings Stats, Audit Firm Market Share. All the content presented in this PPT design is completely editable. Download it and make adjustments in color, background, font etc. as per your unique business setting.

KPI Dashboard To Track IT Protection Performance Elements PDF
This slide shows the dashboard of cyber protection with incident and threat management. It includes overall progress, risk identified, number of critical incidents, initiatives, incident and threat management etc. Pitch your topic with ease and precision using this KPI Dashboard To Track IT Protection Performance Elements PDF. This layout presents information on Incident Management, Threat Management, Critital Risks Identified. It is also available for immediate download and adjustment. So, changes can be made in the color, design, graphics or any other component to create a unique layout.

Communication Kpis Performance Dashboard Of Social Media Channels Mockup PDF
This slide showcases dashboard that can help organization to analyze the effectiveness of communication KPIs campaign by studying channel views and number of likes. Its key components are youtube channel views, linkedin shares, linked in clicks and facebook daily reach. Pitch your topic with ease and precision using this Communication Kpis Performance Dashboard Of Social Media Channels Mockup PDF. This layout presents information on Linkedin Shares, Facebook Page likes, Facebook Daily Reach. It is also available for immediate download and adjustment. So, changes can be made in the color, design, graphics or any other component to create a unique layout.

Key Stats About Organic Growth Strategy Year Over Year Business Success Playbook Sample PDF
The following slide displays key stats of how organic growth is adopted among the Industries as a key strategy for scaling up. It displays key information such as adoption of organic growth among various Industries, total number of companies investing in new product line etc. There are so many reasons you need a Key Stats About Organic Growth Strategy Year Over Year Business Success Playbook Sample PDF. The first reason is you can not spend time making everything from scratch, Thus, Slidegeeks has made presentation templates for you too. You can easily download these templates from our website easily.
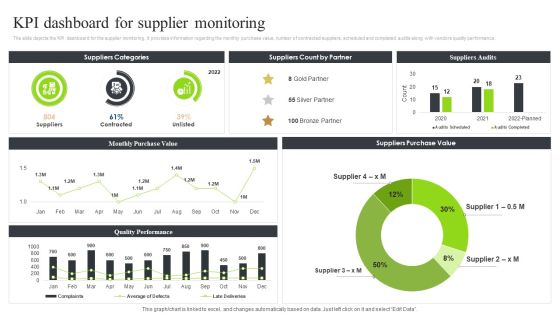
Strategic Sourcing And Supplier Quality Kpi Dashboard For Supplier Monitoring Graphics PDF
The slide depicts the KPI dashboard for the supplier monitoring. It provides information regarding the monthly purchase value, number of contracted suppliers, scheduled and completed audits along with vendors quality performance.Take your projects to the next level with our ultimate collection of Strategic Sourcing And Supplier Quality Kpi Dashboard For Supplier Monitoring Graphics PDF. Slidegeeks has designed a range of layouts that are perfect for representing task or activity duration, keeping track of all your deadlines at a glance. Tailor these designs to your exact needs and give them a truly corporate look with your own brand colors they all make your projects stand out from the rest.

Buy Side Advisory Services In M And A Mergers And Acquisitions By Sector Introduction PDF
The slide illustrates the graph of number of merger and acquisition deals by sector that the company has completed in last five years. It also covers key facts CAGR growth, deal value etc. related to merger and acquisition deals of the company.There are so many reasons you need a Buy Side Advisory Services In M And A Mergers And Acquisitions By Sector Introduction PDF. The first reason is you can not spend time making everything from scratch, Thus, Slidegeeks has made presentation templates for you too. You can easily download these templates from our website easily.
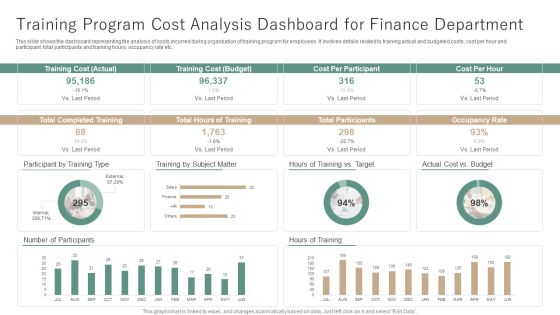
Training Program Cost Analysis Dashboard For Finance Department Ppt Example PDF
This slide shows the dashboard representing the analysis of costs incurred during organization of training program for employees. It involves details related to training actual and budgeted costs, cost per hour and participant, total participants and training hours, occupancy rate etc. Pitch your topic with ease and precision using this Training Program Cost Analysis Dashboard For Finance Department Ppt Example PDF. This layout presents information on Training Cost, Number Participants, Hours Of Training. It is also available for immediate download and adjustment. So, changes can be made in the color, design, graphics or any other component to create a unique layout.
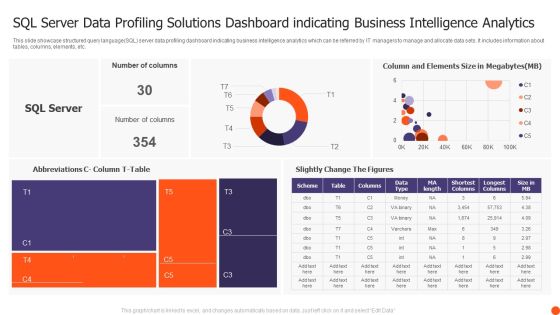
SQL Server Data Profiling Solutions Dashboard Indicating Business Intelligence Analytics Structure PDF
This slide showcase structured query language SQL server data profiling dashboard indicating business intelligence analytics which can be referred by IT managers to manage and allocate data sets. It includes information about tables, columns, elements, etc. Showcasing this set of slides titled SQL Server Data Profiling Solutions Dashboard Indicating Business Intelligence Analytics Structure PDF. The topics addressed in these templates are Number Columns, Slightly Change Figures, SQL Server. All the content presented in this PPT design is completely editable. Download it and make adjustments in color, background, font etc. as per your unique business setting.
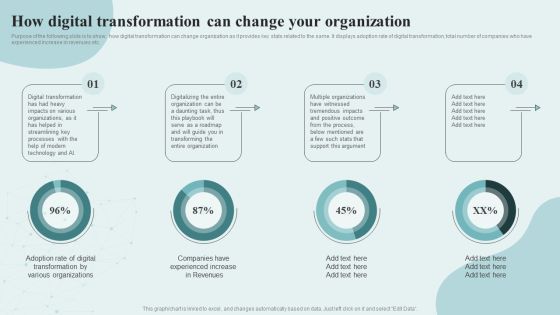
Digital Competency Evaluation And Modification How Digital Transformation Can Change Your Formats PDF
Purpose of the following slide is to show, how digital transformation can change organization as it provides key stats related to the same. It displays adoption rate of digital transformation, total number of companies who have experienced increase in revenues etc. There are so many reasons you need a Digital Competency Evaluation And Modification How Digital Transformation Can Change Your Formats PDF. The first reason is you cant spend time making everything from scratch, Thus, Slidegeeks has made presentation templates for you too. You can easily download these templates from our website easily.

Dashboard For Training Program Evaluation Sample PDF
This slide showcases dashboard that can help organization to evaluate the training program implemented in organization. Its key components are training cost, number of participants, hours of training, cost per participant and occupancy rate. Slidegeeks is one of the best resources for PowerPoint templates. You can download easily and regulate Dashboard For Training Program Evaluation Sample PDF for your personal presentations from our wonderful collection. A few clicks is all it takes to discover and get the most relevant and appropriate templates. Use our Templates to add a unique zing and appeal to your presentation and meetings. All the slides are easy to edit and you can use them even for advertisement purposes.

Business Unit Valuation And Development Dashboard Ppt Professional Graphic Tips PDF
This slide shows key performance indicators dashboard which represents number of assets along with their stages of development. It also includes estimated development cost and production index comparison. Pitch your topic with ease and precision using this Business Unit Valuation And Development Dashboard Ppt Professional Graphic Tips PDF. This layout presents information on Estimated Development Cost, Production Index, Development Stage. It is also available for immediate download and adjustment. So, changes can be made in the color, design, graphics or any other component to create a unique layout.

Impact Of Problems On Business IT Service Management Framework Graphics PDF
This slide depicts the impacts of issues on the business, such as revenue loss and customer loss, by describing the number monthly from January to December.Take your projects to the next level with our ultimate collection of Impact Of Problems On Business IT Service Management Framework Graphics PDF. Slidegeeks has designed a range of layouts that are perfect for representing task or activity duration, keeping track of all your deadlines at a glance. Tailor these designs to your exact needs and give them a truly corporate look with your own brand colors they all make your projects stand out from the rest.

Customer Attraction Through Email Marketing Business Communication Strategy Portrait PDF
This slide explains about increasing trends in email marketing strategy to outreach customers. It includes elements such as Number of users, key insights, artificial intelligence, personalized content etc. Pitch your topic with ease and precision using this Customer Attraction Through Email Marketing Business Communication Strategy Portrait PDF. This layout presents information on Gradual Increase, Email Outreach, Marketing Strategy. It is also available for immediate download and adjustment. So, changes can be made in the color, design, graphics or any other component to create a unique layout.

Customer Acquisition Approaches To Enhance Organization Growth Customer Acquisition Cost Analysis Dashboard Slides PDF
This slide covers the client acquisition cost CAC measurement dashboard with metrics such as total customers, employee satisfaction rate, number of trials, monthly active users, NPS net promoter score, etc. Make sure to capture your audiences attention in your business displays with our gratis customizable Customer Acquisition Approaches To Enhance Organization Growth Customer Acquisition Cost Analysis Dashboard Slides PDF. These are great for business strategies, office conferences, capital raising or task suggestions. If you desire to acquire more customers for your tech business and ensure they stay satisfied, create your own sales presentation with these plain slides.

Portfolio Investment Management Metric Dashboard Strategies To Enhance Portfolio Management Topics PDF
This slide represents portfolio investment management dashboard. It includes total invested amount, total number of investments made and rate of return.Get a simple yet stunning designed Portfolio Investment Management Metric Dashboard Strategies To Enhance Portfolio Management Topics PDF. It is the best one to establish the tone in your meetings. It is an excellent way to make your presentations highly effective. So, download this PPT today from Slidegeeks and see the positive impacts. Our easy-to-edit Portfolio Investment Management Metric Dashboard Strategies To Enhance Portfolio Management Topics PDF can be your go-to option for all upcoming conferences and meetings. So, what are you waiting for Grab this template today.

Impacts Of Rad Implementation On Business Rapid Application Building RAB Model Elements PDF
This slide represents the impacts of RAD implementation on the business, including costs, number of quality projects, risk mitigation, and percentage of satisfied customers.From laying roadmaps to briefing everything in detail, our templates are perfect for you. You can set the stage with your presentation slides. All you have to do is download these easy to edit and customizable templates. Impacts Of Rad Implementation On Business Rapid Application Building RAB Model Elements PDF will help you deliver an outstanding performance that everyone would remember and praise you for. Do download this presentation today.
 Home
Home