AI PPT Maker
Templates
PPT Bundles
Design Services
Business PPTs
Business Plan
Management
Strategy
Introduction PPT
Roadmap
Self Introduction
Timelines
Process
Marketing
Agenda
Technology
Medical
Startup Business Plan
Cyber Security
Dashboards
SWOT
Proposals
Education
Pitch Deck
Digital Marketing
KPIs
Project Management
Product Management
Artificial Intelligence
Target Market
Communication
Supply Chain
Google Slides
Research Services
 One Pagers
All Categories
-
Home
- Customer Favorites
- Net Income
Net Income
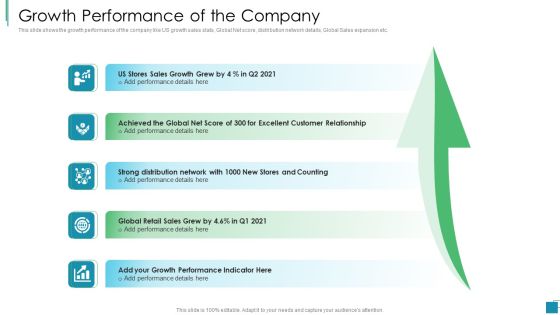
Venture Capital Pitch Decks For Private Companies Growth Performance Of The Company Pictures PDF
This slide shows the growth performance of the company like US growth sales stats, Global Net score, distribution network details, Global Sales expansion etc. This is a venture capital pitch decks for private companies growth performance of the company pictures pdf template with various stages. Focus and dispense information on five stages using this creative set, that comes with editable features. It contains large content boxes to add your information on topics like growth performance of the company. You can also showcase facts, figures, and other relevant content using this PPT layout. Grab it now.

Current Performance Of Key Accounting Indicators Rules PDF
The slide provides the 2029 and 2020 data of various Key performance indicators KPIs of accounting. Major KPIs include free cash flow, accounts payable, invoice errors, net discount, days sale outstanding, days payable outstanding, operating cycle days etc. Deliver an awe inspiring pitch with this creative Current Performance Of Key Accounting Indicators Rules PDF bundle. Topics like Accounts Payable, Sales, Require, Material can be discussed with this completely editable template. It is available for immediate download depending on the needs and requirements of the user.

Finance And Accounting Online Conversion Plan Current Performance Of Key Accounting Indicators Template PDF
The slide provides the 2022 and 2020 data of various Key performance indicators KPIs of accounting. Major KPIs include free cash flow, accounts payable, invoice errors, net discount, days sale outstanding, days payable outstanding, operating cycle days etc. Deliver and pitch your topic in the best possible manner with this Finance And Accounting Online Conversion Plan Current Performance Of Key Accounting Indicators Template PDF. Use them to share invaluable insights on Sales Outstanding, Payable Outstanding, Accounts Payable and impress your audience. This template can be altered and modified as per your expectations. So, grab it now.
KPI Dashboard For Tracking Supply Chain Costs Ppt Summary Templates PDF
This slide represents the KPI dashboard to track the multiple cost associated with supply chain in food manufacturing industry. It includes information regarding cash to cash cycle in days, carry cost of inventory along with details of net sales. Deliver an awe inspiring pitch with this creative KPI Dashboard For Tracking Supply Chain Costs Ppt Summary Templates PDF bundle. Topics like Supply Chain, Costs vs Sales, Carrying Costs Inventory, Supply Chain Costs can be discussed with this completely editable template. It is available for immediate download depending on the needs and requirements of the user.

Customer Experience Analysis Survey Outcome Percentage Portrait PDF
The following slide highlights percentage of results to analyze and enhance customer experience. It includes key elements such as customer experience with product, global net promoter score, regional sales agent performance, satisfaction channel, quarterly NPS, etc. Pitch your topic with ease and precision using this Customer Experience Analysis Survey Outcome Percentage Portrait PDF. This layout presents information on Customer Experience, Promoter Score, Regional Sales. It is also available for immediate download and adjustment. So, changes can be made in the color, design, graphics or any other component to create a unique layout.

Strategic Plan For Corporate Recovery Balance Sheet Statement FY 2020 2021 Background PDF
The purpose of this slide is to provide glimpse about the firms ability to create value for shareholders by generating positive cash flows for current year. Deliver and pitch your topic in the best possible manner with this strategic plan for corporate recovery balance sheet statement fy 2020 2021 background pdf. Use them to share invaluable insights on cash equivalents, net receivables, inventory, accumulated authorization, intangible assets and impress your audience. This template can be altered and modified as per your expectations. So, grab it now.

Business Operation Modeling Approaches Decision Tree Analysis In Business Mockup PDF
This slide provides the glimpse about the decision tree analysis of business project which focuses on decision definition, nodes, chance nodes, net path values, etc.This is a business operation modeling approaches decision tree analysis in business mockup pdf template with various stages. Focus and dispense information on two stages using this creative set, that comes with editable features. It contains large content boxes to add your information on topics like investing in the project, favourable project conditions, poor project conditions You can also showcase facts, figures, and other relevant content using this PPT layout. Grab it now.

Dashboard Depicting Customer Accomplishment Metrics Slides PDF
This slide covers the dashboard that depicts customer success metrics which includes total number of customers, net promoter score, support tickets, opportunities, contacts which are active and inactive, customer journey such as onboarding, growth, value achieved, renewal, etc. Showcasing this set of slides titled dashboard depicting customer accomplishment metrics slides pdf. The topics addressed in these templates are customers, unhealthy, support tickets. All the content presented in this PPT design is completely editable. Download it and make adjustments in color, background, font etc. as per your unique business setting.

5 KPIs To Measure Success Of Customer Brand Loyalty Program Ppt PowerPoint Presentation File Deck PDF
The purpose of this slide is to outline KPIs which can assist company to measure the success rate of customer loyalty program. The multiple KPIs are loyalty redemption rate, customer retention rate, repeat purchase rate, customer lifetime value and net promotor score. Showcasing this set of slides titled 5 kpis to measure success of customer brand loyalty program ppt powerpoint presentation file deck pdf. The topics addressed in these templates are loyalty redemption rate, customer retention rate, repeat purchase rate. All the content presented in this PPT design is completely editable. Download it and make adjustments in color, background, font etc. as per your unique business setting.

Client Achievements Playbook Why Customer Success Is The New Measure Of Business Success Elements PDF
The following slide depicts statistical data about customer success, which is now measured as one of the factors contributing to business success. Stats covered are of business value, customer centric approach etc. Deliver and pitch your topic in the best possible manner with this client achievements playbook why customer success is the new measure of business success elements pdf. Use them to share invaluable insights on customer success, net rete, companies implementing and impress your audience. This template can be altered and modified as per your expectations. So, grab it now.
Startup Company Valuation Methodologies Startup Valuation Method Comparison Details With Results Icons PDF
This slide shows the startup valuation method comparison details such as net present value, discounted payback method, internal rate of return method, etc.This is a Startup Company Valuation Methodologies Startup Valuation Method Comparison Details With Results Icons PDF template with various stages. Focus and dispense information on three stages using this creative set, that comes with editable features. It contains large content boxes to add your information on topics like Discounted Payback Method, Internal Rate Of Return, Valuation Method You can also showcase facts, figures, and other relevant content using this PPT layout. Grab it now.

Weighted Scoring Evaluation Model For Project Selection Slide Portrait PDF
The following slide highlights the weighted scoring model for project selection illustrating criteria, weightage, net present value, market share, environment friendly, operating efficiency, technical superiority and weighted score Pitch your topic with ease and precision using this Weighted Scoring Evaluation Model For Project Selection Slide Portrait PDF This layout presents information on Operating Efficiency, Environment Friendly, Technical Superiority It is also available for immediate download and adjustment. So, changes can be made in the color, design, graphics or any other component to create a unique layout.

Business Growth Strategy House Framework Demonstration PDF
The following slide showcases business strategy house diagram that helps in the acquisition of assets, the recruitment of fresh people, and the funding of investments. It includes strategic direction, net growth platforms, holding value and foundation. Pitch your topic with ease and precision using this Business Growth Strategy House Framework Demonstration PDF. This layout presents information on Strategic Direction, New Growth Platforms, Innovation. It is also available for immediate download and adjustment. So, changes can be made in the color, design, graphics or any other component to create a unique layout.
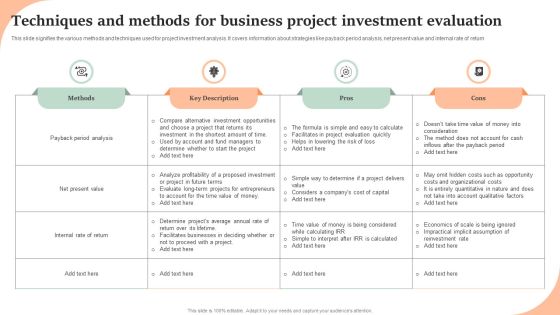
Techniques And Methods For Business Project Investment Evaluation Diagrams PDF
This slide signifies the various methods and techniques used for project investment analysis. It covers information about strategies like payback period analysis, net present value and internal rate of return. Showcasing this set of slides titled Techniques And Methods For Business Project Investment Evaluation Diagrams PDF. The topics addressed in these templates are Methods, Key Description, Pros, Cons. All the content presented in this PPT design is completely editable. Download it and make adjustments in color, background, font etc. as per your unique business setting.

Stats On KPIS To Measure Customer Experience Success Ppt PowerPoint Presentation Slides Objects PDF
This slide depicts key indicators to measure customer success. It includes metrics such as customer retention rate, customer satisfaction, customer lifetime value, visitor intent, net promoter score, customer effort score, likes and comments. Showcasing this set of slides titled Stats On KPIS To Measure Customer Experience Success Ppt PowerPoint Presentation Slides Objects PDF. The topics addressed in these templates are Measure Customer, Experience Success. All the content presented in this PPT design is completely editable. Download it and make adjustments in color, background, font etc. as per your unique business setting.

Enhancing Client Engagement Comparative Analysis Of Customer Success Metrics Icons PDF
This slide covers the comparative analysis of customer success metrics which includes different parameters such as customer lifetime value, repeat purchase rate, customer retention rate, net promoter score, etc. Create an editable Enhancing Client Engagement Comparative Analysis Of Customer Success Metrics Icons PDF that communicates your idea and engages your audience. Whether youre presenting a business or an educational presentation, pre-designed presentation templates help save time. Enhancing Client Engagement Comparative Analysis Of Customer Success Metrics Icons PDF is highly customizable and very easy to edit, covering many different styles from creative to business presentations. Slidegeeks has creative team members who have crafted amazing templates. So, go and get them without any delay.

Commodity Adoption Metrics For Technique Development Microsoft PDF
This slide highlights various key performance indicators to identify product adoption rate for user acquisition strategy development. It includes key metrics such as net promoter score, client retention rate, active user percentage, customer lifetime value and churn rate. Presenting Commodity Adoption Metrics For Technique Development Microsoft PDF to dispense important information. This template comprises four stages. It also presents valuable insights into the topics including Build Customer, Onboarding Process, Analysis. This is a completely customizable PowerPoint theme that can be put to use immediately. So, download it and address the topic impactfully.
Effective Methods For Assessment Investment Opportunities Themes PDF
This slide presents effective methods for assessing investment opportunities, helpful in comparing risk associated with multiple options. It includes urgency method, pay-back period method, net present value method and internal rate of return method. Persuade your audience using this Effective Methods For Assessment Investment Opportunities Themes PDF. This PPT design covers five stages, thus making it a great tool to use. It also caters to a variety of topics including Urgency Method, Original Investment, Determines. Download this PPT design now to present a convincing pitch that not only emphasizes the topic but also showcases your presentation skills.
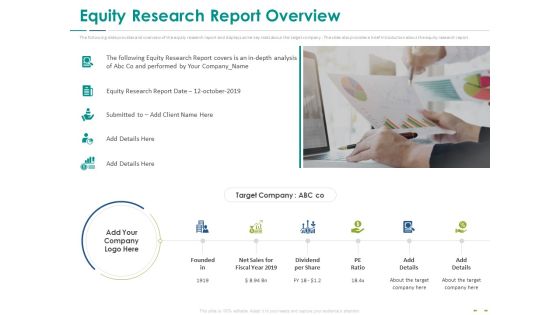
Stock Market Research Report Equity Research Report Overview Guidelines PDF
The following slide provides and overview of the equity research report and displays some key stats about the target company . The slide also provides a brief Introduction about the equity research report. This is a stock market research report equity research report overview guidelines pdf template with various stages. Focus and dispense information on five stages using this creative set, that comes with editable features. It contains large content boxes to add your information on topics like target company, net sales for fiscal year 2019, dividend per share, pe ratio. You can also showcase facts, figures, and other relevant content using this PPT layout. Grab it now.

Stock Market Research Report Target Company Overview For Equity Research Ppt PowerPoint Presentation Show Graphics PDF
The purpose of the following slide is to provide an overview of the company on which the equity research report is being made. This slide highlights the year in which the company was founded in, number of employees it has, multiple global locations etc. Deliver and pitch your topic in the best possible manner with this stock market research report target company overview for equity research ppt powerpoint presentation show graphics pdf. Use them to share invaluable insights on target, key highlights, headquartered, employees, net sales fiscal year 2019, research report. and impress your audience. This template can be altered and modified as per your expectations. So, grab it now.
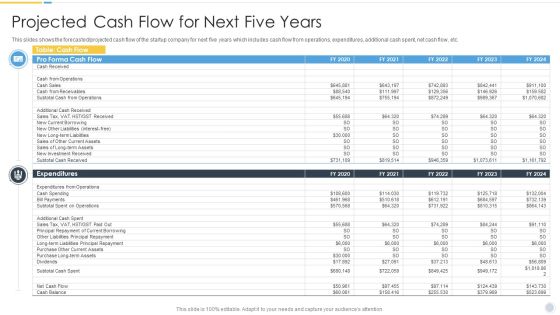
Growth Strategy For Startup Company Projected Cash Flow For Next Five Years Clipart PDF
This slides shows the forecasted or projected cash flow of the startup company for next five years which includes cash flow from operations, expenditures, additional cash spent, net cash flow, etc. Deliver an awe inspiring pitch with this creative Growth Strategy For Startup Company Projected Cash Flow For Next Five Years Clipart PDF bundle. Topics like Cash Sales, Cash From Receivables, Cash Spending can be discussed with this completely editable template. It is available for immediate download depending on the needs and requirements of the user.
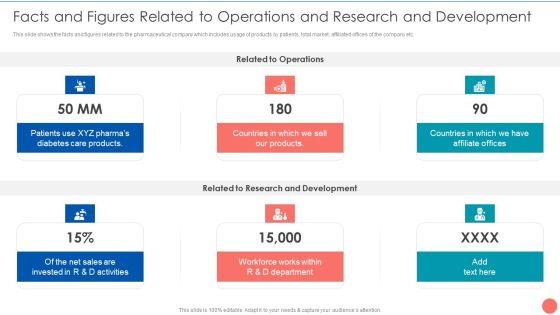
Tactics To Achieve Sustainability Facts And Figures Related To Operations And Research And Development Rules PDF
This slide shows the facts and figures related to the pharmaceutical company which includes usage of products by patients, total market, affiliated offices of the company etc. Presenting Tactics To Achieve Sustainability Facts And Figures Related To Operations And Research And Development Rules PDF to provide visual cues and insights. Share and navigate important information on six stages that need your due attention. This template can be used to pitch topics like Diabetes Care Products, Countries Affiliate Offices, Net Sales Invested. In addtion, this PPT design contains high resolution images, graphics, etc, that are easily editable and available for immediate download.
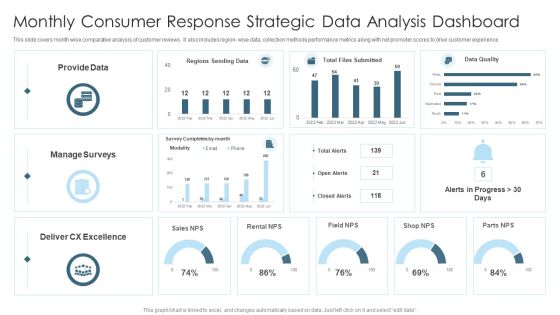
Monthly Consumer Response Strategic Data Analysis Dashboard Graphics PDF
This slide covers month wise comparative analysis of customer reviews . It also includes region wise data, collection methods performance metrics along with net promoter scores to drive customer experience. Showcasing this set of slides titled Monthly Consumer Response Strategic Data Analysis Dashboard Graphics PDF. The topics addressed in these templates are Provide Data, Sales, Manage Surveys. All the content presented in this PPT design is completely editable. Download it and make adjustments in color, background, font etc. as per your unique business setting.
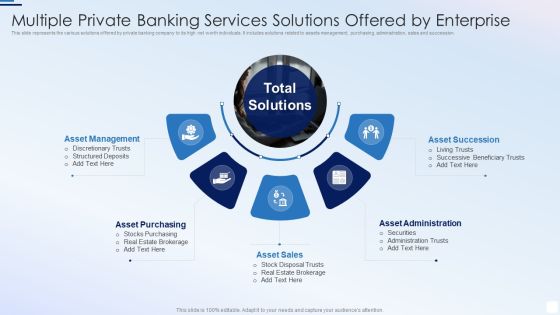
Multiple Private Banking Services Solutions Offered By Enterprise Structure PDF
This slide represents the various solutions offered by private banking company to its high net worth individuals. It includes solutions related to assets management, purchasing, administration, sales and succession.Presenting Multiple Private Banking Services Solutions Offered By Enterprise Structure PDF to dispense important information. This template comprises five stages. It also presents valuable insights into the topics including Asset Management, Asset Purchasing, Asset Succession. This is a completely customizable PowerPoint theme that can be put to use immediately. So, download it and address the topic impactfully.
Industry Analysis For Food Manufacturing Market KPI Dashboard For Tracking Supply Chain Costs Information PDF
This slide represents the KPI Dashboard to track the Multiple Cost Associated with Supply Chain in Food Manufacturing Industry. It includes information regarding Cash to Cash Cycle in days, Carry Cost of Inventory along with details of Net Sales.Deliver an awe inspiring pitch with this creative Industry Analysis For Food Manufacturing Market KPI Dashboard For Tracking Supply Chain Costs Information PDF bundle. Topics like Carrying Inventory, Supply Costs, Supply Chain can be discussed with this completely editable template. It is available for immediate download depending on the needs and requirements of the user.

Supply Chain Approaches Dashboard Depicting Supply Chain Metrics Background PDF
This slide shows the dashboard that depicts supply chain metrics such as total net sales, supply chain expenses, average cash to cash cycle in days, carrying costs of inventory, etc.Deliver and pitch your topic in the best possible manner with this Supply Chain Approaches Dashboard Depicting Supply Chain Metrics Background PDF. Use them to share invaluable insights on Supply Chain, Expenses Based Category, Chain Expenses and impress your audience. This template can be altered and modified as per your expectations. So, grab it now.
KPI Dashboard For Tracking Supply Chain Costs Inspiration PDF
This slide represents the KPI dashboard to track the multiple cost associated with supply chain in food manufacturing industry. It includes information regarding cash to cash cycle in days, carry cost of inventory along with details of net sales. Deliver an awe inspiring pitch with this creative KPI Dashboard For Tracking Supply Chain Costs Inspiration PDF bundle. Topics like Supply Chain Costs, Average Cash, Service can be discussed with this completely editable template. It is available for immediate download depending on the needs and requirements of the user.

Dabur Business Profile Domestic Manufacturing Facilities And Financial Highlights Topics PDF
This slide highlights the manufacturing facilities of Dabur in India through the political map. It includes Jammu, Baddi, Sahibabad, Alwar, Pithampur, Pantnagar, Tezpur, Narendrapur, Nasik, Indore, and Katni with brand offices. This is a Dabur Business Profile Domestic Manufacturing Facilities And Financial Highlights Topics PDF template with various stages. Focus and dispense information on one stages using this creative set, that comes with editable features. It contains large content boxes to add your information on topics like Net Sales, Branch Offices, Manufacturing Plants. You can also showcase facts, figures, and other relevant content using this PPT layout. Grab it now.
Precooked Food Industry Analysis KPI Dashboard For Tracking Supply Chain Costs Diagrams PDF
This slide represents the KPI dashboard to track the multiple cost associated with supply chain in food manufacturing industry. It includes information regarding cash to cash cycle in days, carry cost of inventory along with details of net sales.Deliver an awe inspiring pitch with this creative Precooked Food Industry Analysis KPI Dashboard For Tracking Supply Chain Costs Diagrams PDF bundle. Topics like Processing Industry, Food Processing, Manufacturing Industry can be discussed with this completely editable template. It is available for immediate download depending on the needs and requirements of the user.

Grow Capital Through Equity Debt Proceeds Analysis Follow On Offering Diagrams PDF
The slide provides the pro-forma credit statistics and ratios which includes EBITDA, free cash flow, total equity, total capital, net capital, etc.Make sure to capture your audiences attention in your business displays with our gratis customizable Grow Capital Through Equity Debt Proceeds Analysis Follow On Offering Diagrams PDF. These are great for business strategies, office conferences, capital raising or task suggestions. If you desire to acquire more customers for your tech business and ensure they stay satisfied, create your own sales presentation with these plain slides.
KPI Dashboard For Tracking Supply Chain Costs Industry Analysis Of Food Formats PDF
This slide represents the KPI dashboard to track the multiple cost associated with supply chain in food manufacturing industry. It includes information regarding cash to cash cycle in days, carry cost of inventory along with details of net sales.Find a pre-designed and impeccable KPI Dashboard For Tracking Supply Chain Costs Industry Analysis Of Food Formats PDF. The templates can ace your presentation without additional effort. You can download these easy-to-edit presentation templates to make your presentation stand out from others. So, what are you waiting for Download the template from Slidegeeks today and give a unique touch to your presentation.

Customer Acquisition Approaches To Enhance Organization Growth Customer Acquisition Cost Analysis Dashboard Slides PDF
This slide covers the client acquisition cost CAC measurement dashboard with metrics such as total customers, employee satisfaction rate, number of trials, monthly active users, NPS net promoter score, etc. Make sure to capture your audiences attention in your business displays with our gratis customizable Customer Acquisition Approaches To Enhance Organization Growth Customer Acquisition Cost Analysis Dashboard Slides PDF. These are great for business strategies, office conferences, capital raising or task suggestions. If you desire to acquire more customers for your tech business and ensure they stay satisfied, create your own sales presentation with these plain slides.
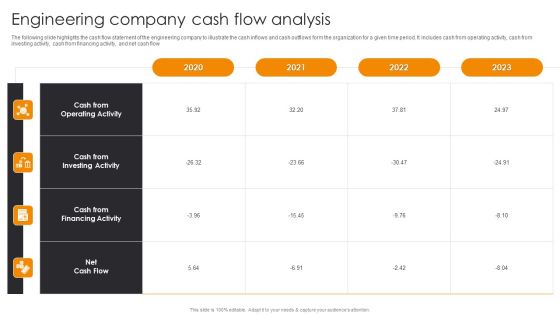
Engineering Company Cash Flow Analysis Engineering Company Financial Analysis Report Background PDF
The following slide highlights the cash flow statement of the engineering company to illustrate the cash inflows and cash outflows form the organization for a given time period. It includes cash from operating activity, cash from investing activity, cash from financing activity, and net cash flow. Make sure to capture your audiences attention in your business displays with our gratis customizable Engineering Company Cash Flow Analysis Engineering Company Financial Analysis Report Background PDF. These are great for business strategies, office conferences, capital raising or task suggestions. If you desire to acquire more customers for your tech business and ensure they stay satisfied, create your own sales presentation with these plain slides.

Construction Project Cost Benefit Analysis Report Five Years Cash Flow Projections Mockup PDF
This slide shows five years projection of cash flow statement. It includes details about net cash flow from operating activities, investment activities and financing activities. Make sure to capture your audiences attention in your business displays with our gratis customizable Construction Project Cost Benefit Analysis Report Five Years Cash Flow Projections Mockup PDF. These are great for business strategies, office conferences, capital raising or task suggestions. If you desire to acquire more customers for your tech business and ensure they stay satisfied, create your own sales presentation with these plain slides.

Construction Project Cost Benefit Analysis Report For Mortgage Approval Five Years Cash Flow Projections Slides PDF
This slide shows five years projection of cash flow statement. It includes details about net cash flow from operating activities, investment activities and financing activities. Make sure to capture your audiences attention in your business displays with our gratis customizable Construction Project Cost Benefit Analysis Report For Mortgage Approval Five Years Cash Flow Projections Slides PDF. These are great for business strategies, office conferences, capital raising or task suggestions. If you desire to acquire more customers for your tech business and ensure they stay satisfied, create your own sales presentation with these plain slides.
Food Processing Industry Latest Insights Trends And Analytics KPI Dashboard For Tracking Supply Chain Costs Demonstration PDF
This slide represents the KPI dashboard to track the multiple cost associated with supply chain in food manufacturing industry. It includes information regarding cash to cash cycle in days, carry cost of inventory along with details of net sales. There are so many reasons you need a Food Processing Industry Latest Insights Trends And Analytics KPI Dashboard For Tracking Supply Chain Costs Demonstration PDF. The first reason is you can not spend time making everything from scratch, Thus, Slidegeeks has made presentation templates for you too. You can easily download these templates from our website easily.
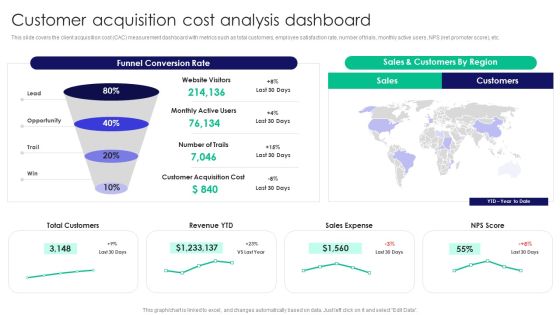
Guide To Business Customer Acquisition Customer Acquisition Cost Analysis Dashboard Download PDF
This slide covers the client acquisition cost CAC measurement dashboard with metrics such as total customers, employee satisfaction rate, number of trials, monthly active users, NPS net promoter score, etc. Make sure to capture your audiences attention in your business displays with our gratis customizable Guide To Business Customer Acquisition Customer Acquisition Cost Analysis Dashboard Download PDF. These are great for business strategies, office conferences, capital raising or task suggestions. If you desire to acquire more customers for your tech business and ensure they stay satisfied, create your own sales presentation with these plain slides.
Overall Marketing Dashboard Showcasing Market Performance Icons PDF
This slide showcases mass marketing dashboard which helps marketers in assessing there business performance. It provides information regarding net promoter score, inbound leads, sales per platform etc. Showcasing this set of slides titled Overall Marketing Dashboard Showcasing Market Performance Icons PDF. The topics addressed in these templates are Standard Customers, Market Share Growth Rate, Customer Locations . All the content presented in this PPT design is completely editable. Download it and make adjustments in color, background, font etc. as per your unique business setting.

Dashboard For Transaction Overview By Purchase Currency Template PDF
The following slide displays KPI dashboard to track transaction summary for buying and selling of foreign currency. It includes elements such as net settlement, total fees, reverse activity, refunds, sales, count, etc. Pitch your topic with ease and precision using this Dashboard For Transaction Overview By Purchase Currency Template PDF. This layout presents information on Purchase Currency, Reconciliation Activity, Returned Payment. It is also available for immediate download and adjustment. So, changes can be made in the color, design, graphics or any other component to create a unique layout.
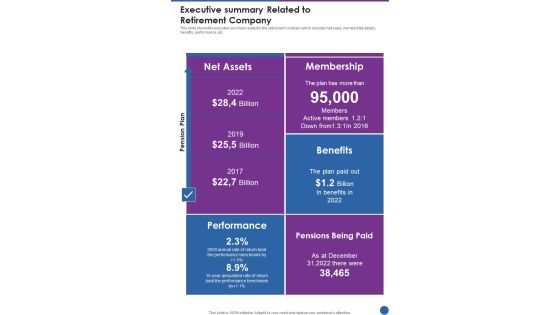
Executive Summary Related To Retirement Company One Pager Documents
This slide shows the executive summary related to the retirement company which includes net sales, membership details, benefits, performance, etc. Presenting you an exemplary Executive Summary Related To Retirement Company One Pager Documents. Our one-pager comprises all the must-have essentials of an inclusive document. You can edit it with ease, as its layout is completely editable. With such freedom, you can tweak its design and other elements to your requirements. Download this Executive Summary Related To Retirement Company One Pager Documents brilliant piece now.
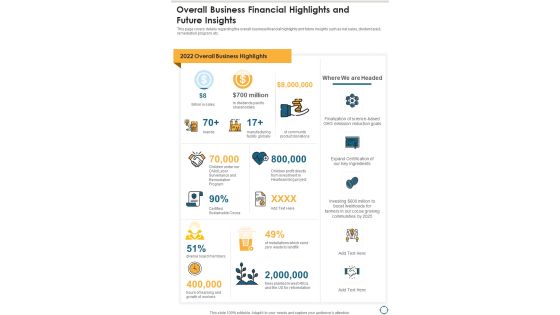
Overall Business Financial Highlights And Future Insights One Pager Documents
This page covers details regarding the overall business financial highlights and future insights such as net sales, dividend paid, remediation program, etc. Presenting you a fantastic Overall Business Financial Highlights And Future Insights One Pager Documents. This piece is crafted on hours of research and professional design efforts to ensure you have the best resource. It is completely editable and its design allow you to rehash its elements to suit your needs. Get this Overall Business Financial Highlights And Future Insights One Pager Documents A4 One-pager now.
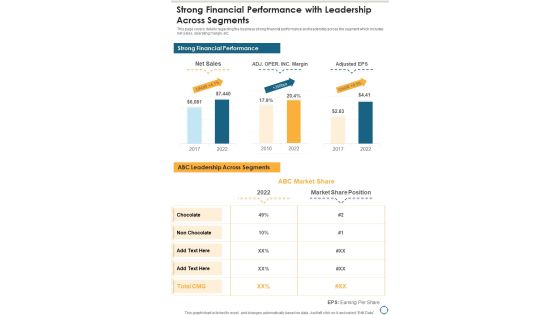
Strong Financial Performance With Leadership Across Segments One Pager Documents
This page covers details regarding the business strong financial performance and leadership across the segment which includes net sales, operating margin, etc. Presenting you an exemplary Strong Financial Performance With Leadership Across Segments One Pager Documents. Our one-pager comprises all the must-have essentials of an inclusive document. You can edit it with ease, as its layout is completely editable. With such freedom, you can tweak its design and other elements to your requirements. Download this Strong Financial Performance With Leadership Across Segments One Pager Documents brilliant piece now.
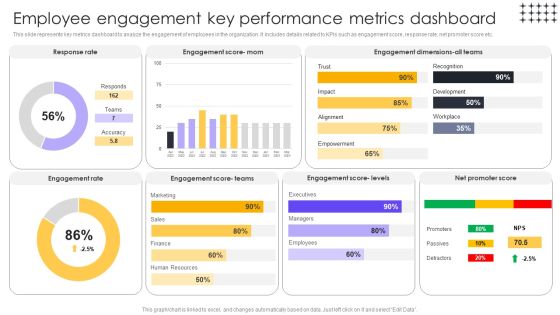
Tools For HR Business Analytics Employee Engagement Key Performance Metrics Brochure PDF
This slide represents key metrics dashboard to analyze the engagement of employees in the organization. It includes details related to KPIs such as engagement score, response rate, net promoter score etc. Make sure to capture your audiences attention in your business displays with our gratis customizable Tools For HR Business Analytics Employee Engagement Key Performance Metrics Brochure PDF. These are great for business strategies, office conferences, capital raising or task suggestions. If you desire to acquire more customers for your tech business and ensure they stay satisfied, create your own sales presentation with these plain slides.
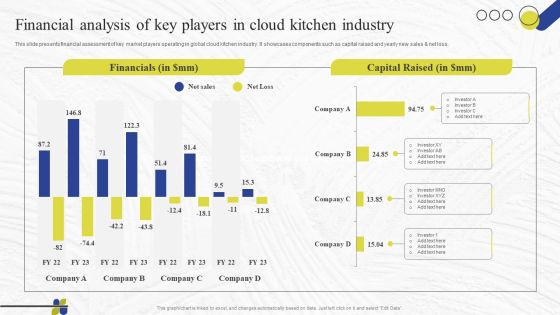
Virtual Kitchen Market Assessment Financial Analysis Of Key Players In Cloud Kitchen Industry Template PDF
This slide presents financial assessment of key market players operating in global cloud kitchen industry. It showcases components such as capital raised and yearly new sales and net loss. Boost your pitch with our creative Virtual Kitchen Market Assessment Financial Analysis Of Key Players In Cloud Kitchen Industry Template PDF. Deliver an awe-inspiring pitch that will mesmerize everyone. Using these presentation templates you will surely catch everyones attention. You can browse the ppts collection on our website. We have researchers who are experts at creating the right content for the templates. So you do not have to invest time in any additional work. Just grab the template now and use them.

Craft Material Supply Firm Fundraising Pitch Deck Financial Projections Template PDF
This slide provides an overview of the financial projections for the company. It showcases net sales of the craft supplies firm. Present like a pro with Craft Material Supply Firm Fundraising Pitch Deck Financial Projections Template PDF Create beautiful presentations together with your team, using our easy to use presentation slides. Share your ideas in real time and make changes on the fly by downloading our templates. So whether you are in the office, on the go, or in a remote location, you can stay in sync with your team and present your ideas with confidence. With Slidegeeks presentation got a whole lot easier. Grab these presentations today.
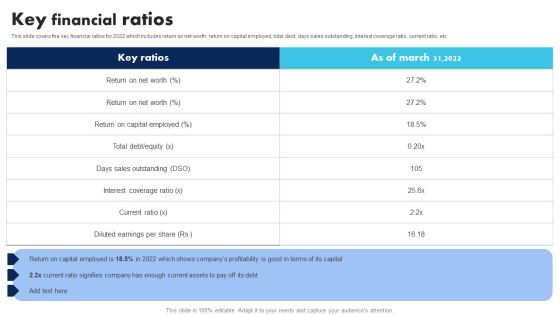
Information Technology Solutions Company Outline Key Financial Ratios Introduction PDF
This slide covers the key financial ratios for 2022 which includes return on net worth, return on capital employed, total debt, days sales outstanding, interest coverage ratio, current ratio, etc If your project calls for a presentation, then Slidegeeks is your go to partner because we have professionally designed, easy to edit templates that are perfect for any presentation. After downloading, you can easily edit Information Technology Solutions Company Outline Key Financial Ratios Introduction PDF and make the changes accordingly. You can rearrange slides or fill them with different images. Check out all the handy templates

Best Tools To Conduct Market Research Online Survey Ppt Professional Slides PDF
The following slide outlines comparative assessment of various online survey tools through which researchers can gather data in real-time. The comparison is drawn on basis of features such as online polling, net promoter score NPS survey structure, question branching, poll management, etc. Make sure to capture your audiences attention in your business displays with our gratis customizable Best Tools To Conduct Market Research Online Survey Ppt Professional Slides PDF. These are great for business strategies, office conferences, capital raising or task suggestions. If you desire to acquire more customers for your tech business and ensure they stay satisfied, create your own sales presentation with these plain slides.
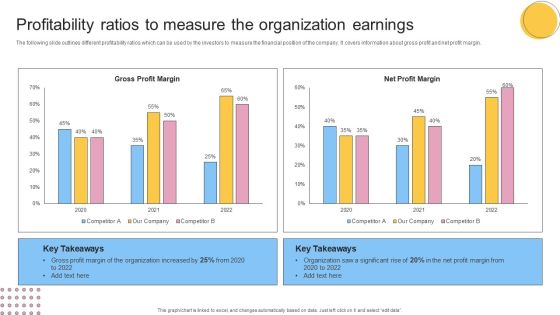
Profitability Ratios To Measure The Organization Earnings Ideas PDF
The following slide outlines different profitability ratios which can be used by the investors to measure the financial position of the company. It covers information about gross profit and net profit margin. Do you have an important presentation coming up Are you looking for something that will make your presentation stand out from the rest Look no further than Profitability Ratios To Measure The Organization Earnings Ideas PDF. With our professional designs, you can trust that your presentation will pop and make delivering it a smooth process. And with Slidegeeks, you can trust that your presentation will be unique and memorable. So why wait Grab Profitability Ratios To Measure The Organization Earnings Ideas PDF today and make your presentation stand out from the rest.
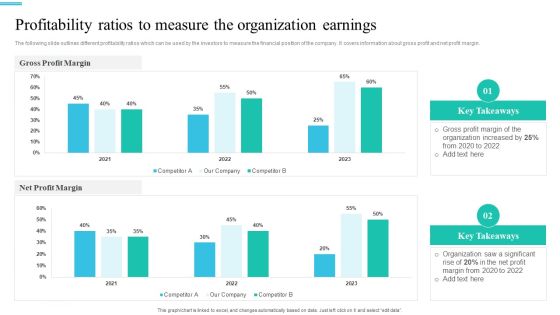
Monetary Planning And Evaluation Guide Profitability Ratios To Measure The Organization Earnings Ppt Ideas Skills PDF
The following slide outlines different profitability ratios which can be used by the investors to measure the financial position of the company. It covers information about gross profit and net profit margin. Retrieve professionally designed Monetary Planning And Evaluation Guide Profitability Ratios To Measure The Organization Earnings Ppt Ideas Skills PDF to effectively convey your message and captivate your listeners. Save time by selecting pre-made slideshows that are appropriate for various topics, from business to educational purposes. These themes come in many different styles, from creative to corporate, and all of them are easily adjustable and can be edited quickly. Access them as PowerPoint templates or as Google Slides themes. You do not have to go on a hunt for the perfect presentation because Slidegeeks got you covered from everywhere.

Effective Financial Planning Assessment Techniques Profitability Ratios To Measure The Organization Earnings Inspiration PDF
The following slide outlines different profitability ratios which can be used by the investors to measure the financial position of the company. It covers information about gross profit and net profit margin. Retrieve professionally designed Effective Financial Planning Assessment Techniques Profitability Ratios To Measure The Organization Earnings Inspiration PDF to effectively convey your message and captivate your listeners. Save time by selecting pre-made slideshows that are appropriate for various topics, from business to educational purposes. These themes come in many different styles, from creative to corporate, and all of them are easily adjustable and can be edited quickly. Access them as PowerPoint templates or as Google Slides themes. You do not have to go on a hunt for the perfect presentation because Slidegeeks got you covered from everywhere.

Estimating Business Overall Profitability Ratios To Measure The Organization Earnings Themes PDF
The following slide outlines different profitability ratios which can be used by the investors to measure the financial position of the company. It covers information about gross profit and net profit margin. The Estimating Business Overall Profitability Ratios To Measure The Organization Earnings Themes PDF is a compilation of the most recent design trends as a series of slides. It is suitable for any subject or industry presentation, containing attractive visuals and photo spots for businesses to clearly express their messages. This template contains a variety of slides for the user to input data, such as structures to contrast two elements, bullet points, and slides for written information. Slidegeeks is prepared to create an impression.

Overview Of Organizational Profitability Ratios To Measure The Organization Earnings Summary PDF
The following slide outlines different profitability ratios which can be used by the investors to measure the financial position of the company. It covers information about gross profit and net profit margin. The Overview Of Organizational Profitability Ratios To Measure The Organization Earnings Summary PDF is a compilation of the most recent design trends as a series of slides. It is suitable for any subject or industry presentation, containing attractive visuals and photo spots for businesses to clearly express their messages. This template contains a variety of slides for the user to input data, such as structures to contrast two elements, bullet points, and slides for written information. Slidegeeks is prepared to create an impression.
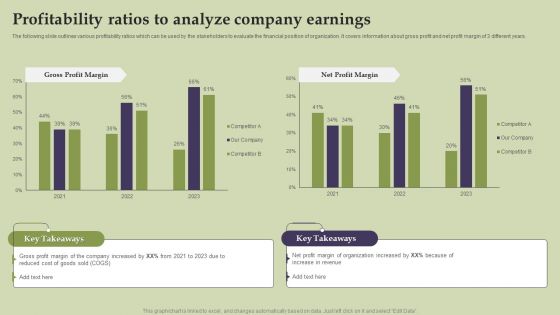
Methods And Approaches To Assess Profitability Ratios To Analyze Company Earnings Information PDF
The following slide outlines various profitability ratios which can be used by the stakeholders to evaluate the financial position of organization. It covers information about gross profit and net profit margin of 3 different years. This Methods And Approaches To Assess Profitability Ratios To Analyze Company Earnings Information PDF from Slidegeeks makes it easy to present information on your topic with precision. It provides customization options, so you can make changes to the colors, design, graphics, or any other component to create a unique layout. It is also available for immediate download, so you can begin using it right away. Slidegeeks has done good research to ensure that you have everything you need to make your presentation stand out. Make a name out there for a brilliant performance.
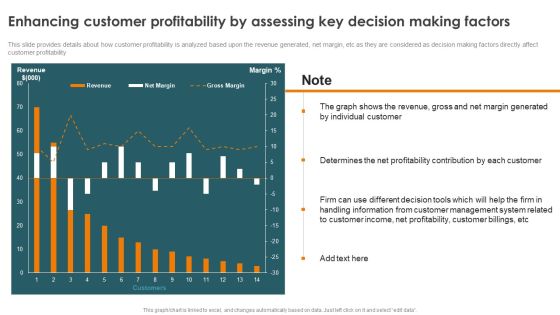
Profitability Modelling Framework Enhancing Customer Profitability By Assessing Key Sample PDF
This slide provides details about how customer profitability is analyzed based upon the revenue generated, net margin, etc as they are considered as decision making factors directly affect customer profitability. Coming up with a presentation necessitates that the majority of the effort goes into the content and the message you intend to convey. The visuals of a PowerPoint presentation can only be effective if it supplements and supports the story that is being told. Keeping this in mind our experts created Profitability Modelling Framework Enhancing Customer Profitability By Assessing Key Sample PDF to reduce the time that goes into designing the presentation. This way, you can concentrate on the message while our designers take care of providing you with the right template for the situation.

Food Company Financial Performance Summary Food Business Firm Profitability Ratios Download PDF
The following slide highlights the profitability ratio of the Food company to assess the organizations capability to earn compared to its revenue. Key ratios included are EBDIT margin, EBIT margin, PBT margin, Net profit margin, and asset turnover percentage. Do you have to make sure that everyone on your team knows about any specific topic I yes, then you should give Food Company Financial Performance Summary Food Business Firm Profitability Ratios Download PDF a try. Our experts have put a lot of knowledge and effort into creating this impeccable Food Company Financial Performance Summary Food Business Firm Profitability Ratios Download PDF. You can use this template for your upcoming presentations, as the slides are perfect to represent even the tiniest detail. You can download these templates from the Slidegeeks website and these are easy to edit. So grab these today
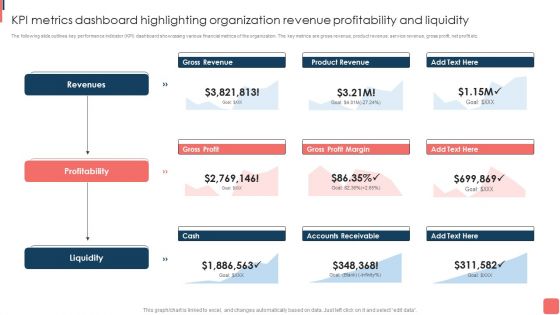
KPI Metrics Dashboard Highlighting Organization Revenue Profitability And Liquidity Template PDF
The following slide outlines key performance indicator KPI dashboard showcasing various financial metrics of the organization. The key metrics are gross revenue, product revenue, service revenue, gross profit, net profit etc. This KPI Metrics Dashboard Highlighting Organization Revenue Profitability And Liquidity Template PDF from Slidegeeks makes it easy to present information on your topic with precision. It provides customization options, so you can make changes to the colors, design, graphics, or any other component to create a unique layout. It is also available for immediate download, so you can begin using it right away. Slidegeeks has done good research to ensure that you have everything you need to make your presentation stand out. Make a name out there for a brilliant performance.

IT Firm Financial Statement Information Technology Company Profitability Ratios Clipart PDF
The following slide highlights the profitability ratio of the Information technology company to assess the organizations capability to earn compared to its revenue. Key ratios included are EBDIT margin, EBIT margin, PBT margin, Net profit margin, and asset turnover percentage. Coming up with a presentation necessitates that the majority of the effort goes into the content and the message you intend to convey. The visuals of a PowerPoint presentation can only be effective if it supplements and supports the story that is being told. Keeping this in mind our experts created IT Firm Financial Statement Information Technology Company Profitability Ratios Clipart PDF to reduce the time that goes into designing the presentation. This way, you can concentrate on the message while our designers take care of providing you with the right template for the situation.

Profit Assessment For Analyzing Overall Brand Performance Inspiration PDF
This slide provides information regarding profit assessment by determining brand performance on YoY basis. It includes elements such as net sales, cost of goods sold, gross margins, and other expenditures, etc. Get a simple yet stunning designed Profit Assessment For Analyzing Overall Brand Performance Inspiration PDF. It is the best one to establish the tone in your meetings. It is an excellent way to make your presentations highly effective. So, download this PPT today from Slidegeeks and see the positive impacts. Our easy to edit Profit Assessment For Analyzing Overall Brand Performance Inspiration PDF can be your go to option for all upcoming conferences and meetings. So, what are you waiting for Grab this template today.

Monetary Planning And Evaluation Guide KPI Metrics Dashboard Highlighting Organization Revenue Profitability And Liquidity Ppt Diagram Images PDF
The following slide outlines key performance indicator KPI dashboard showcasing various financial metrics of the organization. The key metrics are gross revenue, product revenue, service revenue, gross profit, net profit etc. Coming up with a presentation necessitates that the majority of the effort goes into the content and the message you intend to convey. The visuals of a PowerPoint presentation can only be effective if it supplements and supports the story that is being told. Keeping this in mind our experts created Monetary Planning And Evaluation Guide KPI Metrics Dashboard Highlighting Organization Revenue Profitability And Liquidity Ppt Diagram Images PDF to reduce the time that goes into designing the presentation. This way, you can concentrate on the message while our designers take care of providing you with the right template for the situation.

Maximizing Profit Returns With Right Distribution Source Impact Analysis Of New Distribution Strategies Structure PDF
This slide covers financial impact of new distribution strategies on revenue, gross profit margins, net profit margins and distribution and logistics cost. Company revenues has increased, profit margins have improved and distribution cost has decreased. This modern and well-arranged Maximizing Profit Returns With Right Distribution Source Impact Analysis Of New Distribution Strategies Structure PDF provides lots of creative possibilities. It is very simple to customize and edit with the Powerpoint Software. Just drag and drop your pictures into the shapes. All facets of this template can be edited with Powerpoint no extra software is necessary. Add your own material, put your images in the places assigned for them, adjust the colors, and then you can show your slides to the world, with an animated slide included.
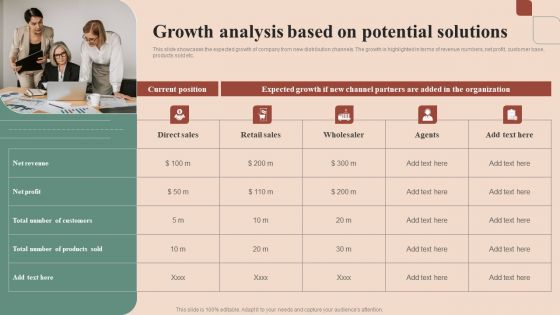
Maximizing Profit Returns With Right Distribution Source Growth Analysis Based On Potential Solutions Template PDF
This slide showcases the expected growth of company from new distribution channels. The growth is highlighted in terms of revenue numbers, net profit, customer base, products sold etc. Coming up with a presentation necessitates that the majority of the effort goes into the content and the message you intend to convey. The visuals of a PowerPoint presentation can only be effective if it supplements and supports the story that is being told. Keeping this in mind our experts created Maximizing Profit Returns With Right Distribution Source Growth Analysis Based On Potential Solutions Template PDF to reduce the time that goes into designing the presentation. This way, you can concentrate on the message while our designers take care of providing you with the right template for the situation.

Comprehensive Promotion Guidelines To Administer Brand Profit Assessment For Analyzing Overall Brand Ideas PDF
This slide provides information regarding profit assessment by determining brand performance on YoY basis. It includes elements such as net sales, cost of goods sold, gross margins, and other expenditures, etc. Here you can discover an assortment of the finest PowerPoint and Google Slides templates. With these templates, you can create presentations for a variety of purposes while simultaneously providing your audience with an eye-catching visual experience. Download Comprehensive Promotion Guidelines To Administer Brand Profit Assessment For Analyzing Overall Brand Ideas PDF to deliver an impeccable presentation. These templates will make your job of preparing presentations much quicker, yet still, maintain a high level of quality. Slidegeeks has experienced researchers who prepare these templates and write high-quality content for you. Later on, you can personalize the content by editing the Comprehensive Promotion Guidelines To Administer Brand Profit Assessment For Analyzing Overall Brand Ideas PDF.
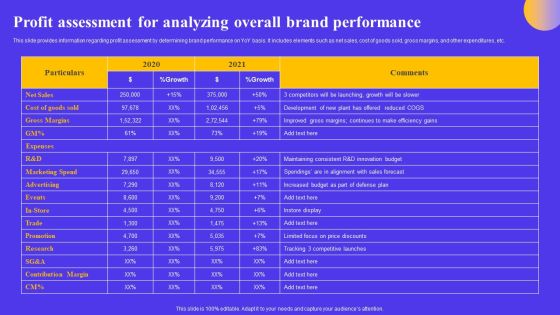
Strategic Toolkit For Brand Performance Enhancement Profit Assessment For Analyzing Overall Brand Formats PDF
This slide provides information regarding profit assessment by determining brand performance on YoY basis. It includes elements such as net sales, cost of goods sold, gross margins, and other expenditures, etc. Find highly impressive Strategic Toolkit For Brand Performance Enhancement Profit Assessment For Analyzing Overall Brand Formats PDF on Slidegeeks to deliver a meaningful presentation. You can save an ample amount of time using these presentation templates. No need to worry to prepare everything from scratch because Slidegeeks experts have already done a huge research and work for you. You need to download Strategic Toolkit For Brand Performance Enhancement Profit Assessment For Analyzing Overall Brand Formats PDF for your upcoming presentation. All the presentation templates are 100 percent editable and you can change the color and personalize the content accordingly. Download now.

Brand Plan Toolkit For Marketers Profit Assessment For Analyzing Overall Brand Performance Topics PDF
This slide provides information regarding profit assessment by determining brand performance on YoY basis. It includes elements such as net sales, cost of goods sold, gross margins, and other expenditures, etc. Present like a pro with Brand Plan Toolkit For Marketers Profit Assessment For Analyzing Overall Brand Performance Topics PDF Create beautiful presentations together with your team, using our easy to use presentation slides. Share your ideas in real time and make changes on the fly by downloading our templates. So whether you are in the office, on the go, or in a remote location, you can stay in sync with your team and present your ideas with confidence. With Slidegeeks presentation got a whole lot easier. Grab these presentations today.
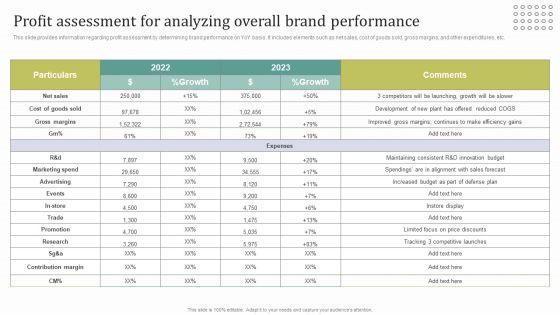
Instructions For Brand Performance Management Team Profit Assessment For Analyzing Overall Brand Structure PDF
This slide provides information regarding profit assessment by determining brand performance on YoY basis. It includes elements such as net sales, cost of goods sold, gross margins, and other expenditures, etc. The Instructions For Brand Performance Management Team Profit Assessment For Analyzing Overall Brand Structure PDF is a compilation of the most recent design trends as a series of slides. It is suitable for any subject or industry presentation, containing attractive visuals and photo spots for businesses to clearly express their messages. This template contains a variety of slides for the user to input data, such as structures to contrast two elements, bullet points, and slides for written information. Slidegeeks is prepared to create an impression.

Defensive Brand Marketing Profit Assessment For Analyzing Overall Brand Performance Summary PDF
This slide provides information regarding profit assessment by determining brand performance on YoY basis. It includes elements such as net sales, cost of goods sold, gross margins, and other expenditures, etc. This Defensive Brand Marketing Profit Assessment For Analyzing Overall Brand Performance Summary PDF from Slidegeeks makes it easy to present information on your topic with precision. It provides customization options, so you can make changes to the colors, design, graphics, or any other component to create a unique layout. It is also available for immediate download, so you can begin using it right away. Slidegeeks has done good research to ensure that you have everything you need to make your presentation stand out. Make a name out there for a brilliant performance.

Toolkit To Administer Tactical Profit Assessment For Analyzing Overall Brand Performance Brochure PDF
This slide provides information regarding profit assessment by determining brand performance on YoY basis. It includes elements such as net sales, cost of goods sold, gross margins, and other expenditures, etc. The Toolkit To Administer Tactical Profit Assessment For Analyzing Overall Brand Performance Brochure PDF is a compilation of the most recent design trends as a series of slides. It is suitable for any subject or industry presentation, containing attractive visuals and photo spots for businesses to clearly express their messages. This template contains a variety of slides for the user to input data, such as structures to contrast two elements, bullet points, and slides for written information. Slidegeeks is prepared to create an impression.

Brand Identity Management Toolkit Profit Assessment For Analyzing Overall Brand Template PDF
This slide provides information regarding profit assessment by determining brand performance on YoY basis. It includes elements such as net sales, cost of goods sold, gross margins, and other expenditures, etc. Slidegeeks is one of the best resources for PowerPoint templates. You can download easily and regulate Brand Identity Management Toolkit Profit Assessment For Analyzing Overall Brand Template PDF for your personal presentations from our wonderful collection. A few clicks is all it takes to discover and get the most relevant and appropriate templates. Use our Templates to add a unique zing and appeal to your presentation and meetings. All the slides are easy to edit and you can use them even for advertisement purposes.

Analyzing Companys Current Sales Revenue And Customer Base Graphics PDF
The following slide highlights the current scenario of company sales and customer retention rates. It illustrates graphs of last 3 years which shows company sales and net profit margins are declining and existing customer are leaving the company.Here you can discover an assortment of the finest PowerPoint and Google Slides templates. With these templates, you can create presentations for a variety of purposes while simultaneously providing your audience with an eye-catching visual experience. Download Analyzing Companys Current Sales Revenue And Customer Base Graphics PDF to deliver an impeccable presentation. These templates will make your job of preparing presentations much quicker, yet still, maintain a high level of quality. Slidegeeks has experienced researchers who prepare these templates and write high-quality content for you. Later on, you can personalize the content by editing the Analyzing Companys Current Sales Revenue And Customer Base Graphics PDF.
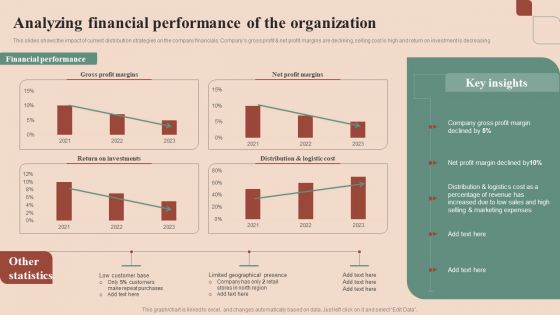
Maximizing Profit Returns With Right Distribution Source Analyzing Financial Performance Of The Organization Introduction PDF
This slides shows the impact of current distribution strategies on the company financials. Companys gross profit and net profit margins are declining, selling cost is high and return on investment is decreasing . Create an editable Maximizing Profit Returns With Right Distribution Source Analyzing Financial Performance Of The Organization Introduction PDF that communicates your idea and engages your audience. Whether you are presenting a business or an educational presentation, pre-designed presentation templates help save time. Maximizing Profit Returns With Right Distribution Source Analyzing Financial Performance Of The Organization Introduction PDF is highly customizable and very easy to edit, covering many different styles from creative to business presentations. Slidegeeks has creative team members who have crafted amazing templates. So, go and get them without any delay.
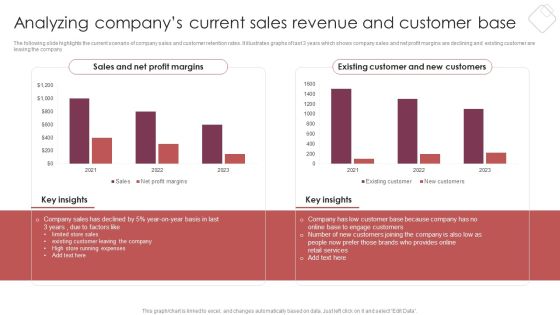
E Commerce Marketing Techniques To Boost Sales Analyzing Companys Current Sales Revenue And Customer Base Formats PDF
The following slide highlights the current scenario of company sales and customer retention rates. It illustrates graphs of last 3 years which shows company sales and net profit margins are declining and existing customer are leaving the company. Want to ace your presentation in front of a live audience. Our E Commerce Marketing Techniques To Boost Sales Analyzing Companys Current Sales Revenue And Customer Base Formats PDF can help you do that by engaging all the users towards you.. Slidegeeks experts have put their efforts and expertise into creating these impeccable powerpoint presentations so that you can communicate your ideas clearly. Moreover, all the templates are customizable, and easy-to-edit and downloadable. Use these for both personal and commercial use.
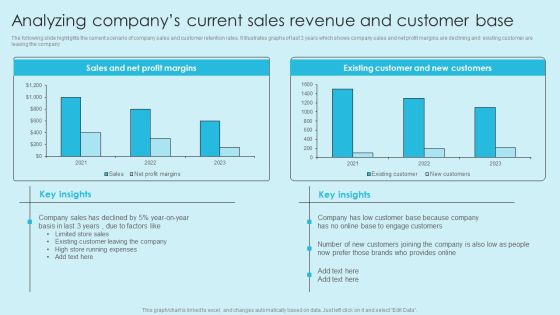
Online Marketing Techniques For Acquiring Clients Analyzing Companys Current Sales Revenue Pictures PDF
The following slide highlights the current scenario of company sales and customer retention rates. It illustrates graphs of last 3 years which shows company sales and net profit margins are declining and existing customer are leaving the company. Do you have to make sure that everyone on your team knows about any specific topic. I yes, then you should give Online Marketing Techniques For Acquiring Clients Analyzing Companys Current Sales Revenue Pictures PDF a try. Our experts have put a lot of knowledge and effort into creating this impeccable Online Marketing Techniques For Acquiring Clients Analyzing Companys Current Sales Revenue Pictures PDF. You can use this template for your upcoming presentations, as the slides are perfect to represent even the tiniest detail. You can download these templates from the Slidegeeks website and these are easy to edit. So grab these today.

Techniques To Enhance Customer Engagement Via Digital Platforms Analyzing Companys Current Sales Revenue And Customer Base Slide Ideas PDF
The following slide highlights the current scenario of company sales and customer retention rates. It illustrates graphs of last 3 years which shows company sales and net profit margins are declining and existing customer are leaving the company. Create an editable Techniques To Enhance Customer Engagement Via Digital Platforms Analyzing Companys Current Sales Revenue And Customer Base Slide Ideas PDF that communicates your idea and engages your audience. Whether youre presenting a business or an educational presentation, pre-designed presentation templates help save time. Techniques To Enhance Customer Engagement Via Digital Platforms Analyzing Companys Current Sales Revenue And Customer Base Slide Ideas PDF is highly customizable and very easy to edit, covering many different styles from creative to business presentations. Slidegeeks has creative team members who have crafted amazing templates. So, go and get them without any delay.
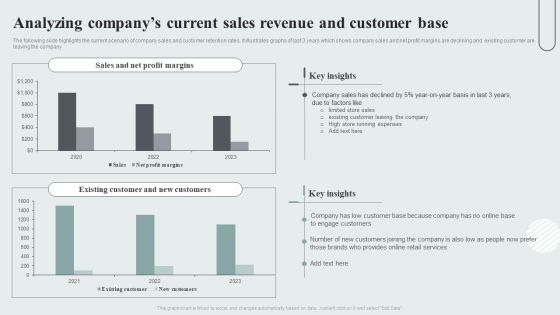
Techniques To Enhance Customer Engagement Via Digital Platforms Analyzing Companys Current Sales Revenue And Customer Base Themes PDF
The following slide highlights the current scenario of company sales and customer retention rates. It illustrates graphs of last 3 years which shows company sales and net profit margins are declining and existing customer are leaving the company. Slidegeeks is one of the best resources for PowerPoint templates. You can download easily and regulate Techniques To Enhance Customer Engagement Via Digital Platforms Analyzing Companys Current Sales Revenue And Customer Base Themes PDF for your personal presentations from our wonderful collection. A few clicks is all it takes to discover and get the most relevant and appropriate templates. Use our Templates to add a unique zing and appeal to your presentation and meetings. All the slides are easy to edit and you can use them even for advertisement purposes.
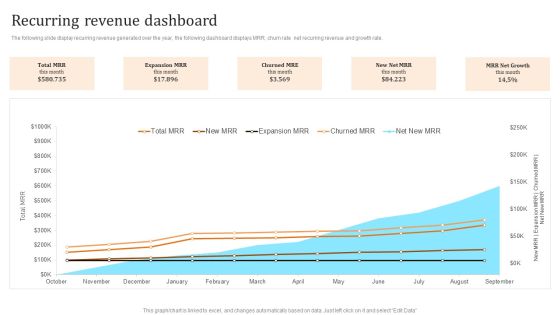
Membership Based Revenue Plan Recurring Revenue Dashboard Pictures PDF
The following slide display recurring revenue generated over the year, the following dashboard displays MRR, churn rate net recurring revenue and growth rate. Formulating a presentation can take up a lot of effort and time, so the content and message should always be the primary focus. The visuals of the PowerPoint can enhance the presenters message, so our Membership Based Revenue Plan Recurring Revenue Dashboard Pictures PDF was created to help save time. Instead of worrying about the design, the presenter can concentrate on the message while our designers work on creating the ideal templates for whatever situation is needed. Slidegeeks has experts for everything from amazing designs to valuable content, we have put everything into Membership Based Revenue Plan Recurring Revenue Dashboard Pictures PDF

Customer Service Plan To Improve Sales Metrics To Measure Customer And Revenue Churn Infographics PDF
This slide focuses on metrics to measure customer and revenue churn which also shows net promoter score, customer loyalty rate, percentage of premium users, customer lifetime value, etc. This modern and well arranged Customer Service Plan To Improve Sales Metrics To Measure Customer And Revenue Churn Infographics PDF provides lots of creative possibilities. It is very simple to customize and edit with the Powerpoint Software. Just drag and drop your pictures into the shapes. All facets of this template can be edited with Powerpoint no extra software is necessary. Add your own material, put your images in the places assigned for them, adjust the colors, and then you can show your slides to the world, with an animated slide included.
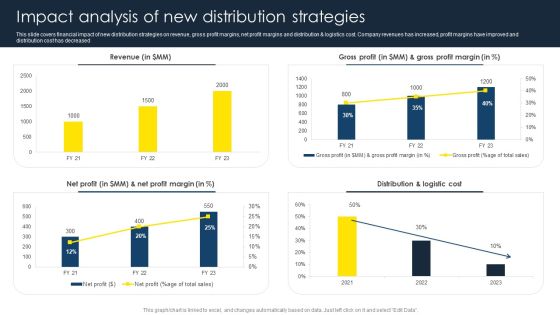
Optimize Business Sales Impact Analysis Of New Distribution Strategies Background PDF
This slide covers financial impact of new distribution strategies on revenue, gross profit margins, net profit margins and distribution AND logistics cost. Company revenues has increased, profit margins have improved and distribution cost has decreased. Do you have to make sure that everyone on your team knows about any specific topic I yes, then you should give Optimize Business Sales Impact Analysis Of New Distribution Strategies Background PDF a try. Our experts have put a lot of knowledge and effort into creating this impeccable Optimize Business Sales Impact Analysis Of New Distribution Strategies Background PDF. You can use this template for your upcoming presentations, as the slides are perfect to represent even the tiniest detail. You can download these templates from the Slidegeeks website and these are easy to edit. So grab these today.

Estimating Business Overall Kpi Metrics Dashboard Highlighting Organization Revenue Clipart PDF
The following slide outlines key performance indicator KPI dashboard showcasing various financial metrics of the organization. The key metrics are gross revenue, product revenue, service revenue, gross profit, net profit etc. Formulating a presentation can take up a lot of effort and time, so the content and message should always be the primary focus. The visuals of the PowerPoint can enhance the presenters message, so our Estimating Business Overall Kpi Metrics Dashboard Highlighting Organization Revenue Clipart PDF was created to help save time. Instead of worrying about the design, the presenter can concentrate on the message while our designers work on creating the ideal templates for whatever situation is needed. Slidegeeks has experts for everything from amazing designs to valuable content, we have put everything into Estimating Business Overall Kpi Metrics Dashboard Highlighting Organization Revenue Clipart PDF.

Periodic Revenue Model Our Financial Performance Over The Year Themes PDF
The purpose of the following slide is to analyze the financial performance of the organization. The provided graph highlight the revenues, Gross profit and net profit margin of the organization for the year 2016,17,18 and 19. Create an editable Periodic Revenue Model Our Financial Performance Over The Year Themes PDF that communicates your idea and engages your audience. Whether youre presenting a business or an educational presentation, pre designed presentation templates help save time. Periodic Revenue Model Our Financial Performance Over The Year Themes PDF is highly customizable and very easy to edit, covering many different styles from creative to business presentations. Slidegeeks has creative team members who have crafted amazing templates. So, go and get them without any delay.
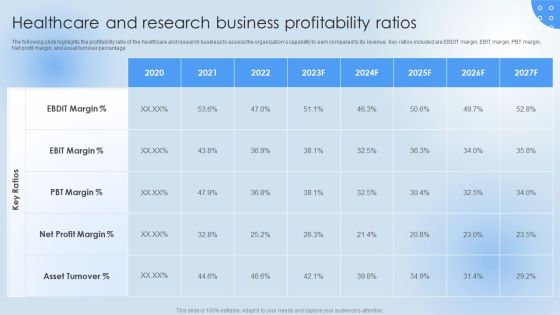
Healthcare And Research Business Pharmaceutical Company Financial Summary Information PDF
The following slide highlights the profitability ratio of the healthcare and research business to assess the organizations capability to earn compared to its revenue. Key ratios included are EBDIT margin, EBIT margin, PBT margin, Net profit margin, and asset turnover percentage. This Healthcare And Research Business Pharmaceutical Company Financial Summary Information PDF is perfect for any presentation, be it in front of clients or colleagues. It is a versatile and stylish solution for organizing your meetings. The Healthcare And Research Business Pharmaceutical Company Financial Summary Information PDF features a modern design for your presentation meetings. The adjustable and customizable slides provide unlimited possibilities for acing up your presentation. Slidegeeks has done all the homework before launching the product for you. So, dont wait, grab the presentation templates today.
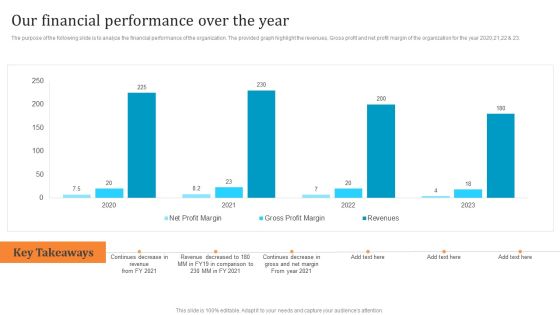
Membership Based Revenue Plan Our Financial Performance Over The Year Mockup PDF
The purpose of the following slide is to analyze the financial performance of the organization. The provided graph highlight the revenues, Gross profit and net profit margin of the organization for the year 2020,21,22 and 23. Are you in need of a template that can accommodate all of your creative concepts This one is crafted professionally and can be altered to fit any style. Use it with Google Slides or PowerPoint. Include striking photographs, symbols, depictions, and other visuals. Fill, move around, or remove text boxes as desired. Test out color palettes and font mixtures. Edit and save your work, or work with colleagues. Download Membership Based Revenue Plan Our Financial Performance Over The Year Mockup PDF and observe how to make your presentation outstanding. Give an impeccable presentation to your group and make your presentation unforgettable.

Engineering Services Company Valuation Ratios Engineering Company Financial Analysis Report Brochure PDF
The following slide highlights the valuation ratio of the engineering company to assess the organizations worth on the basis of share price, sales, and market capitalization, Key ratios included are enterprise value, EV per net sales, price to book value, market cap per sales, retention ratio and earnings yield. The Engineering Services Company Valuation Ratios Engineering Company Financial Analysis Report Brochure PDF is a compilation of the most recent design trends as a series of slides. It is suitable for any subject or industry presentation, containing attractive visuals and photo spots for businesses to clearly express their messages. This template contains a variety of slides for the user to input data, such as structures to contrast two elements, bullet points, and slides for written information. Slidegeeks is prepared to create an impression.

IT Firm Financial Statement Information Technology Company Valuation Ratios Demonstration PDF
The following slide highlights the valuation ratio of the Information technology company to assess the organizations worth on the basis of share price, sales, and market capitalization, Key ratios included are enterprise value, EV per net sales, price to book value, market cap per sales, retention ratio and Earnings yield. This modern and well arranged IT Firm Financial Statement Information Technology Company Valuation Ratios Demonstration PDF provides lots of creative possibilities. It is very simple to customize and edit with the Powerpoint Software. Just drag and drop your pictures into the shapes. All facets of this template can be edited with Powerpoint no extra software is necessary. Add your own material, put your images in the places assigned for them, adjust the colors, and then you can show your slides to the world, with an animated slide included.

Software Company Quarterly Valuation Ratios Financial Performance Report Of Software Firm Demonstration PDF
The following slide highlights the valuation ratio of the software company to assess the organizations worth on the basis of share price, sales, and market capitalization, Key ratios included are enterprise value, EV per net sales, price to book value, market cap per sales, retention ratio and Earnings yield. Formulating a presentation can take up a lot of effort and time, so the content and message should always be the primary focus. The visuals of the PowerPoint can enhance the presenters message, so our Software Company Quarterly Valuation Ratios Financial Performance Report Of Software Firm Demonstration PDF was created to help save time. Instead of worrying about the design, the presenter can concentrate on the message while our designers work on creating the ideal templates for whatever situation is needed. Slidegeeks has experts for everything from amazing designs to valuable content, we have put everything into Software Company Quarterly Valuation Ratios Financial Performance Report Of Software Firm Demonstration PDF

Healthcare And Research Business Valuation Pharmaceutical Company Financial Summary Portrait PDF
The following slide highlights the valuation ratio of the healthcare and research business to assess the organizations worth on the basis of share price, sales, and market capitalization. Key ratios included are enterprise value, EV per net sales, price to book value, market cap per sales, retention ratio and Earnings yield. Do you have to make sure that everyone on your team knows about any specific topic I yes, then you should give Healthcare And Research Business Valuation Pharmaceutical Company Financial Summary Portrait PDF a try. Our experts have put a lot of knowledge and effort into creating this impeccable Healthcare And Research Business Valuation Pharmaceutical Company Financial Summary Portrait PDF. You can use this template for your upcoming presentations, as the slides are perfect to represent even the tiniest detail. You can download these templates from the Slidegeeks website and these are easy to edit. So grab these today.

Food Company Financial Performance Summary Food Business Firm Valuation Ratios Designs PDF
The following slide highlights the valuation ratio of the Food company to assess the organizations worth on the basis of share price, sales, and market capitalization, Key ratios included are enterprise value, EV per net sales, price to book value, market cap per sales, retention ratio and Earnings yield. Get a simple yet stunning designed Food Company Financial Performance Summary Food Business Firm Valuation Ratios Designs PDF. It is the best one to establish the tone in your meetings. It is an excellent way to make your presentations highly effective. So, download this PPT today from Slidegeeks and see the positive impacts. Our easy-to-edit Food Company Financial Performance Summary Food Business Firm Valuation Ratios Designs PDF can be your go-to option for all upcoming conferences and meetings. So, what are you waiting for Grab this template today.

Deploying And Managing Recurring Key Metrices For Revenue Model Pictures PDF
The purpose of the following slide is to compare various revenue models based on different metrices such as Annual recurring revenue, Average revenue per unit, customer conversion rate, customer net profitability and customer churn rate. Find highly impressive Deploying And Managing Recurring Key Metrices For Revenue Model Pictures PDF on Slidegeeks to deliver a meaningful presentation. You can save an ample amount of time using these presentation templates. No need to worry to prepare everything from scratch because Slidegeeks experts have already done a huge research and work for you. You need to download Deploying And Managing Recurring Key Metrices For Revenue Model Pictures PDF for your upcoming presentation. All the presentation templates are 100 percent editable and you can change the color and personalize the content accordingly. Download now.

Consumption Based Pricing Model Key Metrices For Revenue Model Elements PDF
The purpose of the following slide is to compare various revenue models based on different metrices such as annual recurring revenue, average revenue per unit, customer conversion rate, customer net profitability and customer churn rate. This modern and well arranged Consumption Based Pricing Model Key Metrices For Forecasting In Recurring Revenue Model Clipart PDF provides lots of creative possibilities. It is very simple to customize and edit with the Powerpoint Software. Just drag and drop your pictures into the shapes. All facets of this template can be edited with Powerpoint no extra software is necessary. Add your own material, put your images in the places assigned for them, adjust the colors, and then you can show your slides to the world, with an animated slide included.
Web Interface Development Services Company Summary Financial Comparison With Icons PDF
This slide covers the comparison with competitors on the basis of financials such as annual revenue, net profit, operating profits, EBITDA, market share and total projects completed in 2023. Whether you have daily or monthly meetings, a brilliant presentation is necessary. Web Interface Development Services Company Summary Financial Comparison With Icons PDF can be your best option for delivering a presentation. Represent everything in detail using Web Interface Development Services Company Summary Financial Comparison With Icons PDF and make yourself stand out in meetings. The template is versatile and follows a structure that will cater to your requirements. All the templates prepared by Slidegeeks are easy to download and edit. Our research experts have taken care of the corporate themes as well. So, give it a try and see the results.
Retail Business Optimization Through Operational Excellence Strategy Comparing Business Growth Over Icons PDF
Following slide portrays informational statistics about business growth over the last two years. It covers details about revenues, operating profit and net profit. Get a simple yet stunning designed Retail Business Optimization Through Operational Excellence Strategy Comparing Business Growth Over Icons PDF. It is the best one to establish the tone in your meetings. It is an excellent way to make your presentations highly effective. So, download this PPT today from Slidegeeks and see the positive impacts. Our easy to edit Retail Business Optimization Through Operational Excellence Strategy Comparing Business Growth Over Icons PDF can be your go to option for all upcoming conferences and meetings. So, what are you waiting for Grab this template today.

Criterion For Choosing Distribution Channel For Efficient Sales Administration Growth Analysis Based On Potential Inspiration PDF
This slide showcases the expected growth of company from new distribution channels. The growth is highlighted in terms of revenue numbers, net profit, customer base, products sold etc. Crafting an eye-catching presentation has never been more straightforward. Let your presentation shine with this tasteful yet straightforward Criterion For Choosing Distribution Channel For Efficient Sales Administration Growth Analysis Based On Potential Inspiration PDF template. It offers a minimalistic and classy look that is great for making a statement. The colors have been employed intelligently to add a bit of playfulness while still remaining professional. Construct the ideal Criterion For Choosing Distribution Channel For Efficient Sales Administration Growth Analysis Based On Potential Inspiration PDF that effortlessly grabs the attention of your audience. Begin now and be certain to wow your customers.
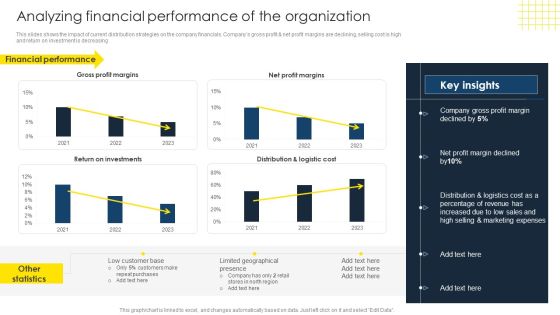
Optimize Business Sales Analyzing Financial Performance Of The Organization Structure PDF
This slides shows the impact of current distribution strategies on the company financials. Companys gross profit and net profit margins are declining, selling cost is high and return on investment is decreasing. Crafting an eye-catching presentation has never been more straightforward. Let your presentation shine with this tasteful yet straightforward Optimize Business Sales Analyzing Financial Performance Of The Organization Structure PDF template. It offers a minimalistic and classy look that is great for making a statement. The colors have been employed intelligently to add a bit of playfulness while still remaining professional. Construct the ideal Optimize Business Sales Analyzing Financial Performance Of The Organization Structure PDF that effortlessly grabs the attention of your audience Begin now and be certain to wow your customers.

Kpis To Track Impact Of Ecommerce Website Sales Growth Strategies Pictures PDF
This slide showcases KPIs that can help organization to track the impact of sales growth strategies on ecommerce website. It includes conversion rate, net profit, customer retention rate, average order value, number of orders, cart abandonment rate etc. Present like a pro with Kpis To Track Impact Of Ecommerce Website Sales Growth Strategies Pictures PDF Create beautiful presentations together with your team, using our easy to use presentation slides. Share your ideas in real time and make changes on the fly by downloading our templates. So whether you are in the office, on the go, or in a remote location, you can stay in sync with your team and present your ideas with confidence. With Slidegeeks presentation got a whole lot easier. Grab these presentations today.
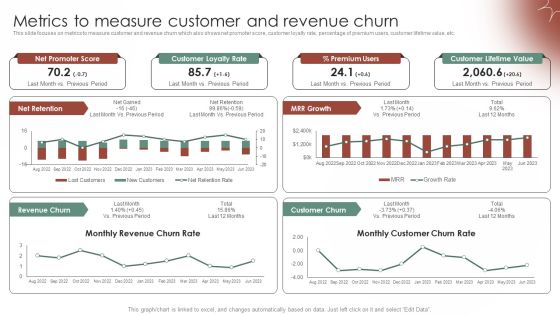
Tactical Communication Plan Metrics To Measure Customer And Revenue Churn Demonstration PDF
This slide focuses on metrics to measure customer and revenue churn which also shows net promoter score, customer loyalty rate, percentage of premium users, customer lifetime value, etc. Presenting this PowerPoint presentation, titled Tactical Communication Plan Metrics To Measure Customer And Revenue Churn Demonstration PDF, with topics curated by our researchers after extensive research. This editable presentation is available for immediate download and provides attractive features when used. Download now and captivate your audience. Presenting this Tactical Communication Plan Metrics To Measure Customer And Revenue Churn Demonstration PDF. Our researchers have carefully researched and created these slides with all aspects taken into consideration. This is a completely customizable Tactical Communication Plan Metrics To Measure Customer And Revenue Churn Demonstration PDF that is available for immediate downloading. Download now and make an impact on your audience. Highlight the attractive features available with our PPTs.

Boosting Customer Base Through Effective Metrics To Measure Customer And Revenue Themes PDF
This slide focuses on metrics to measure customer and revenue churn which also shows net promoter score, customer loyalty rate, percentage of premium users, customer lifetime value, etc. Crafting an eye-catching presentation has never been more straightforward. Let your presentation shine with this tasteful yet straightforward Boosting Customer Base Through Effective Metrics To Measure Customer And Revenue Themes PDF template. It offers a minimalistic and classy look that is great for making a statement. The colors have been employed intelligently to add a bit of playfulness while still remaining professional. Construct the ideal Boosting Customer Base Through Effective Metrics To Measure Customer And Revenue Themes PDF that effortlessly grabs the attention of your audience Begin now and be certain to wow your customers.

Stock Market Research Report Review And Rating Market Capitalization Elements PDF
The purpose of the following slide is to show the review and ratings of the company provided by the analyst. The table highlights P or E ratio, valuation score, Net profit. The table also provides weightage average of the same. This is a stock market research report review and rating market capitalization elements pdf template with various stages. Focus and dispense information on one stages using this creative set, that comes with editable features. It contains large content boxes to add your information on topics like profit to equity ratio, profit to book value ratio, valuation score, market capitalization, operating revenue. You can also showcase facts, figures, and other relevant content using this PPT layout. Grab it now.

Enhancing Client Engagement Metrics To Measure Customer And Revenue Churn Formats PDF
This slide focuses on metrics to measure customer and revenue churn which also shows net promoter score, customer loyalty rate, percentage of premium users, customer lifetime value, etc. Are you in need of a template that can accommodate all of your creative concepts This one is crafted professionally and can be altered to fit any style. Use it with Google Slides or PowerPoint. Include striking photographs, symbols, depictions, and other visuals. Fill, move around, or remove text boxes as desired. Test out color palettes and font mixtures. Edit and save your work, or work with colleagues. Download Enhancing Client Engagement Metrics To Measure Customer And Revenue Churn Formats PDF and observe how to make your presentation outstanding. Give an impeccable presentation to your group and make your presentation unforgettable.

BI Technique For Data Informed Decisions Sap Analytics Cloud Dashboard For Product Sales Analysis Sample PDF
This slide illustrates the SAP Analytics Cloud dashboard to monitor product sales performance. It provides information regarding the gross margin and net revenue earned, product performance state wise and year wise. Welcome to our selection of the Budget Plan For BI Technique For Data Informed Decisions Clipart PDF. These are designed to help you showcase your creativity and bring your sphere to life. Planning and Innovation are essential for any business that is just starting out. This collection contains the designs that you need for your everyday presentations. All of our PowerPoints are 100 percent editable, so you can customize them to suit your needs. This multi purpose template can be used in various situations. Grab these presentation templates today.
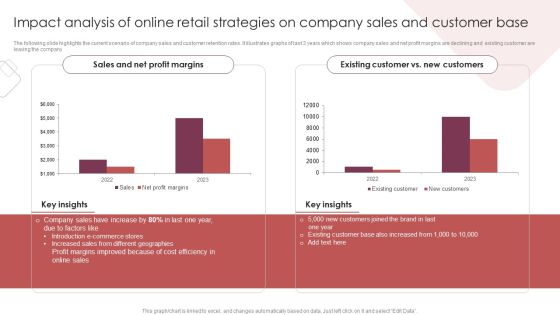
E Commerce Marketing Techniques To Boost Sales Impact Analysis Of Online Retail Strategies On Company Sales And Customer Base Slides PDF
The following slide highlights the current scenario of company sales and customer retention rates. It illustrates graphs of last 3 years which shows company sales and net profit margins are declining and existing customer are leaving the company. Explore a selection of the finest E Commerce Marketing Techniques To Boost Sales Impact Analysis Of Online Retail Strategies On Company Sales And Customer Base Slides PDF here. With a plethora of professionally designed and pre-made slide templates, you can quickly and easily find the right one for your upcoming presentation. You can use our E Commerce Marketing Techniques To Boost Sales Impact Analysis Of Online Retail Strategies On Company Sales And Customer Base Slides PDF to effectively convey your message to a wider audience. Slidegeeks has done a lot of research before preparing these presentation templates. The content can be personalized and the slides are highly editable. Grab templates today from Slidegeeks.

Capital Financing Pitch Deck For Cryptocurrency Business Financials Projections For Cryptocurrency Business Elements PDF
This slide illustrates statistical projections about the key financials of the company such as annual turnover, average bank transfer, net revenue, gross profit etc. Are you in need of a template that can accommodate all of your creative concepts This one is crafted professionally and can be altered to fit any style. Use it with Google Slides or PowerPoint. Include striking photographs, symbols, depictions, and other visuals. Fill, move around, or remove text boxes as desired. Test out color palettes and font mixtures. Edit and save your work, or work with colleagues. Download Capital Financing Pitch Deck For Cryptocurrency Business Financials Projections For Cryptocurrency Business Elements PDF and observe how to make your presentation outstanding. Give an impeccable presentation to your group and make your presentation unforgettable.
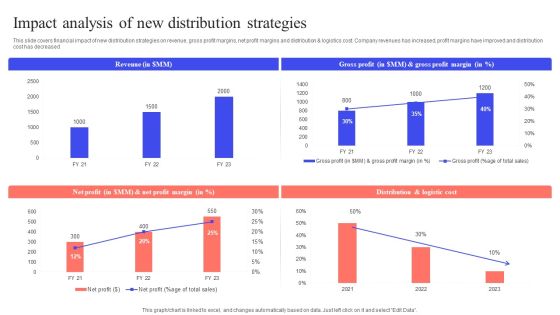
Implementing Effective Distribution Impact Analysis Of New Distribution Strategies Information PDF
This slide covers financial impact of new distribution strategies on revenue, gross profit margins, net profit margins and distribution AND logistics cost. Company revenues has increased, profit margins have improved and distribution cost has decreased. Do you know about Slidesgeeks Implementing Effective Distribution Impact Analysis Of New Distribution Strategies Information PDF These are perfect for delivering any kind od presentation. Using it, create PowerPoint presentations that communicate your ideas and engage audiences. Save time and effort by using our pre-designed presentation templates that are perfect for a wide range of topic. Our vast selection of designs covers a range of styles, from creative to business, and are all highly customizable and easy to edit. Download as a PowerPoint template or use them as Google Slides themes.

Omnichannel Distribution System To Satisfy Customer Needs Impact Analysis Of New Distribution Strategies Ideas PDF
This slide covers financial impact of new distribution strategies on revenue, gross profit margins, net profit margins and distribution and logistics cost. Company revenues has increased, profit margins have improved and distribution cost has decreased. Coming up with a presentation necessitates that the majority of the effort goes into the content and the message you intend to convey. The visuals of a PowerPoint presentation can only be effective if it supplements and supports the story that is being told. Keeping this in mind our experts created Omnichannel Distribution System To Satisfy Customer Needs Impact Analysis Of New Distribution Strategies Ideas PDF to reduce the time that goes into designing the presentation. This way, you can concentrate on the message while our designers take care of providing you with the right template for the situation.
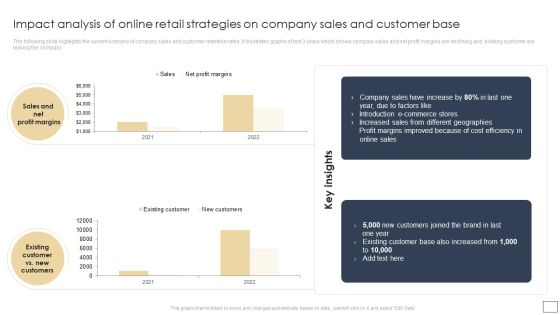
Impact Analysis Of Online Retail Strategies On Company Sales And Customer Base Slides PDF
The following slide highlights the current scenario of company sales and customer retention rates. It illustrates graphs of last 3 years which shows company sales and net profit margins are declining and existing customer are leaving the company. Do you have an important presentation coming up Are you looking for something that will make your presentation stand out from the rest Look no further than Impact Analysis Of Online Retail Strategies On Company Sales And Customer Base Slides PDF. With our professional designs, you can trust that your presentation will pop and make delivering it a smooth process. And with Slidegeeks, you can trust that your presentation will be unique and memorable. So why wait Grab Impact Analysis Of Online Retail Strategies On Company Sales And Customer Base Slides PDF today and make your presentation stand out from the rest.

Impact Analysis Of Online Retail Strategies On Company Sales And Customer Base Pictures PDF
The following slide highlights the current scenario of company sales and customer retention rates. It illustrates graphs of last 3 years which shows company sales and net profit margins are declining and existing customer are leaving the company. If you are looking for a format to display your unique thoughts, then the professionally designed Impact Analysis Of Online Retail Strategies On Company Sales And Customer Base Pictures PDF is the one for you. You can use it as a Google Slides template or a PowerPoint template. Incorporate impressive visuals, symbols, images, and other charts. Modify or reorganize the text boxes as you desire. Experiment with shade schemes and font pairings. Alter, share or cooperate with other people on your work. Download Impact Analysis Of Online Retail Strategies On Company Sales And Customer Base Pictures PDF and find out how to give a successful presentation. Present a perfect display to your team and make your presentation unforgettable.

Customer Engagement Methods For Online Platforms Analyzing Companys Current Sales Ideas PDF
The following slide highlights the current scenario of company sales and customer retention rates. It illustrates graphs of last 3 years which shows company sales and net profit margins are declining and existing customer are leaving the company. Present like a pro with Customer Engagement Methods For Online Platforms Analyzing Companys Current Sales Ideas PDF Create beautiful presentations together with your team, using our easy to use presentation slides. Share your ideas in real time and make changes on the fly by downloading our templates. So whether youre in the office, on the go, or in a remote location, you can stay in sync with your team and present your ideas with confidence. With Slidegeeks presentation got a whole lot easier. Grab these presentations today.
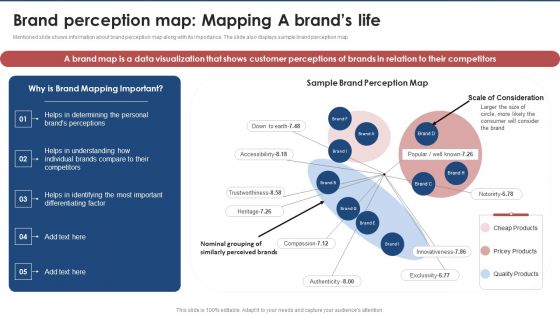
Brand Perception Map Mapping A Brands Life Brand Value Estimation Guide Formats PDF
Mentioned slide displays overview about brand health covering its definition along with key performance metrics such as net promoter score, customer satisfaction score and share of voice. Slidegeeks is here to make your presentations a breeze with Brand Perception Map Mapping A Brands Life Brand Value Estimation Guide Formats PDF With our easy-to-use and customizable templates, you can focus on delivering your ideas rather than worrying about formatting. With a variety of designs to choose from, you are sure to find one that suits your needs. And with animations and unique photos, illustrations, and fonts, you can make your presentation pop. So whether you are giving a sales pitch or presenting to the board, make sure to check out Slidegeeks first.

BI Technique For Data Informed Decisions Financial Performance Of Organization Guidelines PDF
This slide visually present the financial performance of organization in terms of revenue, gross and net profit and earnings per share with key insights. If you are looking for a format to display your unique thoughts, then the professionally designed BI Technique For Data Informed Decisions Financial Performance Of Organization Guidelines PDF is the one for you. You can use it as a Google Slides template or a PowerPoint template. Incorporate impressive visuals, symbols, images, and other charts. Modify or reorganize the text boxes as you desire. Experiment with shade schemes and font pairings. Alter, share or cooperate with other people on your work. Download BI Technique For Data Informed Decisions Financial Performance Of Organization Guidelines PDF and find out how to give a successful presentation. Present a perfect display to your team and make your presentation unforgettable.
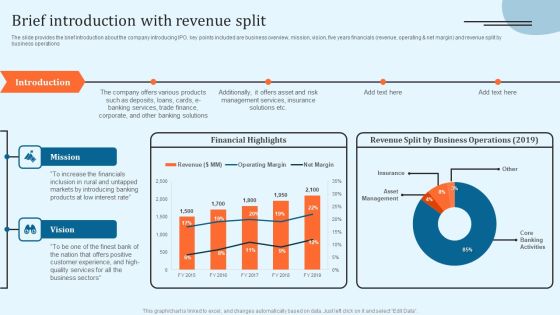
Equity Debt And Convertible Bond Investment Banking Pitch Book Brief Introduction With Revenue Split Structure PDF
The slide provides the brief introduction about the company introducing IPO. key points included are business overview, mission, vision, five years financials revenue, operating and net margin and revenue split by business operations, Presenting this PowerPoint presentation, titled Equity Debt And Convertible Bond Investment Banking Pitch Book Brief Introduction With Revenue Split Structure PDF, with topics curated by our researchers after extensive research. This editable presentation is available for immediate download and provides attractive features when used. Download now and captivate your audience. Presenting this Equity Debt And Convertible Bond Investment Banking Pitch Book Brief Introduction With Revenue Split Structure PDF. Our researchers have carefully researched and created these slides with all aspects taken into consideration. This is a completely customizable Equity Debt And Convertible Bond Investment Banking Pitch Book Brief Introduction With Revenue Split Structure PDF that is available for immediate downloading. Download now and make an impact on your audience. Highlight the attractive features available with our PPTs.

Grow Capital Through Equity Debt Brief Introduction With Revenue Split Background PDF
The slide provides the brief introduction about the company introducing IPO. key points included are business overview, mission, vision, five years financials revenue, operating net margin and revenue split by business operations.Retrieve professionally designed Grow Capital Through Equity Debt Brief Introduction With Revenue Split Background PDF to effectively convey your message and captivate your listeners. Save time by selecting pre-made slideshows that are appropriate for various topics, from business to educational purposes. These themes come in many different styles, from creative to corporate, and all of them are easily adjustable and can be edited quickly. Access them as PowerPoint templates or as Google Slides themes. You do not have to go on a hunt for the perfect presentation because Slidegeeks got you covered from everywhere.
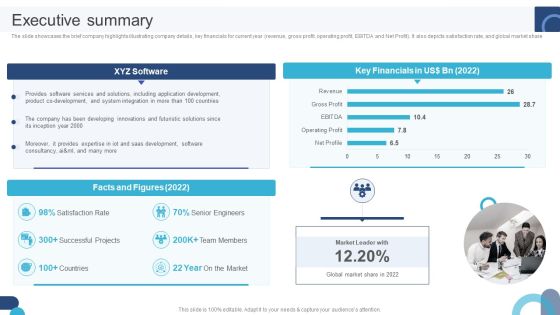
Digital Application Software Development Business Profile Executive Summary Structure PDF
The slide showcases the brief company highlights illustrating company details, key financials for current year revenue, gross profit, operating profit, EBITDA and Net Profit. It also depicts satisfaction rate, and global market share. If you are looking for a format to display your unique thoughts, then the professionally designed Digital Application Software Development Business Profile Executive Summary Structure PDF is the one for you. You can use it as a Google Slides template or a PowerPoint template. Incorporate impressive visuals, symbols, images, and other charts. Modify or reorganize the text boxes as you desire. Experiment with shade schemes and font pairings. Alter, share or cooperate with other people on your work. Download Digital Application Software Development Business Profile Executive Summary Structure PDF and find out how to give a successful presentation. Present a perfect display to your team and make your presentation unforgettable.

Digital Products Company Outline Executive Summary Designs PDF
The slide showcases the brief company highlights illustrating company details, key financials for current year revenue, gross profit, operating profit, EBITDA and Net Profit. It also depicts satisfaction rate, and global market share. Do you know about Slidesgeeks Digital Products Company Outline Executive Summary Designs PDF These are perfect for delivering any kind od presentation. Using it, create PowerPoint presentations that communicate your ideas and engage audiences. Save time and effort by using our pre designed presentation templates that are perfect for a wide range of topic. Our vast selection of designs covers a range of styles, from creative to business, and are all highly customizable and easy to edit. Download as a PowerPoint template or use them as Google Slides themes.
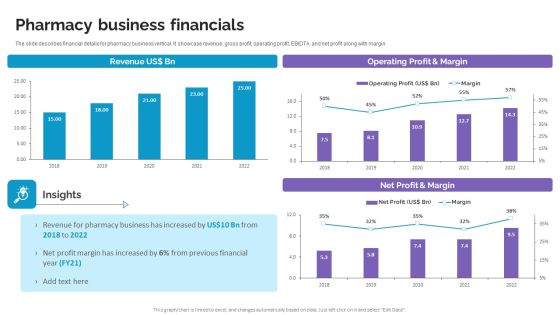
Pharmacy Business Financials Life Science And Healthcare Solutions Company Profile Sample PDF
The slide describes financial details for pharmacy business vertical. It showcase revenue, gross profit, operating profit, EBIDTA and net profit along with margin. Find highly impressive Pharmacy Business Financials Life Science And Healthcare Solutions Company Profile Sample PDF on Slidegeeks to deliver a meaningful presentation. You can save an ample amount of time using these presentation templates. No need to worry to prepare everything from scratch because Slidegeeks experts have already done a huge research and work for you. You need to download Pharmacy Business Financials Life Science And Healthcare Solutions Company Profile Sample PDF for your upcoming presentation. All the presentation templates are 100 percent editable and you can change the color and personalize the content accordingly. Download now.
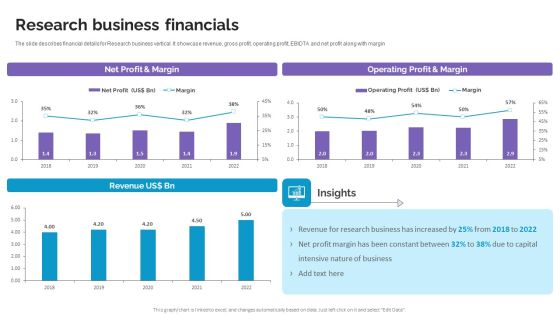
Research Business Financials Life Science And Healthcare Solutions Company Profile Information PDF
The slide describes financial details for Research business vertical. It showcase revenue, gross profit, operating profit, EBIDTA and net profit along with margin. If you are looking for a format to display your unique thoughts, then the professionally designed Research Business Financials Life Science And Healthcare Solutions Company Profile Information PDF is the one for you. You can use it as a Google Slides template or a PowerPoint template. Incorporate impressive visuals, symbols, images, and other charts. Modify or reorganize the text boxes as you desire. Experiment with shade schemes and font pairings. Alter, share or cooperate with other people on your work. Download Research Business Financials Life Science And Healthcare Solutions Company Profile Information PDF and find out how to give a successful presentation. Present a perfect display to your team and make your presentation unforgettable.

Consumption Based Pricing Model Our Financial Performance Over The Year Elements PDF
The purpose of the following slide is to analyze the financial performance of the organization. The provided graph highlight the revenues, gross profit and net profit margin of the organization for the year 2016,17,18 and 19. This Consumption Based Pricing Model Key Metrices For Forecasting In Recurring Revenue Model Clipart PDF is perfect for any presentation, be it in front of clients or colleagues. It is a versatile and stylish solution for organizing your meetings. The Consumption Based Pricing Model Key Metrices For Forecasting In Recurring Revenue Model Clipart PDF features a modern design for your presentation meetings. The adjustable and customizable slides provide unlimited possibilities for acing up your presentation. Slidegeeks has done all the homework before launching the product for you. So, do not wait, grab the presentation templates today

Financial Comparison With Competitors Web Design And Development Company Profile Topics PDF
This slide covers the comparison with competitors on the basis of financials such as annual revenue, net profit, operating profits, EBITDA, market share and total projects completed in 2022 Slidegeeks is here to make your presentations a breeze with Financial Comparison With Competitors Web Design And Development Company Profile Topics PDF With our easy to use and customizable templates, you can focus on delivering your ideas rather than worrying about formatting. With a variety of designs to choose from, youre sure to find one that suits your needs. And with animations and unique photos, illustrations, and fonts, you can make your presentation pop. So whether you our giving a sales pitch or presenting to the board, make sure to check out Slidegeeks first.
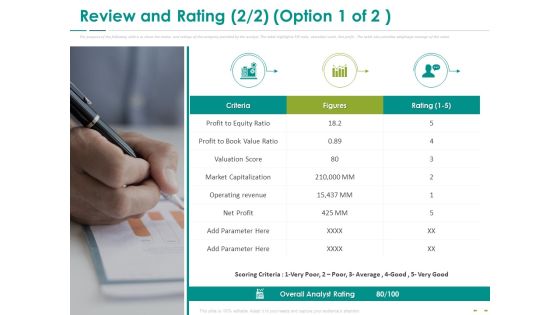
Stock Market Research Report Review And Rating Equity Ratio Ppt PowerPoint Presentation File Inspiration PDF
The purpose of the following slide is to show the review and ratings of the company provided by the analyst. The table highlights P or E ratio, valuation score, Net profit. The table also provides weightage average of the same. This is a stock market research report review and rating equity ratio ppt powerpoint presentation file inspiration pdf template with various stages. Focus and dispense information on one stages using this creative set, that comes with editable features. It contains large content boxes to add your information on topics like profit to equity ratio, profit to book value ratio, valuation score, market capitalization. You can also showcase facts, figures, and other relevant content using this PPT layout. Grab it now.
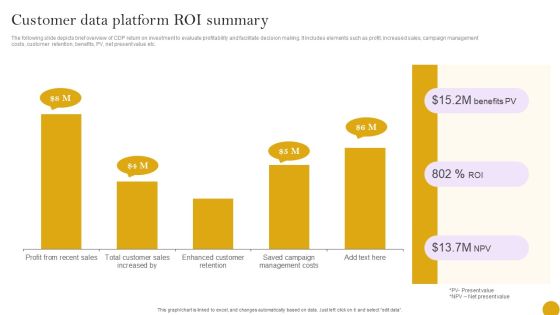
Comprehensive Customer Data Platform Guide Optimizing Promotional Initiatives Customer Data Platform ROI Summary Inspiration PDF
The following slide depicts brief overview of CDP return on investment to evaluate profitability and facilitate decision making. It includes elements such as profit, increased sales, campaign management costs, customer retention, benefits, PV, net present value etc. This Comprehensive Customer Data Platform Guide Optimizing Promotional Initiatives Customer Data Platform ROI Summary Inspiration PDF is perfect for any presentation, be it in front of clients or colleagues. It is a versatile and stylish solution for organizing your meetings. The Comprehensive Customer Data Platform Guide Optimizing Promotional Initiatives Customer Data Platform ROI Summary Inspiration PDF features a modern design for your presentation meetings. The adjustable and customizable slides provide unlimited possibilities for acing up your presentation. Slidegeeks has done all the homework before launching the product for you. So, do not wait, grab the presentation templates today
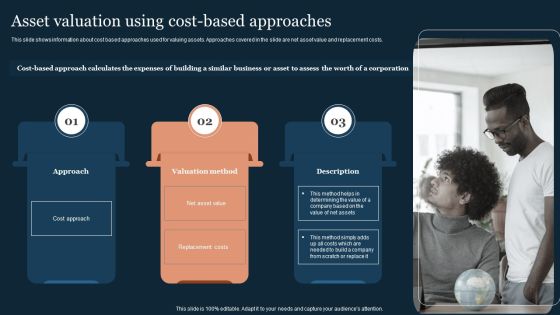
Guide To Develop And Estimate Brand Value Asset Valuation Using Costbased Approaches Mockup PDF
This slide shows information about cost based approaches used for valuing assets. Approaches covered in the slide are net asset value and replacement costs.Do you have to make sure that everyone on your team knows about any specific topic I yes, then you should give Guide To Develop And Estimate Brand Value Asset Valuation Using Costbased Approaches Mockup PDF a try. Our experts have put a lot of knowledge and effort into creating this impeccable Guide To Develop And Estimate Brand Value Asset Valuation Using Costbased Approaches Mockup PDF. You can use this template for your upcoming presentations, as the slides are perfect to represent even the tiniest detail. You can download these templates from the Slidegeeks website and these are easy to edit. So grab these today.
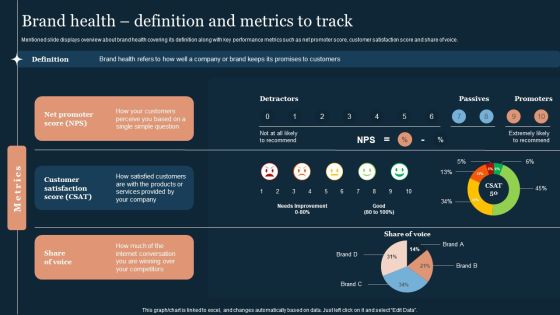
Guide To Develop And Estimate Brand Value Brand Health Definition And Metrics To Track Elements PDF
Mentioned slide displays overview about brand health covering its definition along with key performance metrics such as net promoter score, customer satisfaction score and share of voice.Whether you have daily or monthly meetings, a brilliant presentation is necessary. Guide To Develop And Estimate Brand Value Brand Health Definition And Metrics To Track Elements PDF can be your best option for delivering a presentation. Represent everything in detail using Guide To Develop And Estimate Brand Value Brand Health Definition And Metrics To Track Elements PDF and make yourself stand out in meetings. The template is versatile and follows a structure that will cater to your requirements. All the templates prepared by Slidegeeks are easy to download and edit. Our research experts have taken care of the corporate themes as well. So, give it a try and see the results.

Standalone Financial Ratios Of Ecommerce Website Brochure PDF
This slide showcases standalone financial ratios of ecommerce websites. It provides information about net profit margin, return on capital, return on assets, quick ratio, inventory turnover ratio, operational expenses, etc. Retrieve professionally designed Standalone Financial Ratios Of Ecommerce Website Brochure PDF to effectively convey your message and captivate your listeners. Save time by selecting pre made slideshows that are appropriate for various topics, from business to educational purposes. These themes come in many different styles, from creative to corporate, and all of them are easily adjustable and can be edited quickly. Access them as PowerPoint templates or as Google Slides themes. You don not have to go on a hunt for the perfect presentation because Slidegeeks got you covered from everywhere.

Standalone Financial Ratios Of Ecommerce Website Financial Management Strategies Designs PDF
This slide showcases standalone financial ratios of ecommerce websites. It provides information about net profit margin, return on capital, return on assets, quick ratio, inventory turnover ratio, operational expenses, etc. Retrieve professionally designed Standalone Financial Ratios Of Ecommerce Website Financial Management Strategies Designs PDF to effectively convey your message and captivate your listeners. Save time by selecting pre-made slideshows that are appropriate for various topics, from business to educational purposes. These themes come in many different styles, from creative to corporate, and all of them are easily adjustable and can be edited quickly. Access them as PowerPoint templates or as Google Slides themes. You do not have to go on a hunt for the perfect presentation because Slidegeeks got you covered from everywhere.
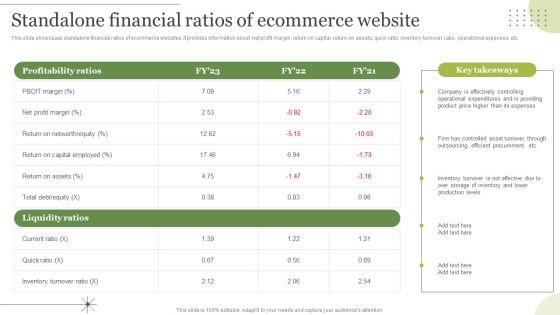
Managing E Commerce Business Accounting Standalone Financial Ratios Of Ecommerce Website Brochure PDF
This slide showcases standalone financial ratios of ecommerce websites. It provides information about net profit margin, return on capital, return on assets, quick ratio, inventory turnover ratio, operational expenses, etc. Do you know about Slidesgeeks Managing E Commerce Business Accounting Standalone Financial Ratios Of Ecommerce Website Brochure PDF These are perfect for delivering any kind od presentation. Using it, create PowerPoint presentations that communicate your ideas and engage audiences. Save time and effort by using our pre designed presentation templates that are perfect for a wide range of topic. Our vast selection of designs covers a range of styles, from creative to business, and are all highly customizable and easy to edit. Download as a PowerPoint template or use them as Google Slides themes.
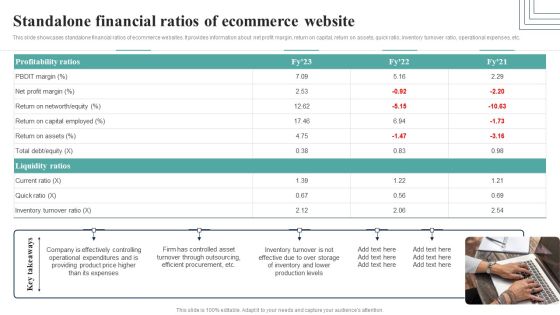
How Electronic Commerce Financial Procedure Can Be Enhanced Standalone Financial Ratios Of Ecommerce Website Template PDF
This slide showcases standalone financial ratios of ecommerce websites. It provides information about net profit margin, return on capital, return on assets, quick ratio, inventory turnover ratio, operational expenses, etc. The How Electronic Commerce Financial Procedure Can Be Enhanced Standalone Financial Ratios Of Ecommerce Website Template PDF is a compilation of the most recent design trends as a series of slides. It is suitable for any subject or industry presentation, containing attractive visuals and photo spots for businesses to clearly express their messages. This template contains a variety of slides for the user to input data, such as structures to contrast two elements, bullet points, and slides for written information. Slidegeeks is prepared to create an impression.

Creating Employee Value Proposition Employee Satisfaction Score Monitoring Dashboard Sample PDF
This slide showcases a dashboard presenting various metrics to measure and analyze employee overall satisfaction rate. It outlines information of employee net promoter score, employee retention and employee absenteeism. Do you know about Slidesgeeks Creating Employee Value Proposition Employee Satisfaction Score Monitoring Dashboard Sample PDF These are perfect for delivering any kind od presentation. Using it, create PowerPoint presentations that communicate your ideas and engage audiences. Save time and effort by using our pre-designed presentation templates that are perfect for a wide range of topic. Our vast selection of designs covers a range of styles, from creative to business, and are all highly customizable and easy to edit. Download as a PowerPoint template or use them as Google Slides themes.

Comparative Analysis Of Major Players In Global Automotive Industry Slides PDF
This slide covers a comparative assessment of key manufacturers of the worldwide automobile industry. It includes comparison on basis of founding date, type, locations, employees, valuation, revenue, cost of goods, gross profit, net profit, etc. Presenting this PowerPoint presentation, titled Comparative Analysis Of Major Players In Global Automotive Industry Slides PDF, with topics curated by our researchers after extensive research. This editable presentation is available for immediate download and provides attractive features when used. Download now and captivate your audience. Presenting this Comparative Analysis Of Major Players In Global Automotive Industry Slides PDF. Our researchers have carefully researched and created these slides with all aspects taken into consideration. This is a completely customizable Comparative Analysis Of Major Players In Global Automotive Industry Slides PDF that is available for immediate downloading. Download now and make an impact on your audience. Highlight the attractive features available with our PPTs.

Year Over Year Business Performance Comparison Strategic Promotion Plan Pictures PDF
Mentioned slide provides informational statistics showcasing annual business growth. It includes details about revenues, operating profit as well as net profit. Are you in need of a template that can accommodate all of your creative concepts This one is crafted professionally and can be altered to fit any style. Use it with Google Slides or PowerPoint. Include striking photographs, symbols, depictions, and other visuals. Fill, move around, or remove text boxes as desired. Test out color palettes and font mixtures. Edit and save your work, or work with colleagues. Download Year Over Year Business Performance Comparison Strategic Promotion Plan Pictures PDF and observe how to make your presentation outstanding. Give an impeccable presentation to your group and make your presentation unforgettable.
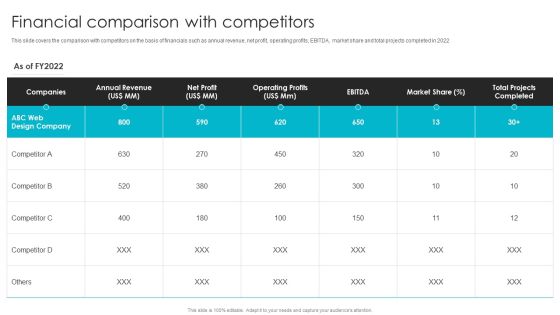
Web Design Company Overview Financial Comparison With Competitors Pictures PDF
This slide covers the comparison with competitors on the basis of financials such as annual revenue, net profit, operating profits, EBITDA, market share and total projects completed in 2022 Crafting an eye catching presentation has never been more straightforward. Let your presentation shine with this tasteful yet straightforward Web Design Company Overview Financial Comparison With Competitors Pictures PDF template. It offers a minimalistic and classy look that is great for making a statement. The colors have been employed intelligently to add a bit of playfulness while still remaining professional. Construct the ideal Web Design Company Overview Financial Comparison With Competitors Pictures PDF that effortlessly grabs the attention of your audience Begin now and be certain to wow your customers.
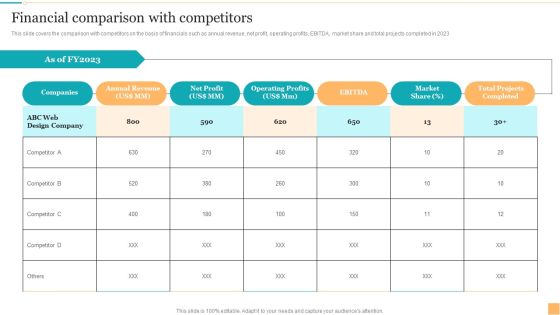
Website Design And Branding Studio Company Profile Financial Comparison With Competitors Formats PDF
This slide covers the comparison with competitors on the basis of financials such as annual revenue, net profit, operating profits, EBITDA, market share and total projects completed in 2023. Do you have an important presentation coming up Are you looking for something that will make your presentation stand out from the rest Look no further than Website Design And Branding Studio Company Profile Financial Comparison With Competitors Formats PDF. With our professional designs, you can trust that your presentation will pop and make delivering it a smooth process. And with Slidegeeks, you can trust that your presentation will be unique and memorable. So why wait Grab Website Design And Branding Studio Company Profile Financial Comparison With Competitors Formats PDF today and make your presentation stand out from the rest.

Assessing Debt And Equity Fundraising Alternatives For Business Growth Financial KPI Dashboard To Evaluate Infographics PDF
This slide showcases dashboard that can help organization to evaluate key changes in financial kpis post fundraising. Its key components are net profit margin, revenue, gross profit margin, debt to equity and return on equity. This Assessing Debt And Equity Fundraising Alternatives For Business Growth Financial KPI Dashboard To Evaluate Infographics PDF is perfect for any presentation, be it in front of clients or colleagues. It is a versatile and stylish solution for organizing your meetings. TheAssessing Debt And Equity Fundraising Alternatives For Business Growth Financial KPI Dashboard To Evaluate Infographics PDF features a modern design for your presentation meetings. The adjustable and customizable slides provide unlimited possibilities for acing up your presentation. Slidegeeks has done all the homework before launching the product for you. So, do not wait, grab the presentation templates today

BPR To Develop Operational Effectiveness Dashboard To Measure Business Financial Performance Elements PDF
This slide shows the dashboard to measure business financial performance which focuses on revenues, debt to equity, net profit margin, gross profit margin and return on equity. Coming up with a presentation necessitates that the majority of the effort goes into the content and the message you intend to convey. The visuals of a PowerPoint presentation can only be effective if it supplements and supports the story that is being told. Keeping this in mind our experts created BPR To Develop Operational Effectiveness Dashboard To Measure Business Financial Performance Elements PDF to reduce the time that goes into designing the presentation. This way, you can concentrate on the message while our designers take care of providing you with the right template for the situation.
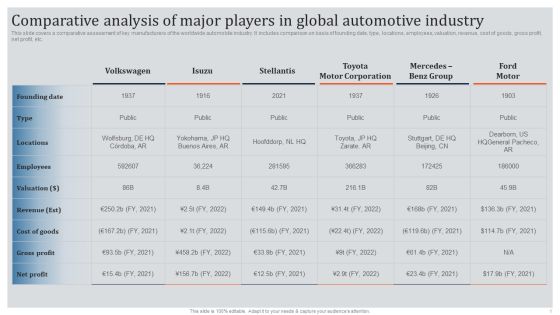
Global Automotive Industry Research And Analysis Comparative Analysis Of Major Players In Global Automotive Industry Designs PDF
This slide covers a comparative assessment of key manufacturers of the worldwide automobile industry. It includes comparison on basis of founding date, type, locations, employees, valuation, revenue, cost of goods, gross profit, net profit, etc. Boost your pitch with our creative Global Automotive Industry Research And Analysis Comparative Analysis Of Major Players In Global Automotive Industry Designs PDF. Deliver an awe inspiring pitch that will mesmerize everyone. Using these presentation templates you will surely catch everyones attention. You can browse the ppts collection on our website. We have researchers who are experts at creating the right content for the templates. So you do not have to invest time in any additional work. Just grab the template now and use them.

Dashboard To Measure Business Financial Performance Summary PDF
This slide shows the dashboard to measure business financial performance which focuses on revenues, debt to equity, net profit margin, gross profit margin and return on equity. Are you searching for a Dashboard To Measure Business Financial Performance Summary PDF that is uncluttered, straightforward, and original Its easy to edit, and you can change the colors to suit your personal or business branding. For a presentation that expresses how much effort youve put in, this template is ideal With all of its features, including tables, diagrams, statistics, and lists, its perfect for a business plan presentation. Make your ideas more appealing with these professional slides. Download Dashboard To Measure Business Financial Performance Summary PDF from Slidegeeks today.
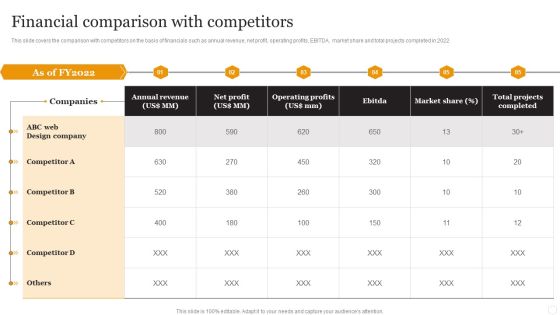
Website Designing Solutions Company Profile Financial Comparison With Competitors Template PDF
This slide covers the comparison with competitors on the basis of financials such as annual revenue, net profit, operating profits, EBITDA, market share and total projects completed in 2022. Crafting an eye-catching presentation has never been more straightforward. Let your presentation shine with this tasteful yet straightforward Website Designing Solutions Company Profile Financial Comparison With Competitors Template PDF template. It offers a minimalistic and classy look that is great for making a statement. The colors have been employed intelligently to add a bit of playfulness while still remaining professional. Construct the ideal Website Designing Solutions Company Profile Financial Comparison With Competitors Template PDF that effortlessly grabs the attention of your audience Begin now and be certain to wow your customers

Business Restructuring Process Dashboard To Measure Business Financial Performance Rules PDF
This slide shows the dashboard to measure business financial performance which focuses on revenues, debt to equity, net profit margin, gross profit margin and return on equity. If you are looking for a format to display your unique thoughts, then the professionally designed Business Restructuring Process Dashboard To Measure Business Financial Performance Rules PDF is the one for you. You can use it as a Google Slides template or a PowerPoint template. Incorporate impressive visuals, symbols, images, and other charts. Modify or reorganize the text boxes as you desire. Experiment with shade schemes and font pairings. Alter, share or cooperate with other people on your work. Download Business Restructuring Process Dashboard To Measure Business Financial Performance Rules PDF and find out how to give a successful presentation. Present a perfect display to your team and make your presentation unforgettable.

Deploying And Managing Recurring Our Financial Performance Over The Year Infographics PDF
The purpose of the following slide is to analyze the financial performance of the organization. The provided graph highlight the revenues, Gross profit and net profit margin of the organization for the year 2016,17,18 and 19. If you are looking for a format to display your unique thoughts, then the professionally designed Deploying And Managing Recurring Our Financial Performance Over The Year Infographics PDF is the one for you. You can use it as a Google Slides template or a PowerPoint template. Incorporate impressive visuals, symbols, images, and other charts. Modify or reorganize the text boxes as you desire. Experiment with shade schemes and font pairings. Alter, share or cooperate with other people on your work. Download Deploying And Managing Recurring Our Financial Performance Over The Year Infographics PDF and find out how to give a successful presentation. Present a perfect display to your team and make your presentation unforgettable.

Deployment Of Business Process Dashboard To Measure Business Financial Performance Microsoft PDF
This slide shows the dashboard to measure business financial performance which focuses on revenues, debt to equity, net profit margin, gross profit margin and return on equity. Do you have to make sure that everyone on your team knows about any specific topic I yes, then you should give Deployment Of Business Process Dashboard To Measure Business Financial Performance Microsoft PDF a try. Our experts have put a lot of knowledge and effort into creating this impeccable Deployment Of Business Process Dashboard To Measure Business Financial Performance Microsoft PDF. You can use this template for your upcoming presentations, as the slides are perfect to represent even the tiniest detail. You can download these templates from the Slidegeeks website and these are easy to edit. So grab these today.

Comparative Analysis Of Major Players In Global Automobile Market Analysis Topics PDF
This slide covers a comparative assessment of key manufacturers of the worldwide automobile industry. It includes comparison on basis of founding date, type, locations, employees, valuation, revenue, cost of goods, gross profit, net profit, etc. The Comparative Analysis Of Major Players In Global Automobile Market Analysis Topics PDF is a compilation of the most recent design trends as a series of slides. It is suitable for any subject or industry presentation, containing attractive visuals and photo spots for businesses to clearly express their messages. This template contains a variety of slides for the user to input data, such as structures to contrast two elements, bullet points, and slides for written information. Slidegeeks is prepared to create an impression.

Optimizing And Managing Retail Comparing Business Growth Over The Last Two Pictures PDF
Following slide portrays informational statistics about business growth over the last two years. It covers details about revenues, operating profit and net profit. Do you have to make sure that everyone on your team knows about any specific topic I yes, then you should give Optimizing And Managing Retail Comparing Business Growth Over The Last Two Pictures PDF a try. Our experts have put a lot of knowledge and effort into creating this impeccable Optimizing And Managing Retail Comparing Business Growth Over The Last Two Pictures PDF. You can use this template for your upcoming presentations, as the slides are perfect to represent even the tiniest detail. You can download these templates from the Slidegeeks website and these are easy to edit. So grab these today.

Website Design And Development Services Company Profile Financial Comparison With Competitors Diagrams PDF
This slide covers the comparison with competitors on the basis of financials such as annual revenue, net profit, operating profits, EBITDA, market total projects completed in 2022. Crafting an eye catching presentation has never been more straightforward. Let your presentation shine with this tasteful yet straightforward Website Design And Development Services Company Profile Financial Comparison With Competitors Diagrams PDF template. It offers a minimalistic and classy look that is great for making a statement. The colors have been employed intelligently to add a bit of playfulness while still remaining professional. Construct the ideal Website Design And Development Services Company Profile Financial Comparison With Competitors Diagrams PDF that effortlessly grabs the attention of your audience Begin now and be certain to wow your customers.
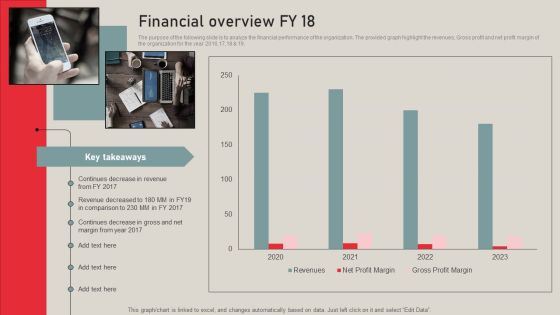
Individualized Pricing Approach For Managed Services Financial Overview FY 18 Structure PDF
The purpose of the following slide is to analyze the financial performance of the organization. The provided graph highlight the revenues, Gross profit and net profit margin of the organization for the year 2016,17,18 and 19. Create an editable Individualized Pricing Approach For Managed Services Financial Overview FY 18 Structure PDF that communicates your idea and engages your audience. Whether you are presenting a business or an educational presentation, pre designed presentation templates help save time. Individualized Pricing Approach For Managed Services Financial Overview FY 18 Structure PDF is highly customizable and very easy to edit, covering many different styles from creative to business presentations. Slidegeeks has creative team members who have crafted amazing templates. So, go and get them without any delay.

Tech Solution Company Elevator Pitch Deck Financial Projections Guidelines PDF
This slide caters to the details related to the forecast of companies future. It highlights revenue, cost of goods sold, net profit, operating profit, and CAGR Compound annual growth rate recorded which indicates positive performance and future growth potential. Coming up with a presentation necessitates that the majority of the effort goes into the content and the message you intend to convey. The visuals of a PowerPoint presentation can only be effective if it supplements and supports the story that is being told. Keeping this in mind our experts created Tech Solution Company Elevator Pitch Deck Financial Projections Guidelines PDF to reduce the time that goes into designing the presentation. This way, you can concentrate on the message while our designers take care of providing you with the right template for the situation.

Market Study Company Outline SWOT Analysis Introduction PDF
This slide highlights the Nielsen SWOT analysis which includes high revenue and reliable technology as strengths, low profitability and net profitability as weaknesses and high competition as threats. If you are looking for a format to display your unique thoughts, then the professionally designed Market Study Company Outline SWOT Analysis Introduction PDF is the one for you. You can use it as a Google Slides template or a PowerPoint template. Incorporate impressive visuals, symbols, images, and other charts. Modify or reorganize the text boxes as you desire. Experiment with shade schemes and font pairings. Alter, share or cooperate with other people on your work. Download Market Study Company Outline SWOT Analysis Introduction PDF and find out how to give a successful presentation. Present a perfect display to your team and make your presentation unforgettable.

Financial Kpi Dashboard To Evaluate Fundraising Impact Topics PDF
This slide showcases dashboard that can help organization to evaluate key changes in financial KPIs post fundraising. Its key components are net profit margin, revenue, gross profit margin, debt to equity and return on equity. Do you have to make sure that everyone on your team knows about any specific topic I yes, then you should give Financial Kpi Dashboard To Evaluate Fundraising Impact Topics PDF a try. Our experts have put a lot of knowledge and effort into creating this impeccable Financial Kpi Dashboard To Evaluate Fundraising Impact Topics PDF. You can use this template for your upcoming presentations, as the slides are perfect to represent even the tiniest detail. You can download these templates from the Slidegeeks website and these are easy to edit. So grab these today.
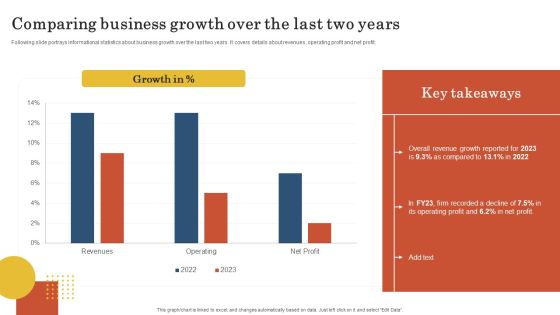
Retail Business Operation Management To Optimize Customer Experience Comparing Business Growth Over Brochure PDF
Following slide portrays informational statistics about business growth over the last two years. It covers details about revenues, operating profit and net profit. Get a simple yet stunning designed Retail Business Operation Management To Optimize Customer Experience Comparing Business Growth Over Brochure PDF. It is the best one to establish the tone in your meetings. It is an excellent way to make your presentations highly effective. So, download this PPT today from Slidegeeks and see the positive impacts. Our easy to edit Retail Business Operation Management To Optimize Customer Experience Comparing Business Growth Over Brochure PDF can be your go to option for all upcoming conferences and meetings. So, what are you waiting for Grab this template today.

Enhancing Retail Process By Effective Inventory Management Comparing Business Growth Over The Last Two Years Rules PDF
Following slide portrays informational statistics about business growth over the last two years. It covers details about revenues, operating profit and net profit.Do you have to make sure that everyone on your team knows about any specific topic I yes, then you should give Enhancing Retail Process By Effective Inventory Management Comparing Business Growth Over The Last Two Years Rules PDF a try. Our experts have put a lot of knowledge and effort into creating this impeccable Enhancing Retail Process By Effective Inventory Management Comparing Business Growth Over The Last Two Years Rules PDF. You can use this template for your upcoming presentations, as the slides are perfect to represent even the tiniest detail. You can download these templates from the Slidegeeks website and these are easy to edit. So grab these today.
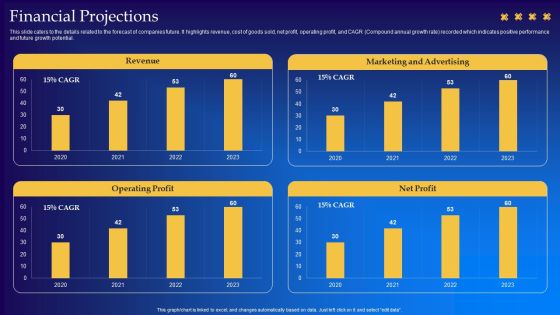
Live Audio Chat Platform Fundraising Pitch Deck Financial Projections Demonstration PDF
This slide caters to the details related to the forecast of companies future. It highlights revenue, cost of goods sold, net profit, operating profit, and CAGR Compound annual growth rate recorded which indicates positive performance and future growth potential. Want to ace your presentation in front of a live audience Our Live Audio Chat Platform Fundraising Pitch Deck Financial Projections Demonstration PDF can help you do that by engaging all the users towards you. Slidegeeks experts have put their efforts and expertise into creating these impeccable powerpoint presentations so that you can communicate your ideas clearly. Moreover, all the templates are customizable, and easy to edit and downloadable. Use these for both personal and commercial use.

Search Retargeting And Lead Generation Company Elevator Pitch Deck Financial Projections Portrait PDF
This slide caters to the details related to the forecast of companies future. It highlights revenue, cost of goods sold, net profit, operating profit, and CAGR Compound annual growth rate recorded which indicates positive performance and future growth potential. This modern and well arranged Search Retargeting And Lead Generation Company Elevator Pitch Deck Financial Projections Portrait PDF provides lots of creative possibilities. It is very simple to customize and edit with the Powerpoint Software. Just drag and drop your pictures into the shapes. All facets of this template can be edited with Powerpoint no extra software is necessary. Add your own material, put your images in the places assigned for them, adjust the colors, and then you can show your slides to the world, with an animated slide included.

A LA Carte Business Strategy Financial Overview FY 18 Topics PDF
The purpose of the following slide is to analyze the financial performance of the organization. The provided graph highlight the revenues, Gross profit and net profit margin of the organization for the year 2016,17,18 and 19. This A LA Carte Business Strategy Financial Overview FY 18 Topics PDF is perfect for any presentation, be it in front of clients or colleagues. It is a versatile and stylish solution for organizing your meetings. The A LA Carte Business Strategy Financial Overview FY 18 Topics PDF features a modern design for your presentation meetings. The adjustable and customizable slides provide unlimited possibilities for acing up your presentation. Slidegeeks has done all the homework before launching the product for you. So, do not wait, grab the presentation templates today

Per Device Pricing Strategy For Managed Solutions Financial Overview FY23 Ideas PDF
The purpose of the following slide is to analyze the financial performance of the organization. The provided graph highlight the revenues, Gross profit and net profit margin of the organization for the year 2020,21,22 and 23. Find highly impressive Per Device Pricing Strategy For Managed Solutions Financial Overview FY23 Ideas PDF on Slidegeeks to deliver a meaningful presentation. You can save an ample amount of time using these presentation templates. No need to worry to prepare everything from scratch because Slidegeeks experts have already done a huge research and work for you. You need to download Per Device Pricing Strategy For Managed Solutions Financial Overview FY23 Ideas PDF for your upcoming presentation. All the presentation templates are 100 percent editable and you can change the color and personalize the content accordingly. Download now.

Data And Customer Analysis Company Outline SWOT Analysis Mockup PDF
This slide highlights the Nielsen SWOT analysis which includes high revenue and reliable technology as strengths, low profitability and net profitability as weaknesses and high competition as threats. Do you have an important presentation coming up Are you looking for something that will make your presentation stand out from the rest Look no further than Data And Customer Analysis Company Outline SWOT Analysis Mockup PDF. With our professional designs, you can trust that your presentation will pop and make delivering it a smooth process. And with Slidegeeks, you can trust that your presentation will be unique and memorable. So why wait Grab Data And Customer Analysis Company Outline SWOT Analysis Mockup PDF today and make your presentation stand out from the rest.
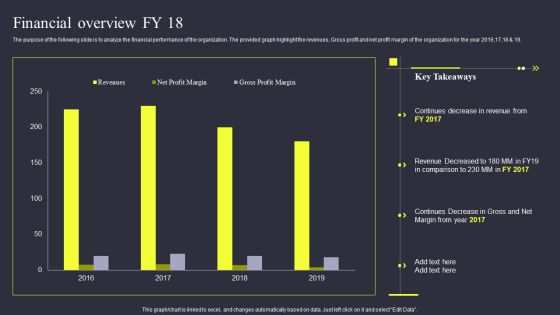
Strategies To Enhance Managed Service Business Financial Overview Fy 18 Information PDF
The purpose of the following slide is to analyze the financial performance of the organization. The provided graph highlight the revenues, Gross profit and net profit margin of the organization for the year 2016,17,18 and 19. Coming up with a presentation necessitates that the majority of the effort goes into the content and the message you intend to convey. The visuals of a PowerPoint presentation can only be effective if it supplements and supports the story that is being told. Keeping this in mind our experts created Strategies To Enhance Managed Service Business Financial Overview Fy 18 Information PDF to reduce the time that goes into designing the presentation. This way, you can concentrate on the message while our designers take care of providing you with the right template for the situation.

Construction Project Cost Benefit Analysis Report Project Feasibility Financial Ratios Ideas PDF
Following slide covers project feasibility financial ratio along with graphical representation. Ratios included are net profit sales, quick ratio, debt equity ratio and gross profit sales. Presenting this PowerPoint presentation, titled Construction Project Cost Benefit Analysis Report Project Feasibility Financial Ratios Ideas PDF, with topics curated by our researchers after extensive research. This editable presentation is available for immediate download and provides attractive features when used. Download now and captivate your audience. Presenting this Construction Project Cost Benefit Analysis Report Project Feasibility Financial Ratios Ideas PDF. Our researchers have carefully researched and created these slides with all aspects taken into consideration. This is a completely customizable Construction Project Cost Benefit Analysis Report Project Feasibility Financial Ratios Ideas PDF that is available for immediate downloading. Download now and make an impact on your audience. Highlight the attractive features available with our PPTs.
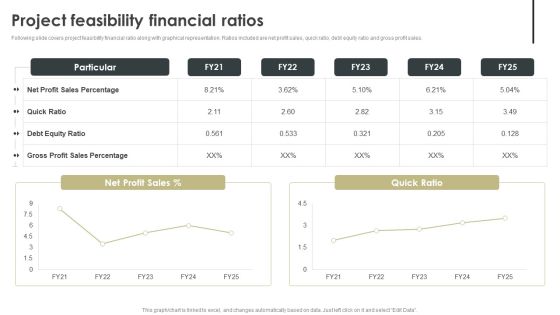
Construction Project Cost Benefit Analysis Report For Mortgage Approval Project Feasibility Financial Ratios Topics PDF
Following slide covers project feasibility financial ratio along with graphical representation. Ratios included are net profit sales, quick ratio, debt equity ratio and gross profit sales. Presenting this PowerPoint presentation, titled Construction Project Cost Benefit Analysis Report For Mortgage Approval Project Feasibility Financial Ratios Topics PDF, with topics curated by our researchers after extensive research. This editable presentation is available for immediate download and provides attractive features when used. Download now and captivate your audience. Presenting this Construction Project Cost Benefit Analysis Report For Mortgage Approval Project Feasibility Financial Ratios Topics PDF. Our researchers have carefully researched and created these slides with all aspects taken into consideration. This is a completely customizable Construction Project Cost Benefit Analysis Report For Mortgage Approval Project Feasibility Financial Ratios Topics PDF that is available for immediate downloading. Download now and make an impact on your audience. Highlight the attractive features available with our PPTs.

Project Feasibility Financial Ratios Feasibility Analysis Report For Construction Project Structure PDF
Following slide covers project feasibility financial ratio along with graphical representation. Ratios included are net profit sales, quick ratio, debt equity ratio and gross profit sales. Here you can discover an assortment of the finest PowerPoint and Google Slides templates. With these templates, you can create presentations for a variety of purposes while simultaneously providing your audience with an eye catching visual experience. Download Project Feasibility Financial Ratios Feasibility Analysis Report For Construction Project Structure PDF to deliver an impeccable presentation. These templates will make your job of preparing presentations much quicker, yet still, maintain a high level of quality. Slidegeeks has experienced researchers who prepare these templates and write high quality content for you. Later on, you can personalize the content by editing the Project Feasibility Financial Ratios Feasibility Analysis Report For Construction Project Structure PDF.
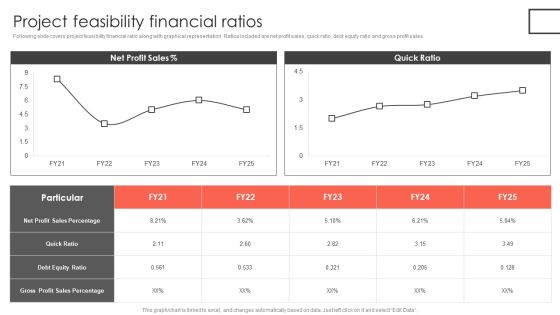
Project Feasibility Financial Ratios Construct Project Feasibility Analysis Report Microsoft PDF
Following slide covers project feasibility financial ratio along with graphical representation. Ratios included are net profit sales, quick ratio, debt equity ratio and gross profit sales. Formulating a presentation can take up a lot of effort and time, so the content and message should always be the primary focus. The visuals of the PowerPoint can enhance the presenters message, so our Project Feasibility Financial Ratios Construct Project Feasibility Analysis Report Microsoft PDF was created to help save time. Instead of worrying about the design, the presenter can concentrate on the message while our designers work on creating the ideal templates for whatever situation is needed. Slidegeeks has experts for everything from amazing designs to valuable content, we have put everything into Project Feasibility Financial Ratios Construct Project Feasibility Analysis Report Microsoft PDF
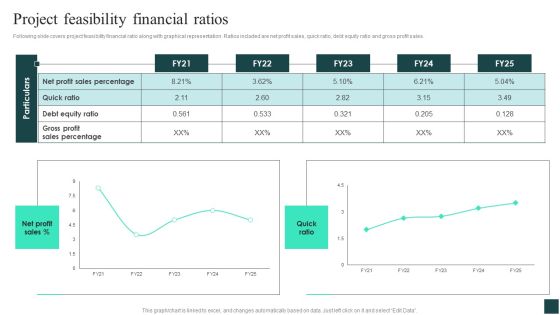
Project Feasibility Financial Ratios Credibility Assessment Summary For Construction Project Rules PDF
Following slide covers project feasibility financial ratio along with graphical representation. Ratios included are net profit sales, quick ratio, debt equity ratio and gross profit sales. Coming up with a presentation necessitates that the majority of the effort goes into the content and the message you intend to convey. The visuals of a PowerPoint presentation can only be effective if it supplements and supports the story that is being told. Keeping this in mind our experts created Project Feasibility Financial Ratios Credibility Assessment Summary For Construction Project Rules PDF to reduce the time that goes into designing the presentation. This way, you can concentrate on the message while our designers take care of providing you with the right template for the situation.
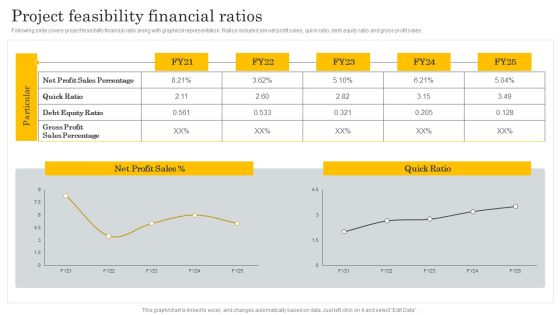
Financial Evaluation Report Project Feasibility Financial Ratios Mockup PDF
Following slide covers project feasibility financial ratio along with graphical representation. Ratios included are net profit sales, quick ratio, debt equity ratio and gross profit sales. Formulating a presentation can take up a lot of effort and time, so the content and message should always be the primary focus. The visuals of the PowerPoint can enhance the presenters message, so our Financial Evaluation Report Project Feasibility Financial Ratios Mockup PDF was created to help save time. Instead of worrying about the design, the presenter can concentrate on the message while our designers work on creating the ideal templates for whatever situation is needed. Slidegeeks has experts for everything from amazing designs to valuable content, we have put everything into Financial Evaluation Report Project Feasibility Financial Ratios Mockup PDF.
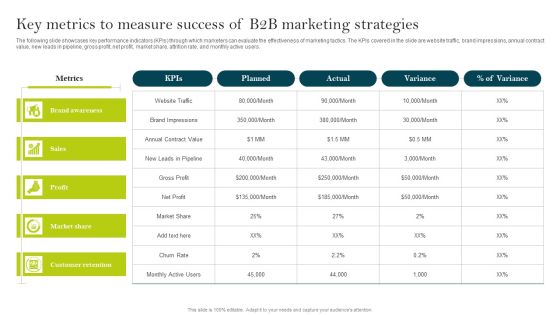
Key Metrics To Measure Success Of B2B Marketing Strategies Ppt PowerPoint Presentation File Styles PDF
The following slide showcases key performance indicators KPIs through which marketers can evaluate the effectiveness of marketing tactics. The KPIs covered in the slide are website traffic, brand impressions, annual contract value, new leads in pipeline, gross profit, net profit, market share, attrition rate, and monthly active users. Slidegeeks has constructed Key Metrics To Measure Success Of B2B Marketing Strategies Ppt PowerPoint Presentation File Styles PDF after conducting extensive research and examination. These presentation templates are constantly being generated and modified based on user preferences and critiques from editors. Here, you will find the most attractive templates for a range of purposes while taking into account ratings and remarks from users regarding the content. This is an excellent jumping off point to explore our content and will give new users an insight into our top notch PowerPoint Templates.

International Market Entry Strategies Company Key Figures For Past 5 Years Designs PDF
This slide covers the dashboard with major values for the last five years. It includes KPIs such as sales, net operating profit, sales by geographic areas, and number of employees. Retrieve professionally designed International Market Entry Strategies Company Key Figures For Past 5 Years Designs PDF to effectively convey your message and captivate your listeners. Save time by selecting pre-made slideshows that are appropriate for various topics, from business to educational purposes. These themes come in many different styles, from creative to corporate, and all of them are easily adjustable and can be edited quickly. Access them as PowerPoint templates or as Google Slides themes. You dont have to go on a hunt for the perfect presentation because Slidegeeks got you covered from everywhere.

New Market Segment Entry Plan Company Key Figures For Past 5 Years Introduction PDF
This slide covers the dashboard with major values for the last five years. It includes KPIs such as sales, net operating profit, sales by geographic areas, and number of employees. Whether you have daily or monthly meetings, a brilliant presentation is necessary. New Market Segment Entry Plan Company Key Figures For Past 5 Years Introduction PDF can be your best option for delivering a presentation. Represent everything in detail using New Market Segment Entry Plan Company Key Figures For Past 5 Years Introduction PDF and make yourself stand out in meetings. The template is versatile and follows a structure that will cater to your requirements. All the templates prepared by Slidegeeks are easy to download and edit. Our research experts have taken care of the corporate themes as well. So, give it a try and see the results.
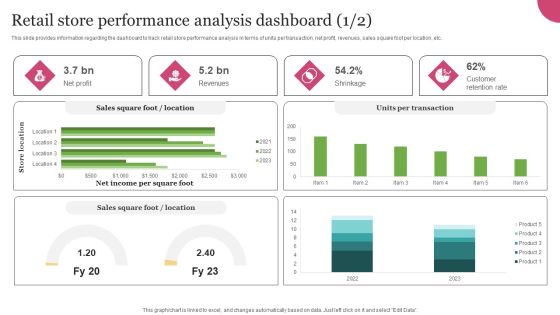
Experiential Retail Store Network Development Retail Store Performance Analysis Dashboard Themes PDF
This slide provides information regarding the dashboard to track retail store performance analysis in terms of units per transaction, net profit, revenues, sales square foot per location, etc. Crafting an eye-catching presentation has never been more straightforward. Let your presentation shine with this tasteful yet straightforward Experiential Retail Store Network Development Retail Store Performance Analysis Dashboard Themes PDF template. It offers a minimalistic and classy look that is great for making a statement. The colors have been employed intelligently to add a bit of playfulness while still remaining professional. Construct the ideal Experiential Retail Store Network Development Retail Store Performance Analysis Dashboard Themes PDF that effortlessly grabs the attention of your audience Begin now and be certain to wow your customers

Customer Service Plan To Improve Sales Comparative Analysis Of Customer Success Metrics Microsoft PDF
This slide covers the comparative analysis of customer success metrics which includes different parameters such as customer lifetime value, repeat purchase rate, customer retention rate, net promoter score, etc. Create an editable Customer Service Plan To Improve Sales Comparative Analysis Of Customer Success Metrics Microsoft PDF that communicates your idea and engages your audience. Whether you are presenting a business or an educational presentation, pre designed presentation templates help save time. Customer Service Plan To Improve Sales Comparative Analysis Of Customer Success Metrics Microsoft PDF is highly customizable and very easy to edit, covering many different styles from creative to business presentations. Slidegeeks has creative team members who have crafted amazing templates. So, go and get them without any delay.

Experiential Marketing Impact Analysis Post Event And Sales Demonstration PDF
This slide showcases experiential marketing impact assessment for post event and sales. It provides details about net promoter score NPS, follower growth rate, brand mentions, leads generated, cost per engagement, etc. Present like a pro with Experiential Marketing Impact Analysis Post Event And Sales Demonstration PDF Create beautiful presentations together with your team, using our easy to use presentation slides. Share your ideas in real time and make changes on the fly by downloading our templates. So whether you are in the office, on the go, or in a remote location, you can stay in sync with your team and present your ideas with confidence. With Slidegeeks presentation got a whole lot easier. Grab these presentations today.

Action Plan To Enhance Dashboard Depicting Metrics To Measure Customer Icons PDF
This slide shows dashboard that depicts metrics to measure customer experience that covers net revenue, customer retention, abandonment, unique visitors, etc. Find highly impressive Action Plan To Enhance Dashboard Depicting Metrics To Measure Customer Icons PDF on Slidegeeks to deliver a meaningful presentation. You can save an ample amount of time using these presentation templates. No need to worry to prepare everything from scratch because Slidegeeks experts have already done a huge research and work for you. You need to download Action Plan To Enhance Dashboard Depicting Metrics To Measure Customer Icons PDF for your upcoming presentation. All the presentation templates are 100 percent editable and you can change the color and personalize the content accordingly. Download now
Measuring Overall Health Of Company Using Customer Churn Metrics Ppt PowerPoint Presentation File Icon PDF
Mentioned slide outlines different key performance indicators KPIs that will assist corporates to evaluate the success of customer churn prevention strategies. The major metrics covered in the slide are revenue growth rate, monthly active users MAU, net promoter score NPS, customer satisfaction score CSAT, and customer acquisition cost CAC. Create an editable Measuring Overall Health Of Company Using Customer Churn Metrics Ppt PowerPoint Presentation File Icon PDF that communicates your idea and engages your audience. Whether you are presenting a business or an educational presentation, pre designed presentation templates help save time. Measuring Overall Health Of Company Using Customer Churn Metrics Ppt PowerPoint Presentation File Icon PDF is highly customizable and very easy to edit, covering many different styles from creative to business presentations. Slidegeeks has creative team members who have crafted amazing templates. So, go and get them without any delay.
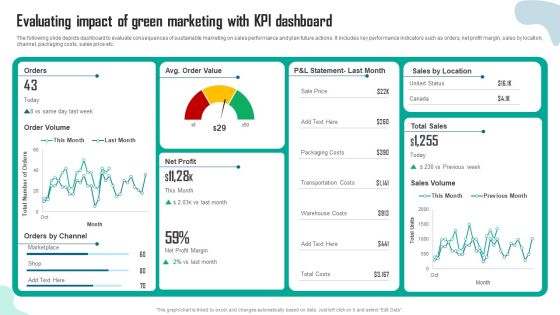
Evaluating Impact Of Green Marketing With Kpi Dashboard Inspiration PDF
The following slide depicts dashboard to evaluate consequences of sustainable marketing on sales performance and plan future actions. It includes key performance indicators such as orders, net profit margin, sales by location, channel, packaging costs, sales price etc. This Evaluating Impact Of Green Marketing With Kpi Dashboard Inspiration PDF from Slidegeeks makes it easy to present information on your topic with precision. It provides customization options, so you can make changes to the colors, design, graphics, or any other component to create a unique layout. It is also available for immediate download, so you can begin using it right away. Slidegeeks has done good research to ensure that you have everything you need to make your presentation stand out. Make a name out there for a brilliant performance.

Ad And Media Agency Company Profile Financial Comparison With Competitors Slides PDF
This slide focuses on financial comparison with competitors which covers annual revenue, operating expenses, net profit, market share, employee count, service coverage, etc. Here you can discover an assortment of the finest PowerPoint and Google Slides templates. With these templates, you can create presentations for a variety of purposes while simultaneously providing your audience with an eye-catching visual experience. Download Ad And Media Agency Company Profile Financial Comparison With Competitors Slides PDF to deliver an impeccable presentation. These templates will make your job of preparing presentations much quicker, yet still, maintain a high level of quality. Slidegeeks has experienced researchers who prepare these templates and write high-quality content for you. Later on, you can personalize the content by editing the Ad And Media Agency Company Profile Financial Comparison With Competitors Slides PDF.

Business Strategy Consulting Solutions Company Outline Competitive Comparison By Financials Structure PDF
This slide shows the comparison with competitors on the basis of financials which includes revenue, net profit, market share, employee count and service coverage. Here you can discover an assortment of the finest PowerPoint and Google Slides templates. With these templates, you can create presentations for a variety of purposes while simultaneously providing your audience with an eye catching visual experience. Download Business Strategy Consulting Solutions Company Outline Competitive Comparison By Financials Structure PDF to deliver an impeccable presentation. These templates will make your job of preparing presentations much quicker, yet still, maintain a high level of quality. Slidegeeks has experienced researchers who prepare these templates and write high quality content for you. Later on, you can personalize the content by editing the Business Strategy Consulting Solutions Company Outline Competitive Comparison By Financials Structure PDF.

Organizational Advisory Solutions Business Profile Competitive Comparison By Financials Mockup PDF
This slide shows the comparison with competitors on the basis of financials which includes revenue, net profit, market share, employee count and service coverage. Here you can discover an assortment of the finest PowerPoint and Google Slides templates. With these templates, you can create presentations for a variety of purposes while simultaneously providing your audience with an eye catching visual experience. Download Organizational Advisory Solutions Business Profile Competitive Comparison By Financials Mockup PDF to deliver an impeccable presentation. These templates will make your job of preparing presentations much quicker, yet still, maintain a high level of quality. Slidegeeks has experienced researchers who prepare these templates and write high quality content for you. Later on, you can personalize the content by editing the Organizational Advisory Solutions Business Profile Competitive Comparison By Financials Mockup PDF.
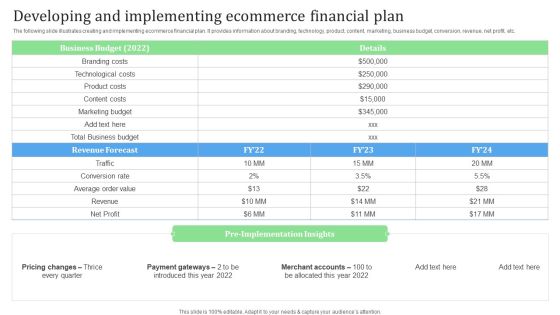
Developing And Implementing Ecommerce Financial Plan Financial Management Strategies Portrait PDF
The following slide illustrates creating and implementing ecommerce financial plan. It provides information about branding, technology, product, content, marketing, business budget, conversion, revenue, net profit, etc.Do you have an important presentation coming up Are you looking for something that will make your presentation stand out from the rest Look no further than Developing And Implementing Ecommerce Financial Plan Financial Management Strategies Portrait PDF. With our professional designs, you can trust that your presentation will pop and make delivering it a smooth process. And with Slidegeeks, you can trust that your presentation will be unique and memorable. So why wait Grab Developing And Implementing Ecommerce Financial Plan Financial Management Strategies Portrait PDF today and make your presentation stand out from the rest.

Assessing Debt And Equity Fundraising Alternatives For Business Growth Financial Highlights And Overview Guidelines PDF
This slide showcases company overview and key financial highlight such as net debt, revenue and profit. It also showcases other key components like number of employees, industry and annual growth rate of organization. This modern and well arranged Assessing Debt And Equity Fundraising Alternatives For Business Growth Financial Highlights And Overview Guidelines PDF provides lots of creative possibilities. It is very simple to customize and edit with the Powerpoint Software. Just drag and drop your pictures into the shapes. All facets of this template can be edited with Powerpoint no extra software is necessary. Add your own material, put your images in the places assigned for them, adjust the colors, and then you can show your slides to the world, with an animated slide included.
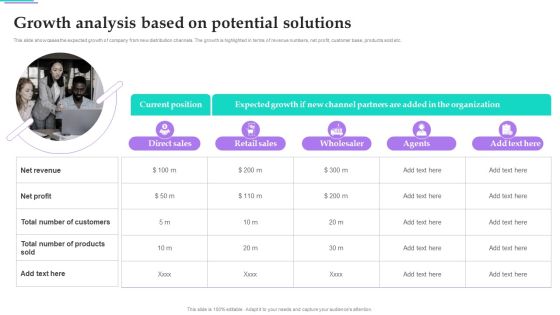
Distribution Strategies For Increasing Growth Analysis Based On Potential Solutions Designs PDF
This slide showcases the expected growth of company from new distribution channels. The growth is highlighted in terms of revenue numbers, net profit, customer base, products sold etc. Welcome to our selection of the Distribution Strategies For Increasing Growth Analysis Based On Potential Solutions Designs PDF. These are designed to help you showcase your creativity and bring your sphere to life. Planning and Innovation are essential for any business that is just starting out. This collection contains the designs that you need for your everyday presentations. All of our PowerPoints are 100 percent editable, so you can customize them to suit your needs. This multi-purpose template can be used in various situations. Grab these presentation templates today

Financial Comparison With Competitors Residential And Commercial Building Construction Download PDF
This slide represents the financial comparison of construction company with competitors on the basis of annual revenue, net profit, employee count, number of construction projects and new contracts.This Financial Comparison With Competitors Residential And Commercial Building Construction Download PDF is perfect for any presentation, be it in front of clients or colleagues. It is a versatile and stylish solution for organizing your meetings. The Financial Comparison With Competitors Residential And Commercial Building Construction Download PDF features a modern design for your presentation meetings. The adjustable and customizable slides provide unlimited possibilities for acing up your presentation. Slidegeeks has done all the homework before launching the product for you. So, do not wait, grab the presentation templates today

Competitor Comparison Analysis Report Life Science And Healthcare Solutions Company Profile Mockup PDF
The slide comparative analysis of company with competitors on the basis ratings, number of employees, funding, market capitalization, revenue, net profit and total assets. It describes the company position in global market. Explore a selection of the finest Competitor Comparison Analysis Report Life Science And Healthcare Solutions Company Profile Mockup PDF here. With a plethora of professionally designed and pre-made slide templates, you can quickly and easily find the right one for your upcoming presentation. You can use our Competitor Comparison Analysis Report Life Science And Healthcare Solutions Company Profile Mockup PDF to effectively convey your message to a wider audience. Slidegeeks has done a lot of research before preparing these presentation templates. The content can be personalized and the slides are highly editable. Grab templates today from Slidegeeks.

Importance Of Technological Change On Business Activity Integrating Technology To Transform Change Elements PDF
This slide shows the importance of technology transformation on business activity which covers net revenue growth and profit margin, operating expenses, communication processes, employee productivity, etc.Explore a selection of the finest Importance Of Technological Change On Business Activity Integrating Technology To Transform Change Elements PDF here. With a plethora of professionally designed and pre-made slide templates, you can quickly and easily find the right one for your upcoming presentation. You can use our Importance Of Technological Change On Business Activity Integrating Technology To Transform Change Elements PDF to effectively convey your message to a wider audience. Slidegeeks has done a lot of research before preparing these presentation templates. The content can be personalized and the slides are highly editable. Grab templates today from Slidegeeks.

Measuring Effectiveness Of Digital Transformation Integrating Technology To Transform Change Designs PDF
This slide focuses on dashboard that will help company to measure effectiveness of digital transformation which includes active customers, units sold, total revenues, net profit, etc.Are you searching for a Measuring Effectiveness Of Digital Transformation Integrating Technology To Transform Change Designs PDF that is uncluttered, straightforward, and original Its easy to edit, and you can change the colors to suit your personal or business branding. For a presentation that expresses how much effort you have put in, this template is ideal With all of its features, including tables, diagrams, statistics, and lists, its perfect for a business plan presentation. Make your ideas more appealing with these professional slides. Download Measuring Effectiveness Of Digital Transformation Integrating Technology To Transform Change Designs PDF from Slidegeeks today.

Omnichannel Distribution System To Satisfy Customer Needs Growth Analysis Based On Potential Solutions Topics PDF
This slide showcases the expected growth of company from new distribution channels. The growth is highlighted in terms of revenue numbers, net profit, customer base, products sold etc. Formulating a presentation can take up a lot of effort and time, so the content and message should always be the primary focus. The visuals of the PowerPoint can enhance the presenters message, so our Omnichannel Distribution System To Satisfy Customer Needs Growth Analysis Based On Potential Solutions Topics PDF was created to help save time. Instead of worrying about the design, the presenter can concentrate on the message while our designers work on creating the ideal templates for whatever situation is needed. Slidegeeks has experts for everything from amazing designs to valuable content, we have put everything into Omnichannel Distribution System To Satisfy Customer Needs Growth Analysis Based On Potential Solutions Topics PDF.
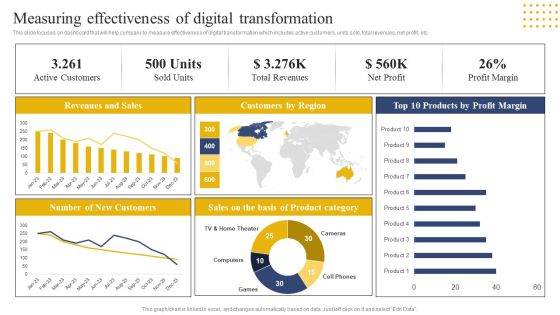
Transition Plan For Business Management Measuring Effectiveness Of Digital Transformation Sample PDF
This slide focuses on dashboard that will help company to measure effectiveness of digital transformation which includes active customers, units sold, total revenues, net profit, etc. This modern and well-arranged Transition Plan For Business Management Measuring Effectiveness Of Digital Transformation Sample PDF provides lots of creative possibilities. It is very simple to customize and edit with the Powerpoint Software. Just drag and drop your pictures into the shapes. All facets of this template can be edited with Powerpoint no extra software is necessary. Add your own material, put your images in the places assigned for them, adjust the colors, and then you can show your slides to the world, with an animated slide included.

Transition Plan For Business Management Importance Of Technological Change On Business Activity Guidelines PDF
This slide shows the importance of technology transformation on business activity which covers net revenue growth and profit margin, operating expenses, communication processes, employee productivity, etc. Presenting this PowerPoint presentation, titled Transition Plan For Business Management Importance Of Technological Change On Business Activity Guidelines PDF, with topics curated by our researchers after extensive research. This editable presentation is available for immediate download and provides attractive features when used. Download now and captivate your audience. Presenting this Transition Plan For Business Management Importance Of Technological Change On Business Activity Guidelines PDF. Our researchers have carefully researched and created these slides with all aspects taken into consideration. This is a completely customizable Transition Plan For Business Management Importance Of Technological Change On Business Activity Guidelines PDF that is available for immediate downloading. Download now and make an impact on your audience. Highlight the attractive features available with our PPTs.

Digital Transition Plan For Managing Business Measuring Effectiveness Of Digital Transformation Portrait PDF
This slide focuses on dashboard that will help company to measure effectiveness of digital transformation which includes active customers, units sold, total revenues, net profit, etc. Formulating a presentation can take up a lot of effort and time, so the content and message should always be the primary focus. The visuals of the PowerPoint can enhance the presenters message, so our Digital Transition Plan For Managing Business Measuring Effectiveness Of Digital Transformation Portrait PDF was created to help save time. Instead of worrying about the design, the presenter can concentrate on the message while our designers work on creating the ideal templates for whatever situation is needed. Slidegeeks has experts for everything from amazing designs to valuable content, we have put everything into Digital Transition Plan For Managing Business Measuring Effectiveness Of Digital Transformation Portrait PDF
