AI PPT Maker
Templates
PPT Bundles
Design Services
Business PPTs
Business Plan
Management
Strategy
Introduction PPT
Roadmap
Self Introduction
Timelines
Process
Marketing
Agenda
Technology
Medical
Startup Business Plan
Cyber Security
Dashboards
SWOT
Proposals
Education
Pitch Deck
Digital Marketing
KPIs
Project Management
Product Management
Artificial Intelligence
Target Market
Communication
Supply Chain
Google Slides
Research Services
 One Pagers
All Categories
-
Home
- Customer Favorites
- Net Income
Net Income

Pandl Kpis Tabular Form Ppt PowerPoint Presentation File Design Templates
This is a pandl kpis tabular form ppt powerpoint presentation file design templates. This is a four stage process. The stages in this process are revenue, cogs, operating profit, net profit.
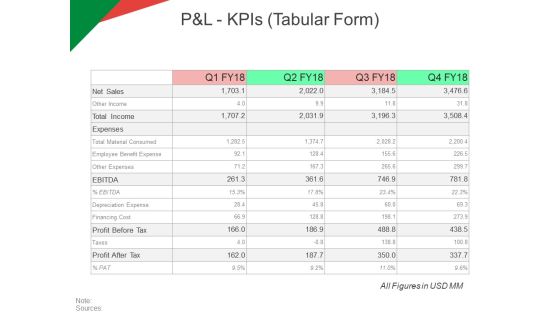
P And L Kpis Tabular Form Ppt PowerPoint Presentation Model Ideas
This is a p and l kpis tabular form ppt powerpoint presentation model ideas. This is a four stage process. The stages in this process are revenue, operating profit, cogs, net profit.

Pandl Kpis Tabular Form Ppt PowerPoint Presentation Pictures Visual Aids
This is a pandl kpis tabular form ppt powerpoint presentation pictures visual aids. This is a four stage process. The stages in this process are revenue, operating profit, cogs, net profit.

P And L Kpis Template 2 Ppt PowerPoint Presentation Inspiration Grid
This is a p and l kpis template 2 ppt powerpoint presentation inspiration grid. This is a four stage process. The stages in this process are revenue, cogs, operating profit, net profit.
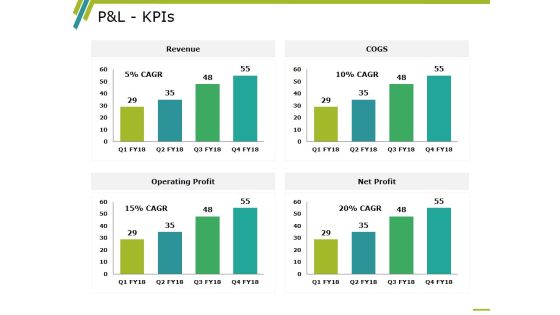
P And L Kpis Template 2 Ppt PowerPoint Presentation Professional Information
This is a p and l kpis template 2 ppt powerpoint presentation professional information. This is a four stage process. The stages in this process are revenue, operating profit, cogs, net profit, business.

P And L Kpis Ppt PowerPoint Presentation Designs Download
This is a p and l kpis ppt powerpoint presentation designs download. This is a four stage process. The stages in this process are revenue, cogs, operating profit, net profit.
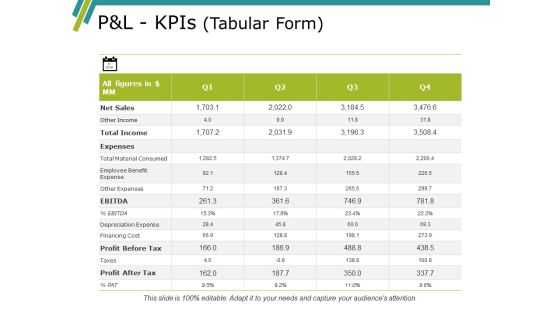
Pandl Kpis Template Ppt PowerPoint Presentation Gallery Summary
This is a pandl kpis template ppt powerpoint presentation gallery summary. This is a four stage process. The stages in this process are revenue, cogs, operating profit, net profit.
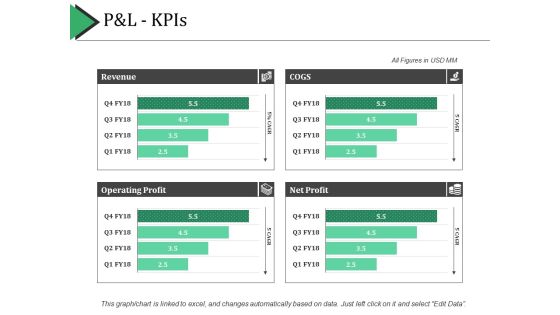
P And L Kpis Ppt PowerPoint Presentation Show Example Introduction
This is a p and l kpis ppt powerpoint presentation show example introduction. This is a four stage process. The stages in this process are revenue, cogs, net profit, operating profit.

Pandl Kpis Ppt PowerPoint Presentation Professional Backgrounds
This is a pandl kpis ppt powerpoint presentation professional backgrounds. This is a four stage process. The stages in this process are business, revenue, operating profit, cogs, net profit.

P And L Overview Template 2 Ppt PowerPoint Presentation Model Elements
This is a p and l overview template 2 ppt powerpoint presentation model elements. This is a four stage process. The stages in this process are financing cost, net sales, profit before tax, profit after tax.
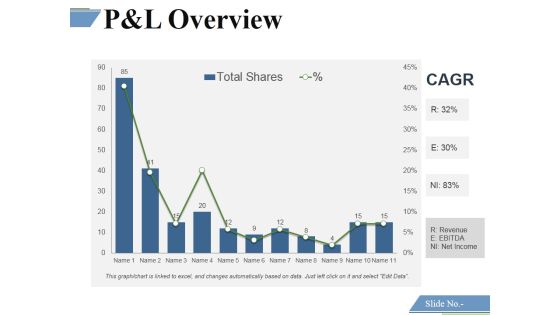
P And L Overview Template 3 Ppt PowerPoint Presentation Model Gridlines
This is a p and l overview template 3 ppt powerpoint presentation model gridlines. This is a eleven stage process. The stages in this process are financing cost, net sales, profit before tax, profit after tax.
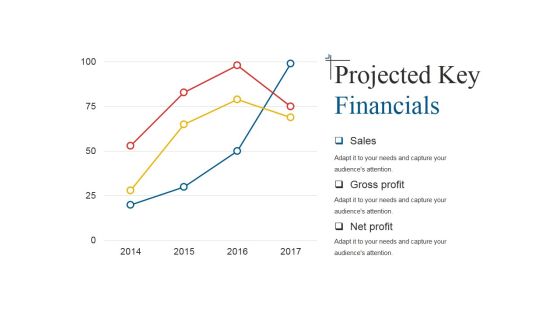
Projected Key Financials Template 1 Ppt PowerPoint Presentation Infographic Template Graphics
This is a projected key financials template 1 ppt powerpoint presentation infographic template graphics. This is a three stage process. The stages in this process are sales, gross profit, net profit.
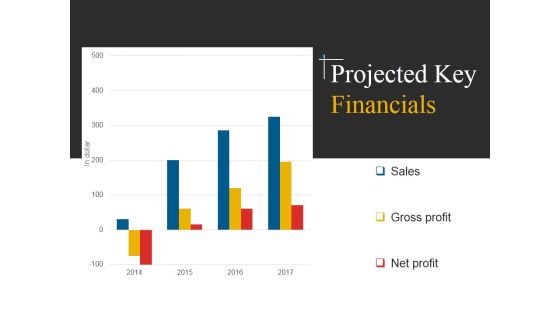
Projected Key Financials Template 2 Ppt PowerPoint Presentation Inspiration Example File
This is a projected key financials template 2 ppt powerpoint presentation inspiration example file. This is a four stage process. The stages in this process are sales, gross profit, net profit.
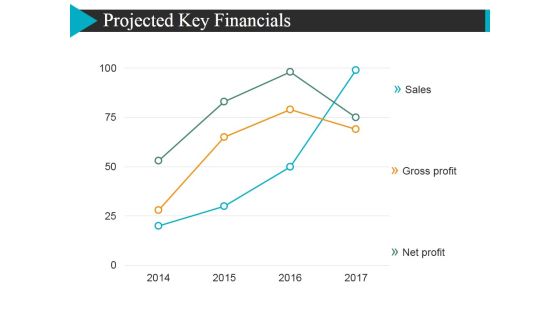
Projected Key Financials Template 1 Ppt PowerPoint Presentation Model Rules
This is a projected key financials template 1 ppt powerpoint presentation model rules. This is a three stage process. The stages in this process are sales, gross profit, net profit, finance.

Projected Key Financials Template 2 Ppt PowerPoint Presentation Professional Clipart
This is a projected key financials template 2 ppt powerpoint presentation professional clipart. This is a four stage process. The stages in this process are sales, gross profit, net profit, in dollar.

Projected Key Financials Template 1 Ppt PowerPoint Presentation File Portfolio
This is a projected key financials template 1 ppt powerpoint presentation file portfolio. This is a three stage process. The stages in this process are sales, gross profit, net profit.
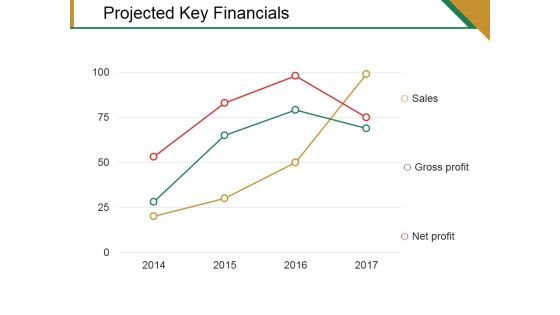
Projected Key Financials Template 2 Ppt PowerPoint Presentation Pictures Graphics Template
This is a projected key financials template 2 ppt powerpoint presentation pictures graphics template. This is a three stage process. The stages in this process are sales, gross profit, net profit.

P And L Kpis Ppt PowerPoint Presentation Portfolio Slide
This is a p and l kpis ppt powerpoint presentation portfolio slide. This is a four stage process. The stages in this process are ebitda, profit before tax, profit after tax, expenses, net sales.
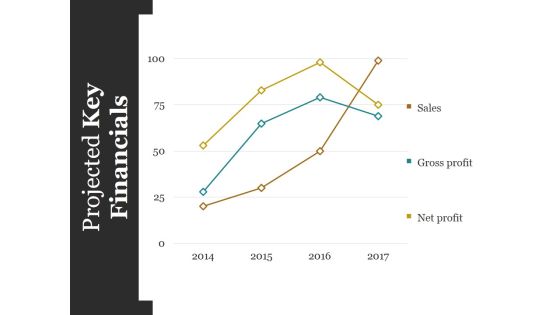
Projected Key Financials Template Ppt PowerPoint Presentation Styles Graphics Design
This is a projected key financials template ppt powerpoint presentation styles graphics design. This is a four stage process. The stages in this process are sales, gross profit, net profit.
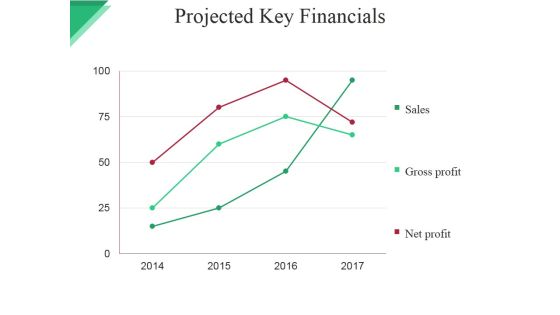
Projected Key Financials Template Ppt PowerPoint Presentation File Graphic Images
This is a projected key financials template ppt powerpoint presentation file graphic images. This is a four stage process. The stages in this process are sales, gross profit, net profit.

Projected Key Financials Template 1 Ppt PowerPoint Presentation Summary Professional
This is a projected key financials template 1 ppt powerpoint presentation summary professional. This is a three stage process. The stages in this process are in dollar, sales, gross profit, net profit, graph, year.
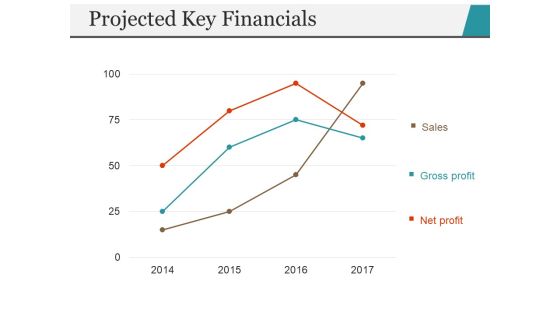
Projected Key Financials Template 2 Ppt PowerPoint Presentation Portfolio Inspiration
This is a projected key financials template 2 ppt powerpoint presentation portfolio inspiration. This is a three stage process. The stages in this process are sales, gross profit, net profit, year, finance.

Pandl Kpis Tabular Form Ppt PowerPoint Presentation Outline Background
This is a pandl kpis tabular form ppt powerpoint presentation outline background. This is a four stage process. The stages in this process are net sales, expenses, ebitda, profit before tax, profit after tax.
P And L Kpis Ppt PowerPoint Presentation Infographics Background
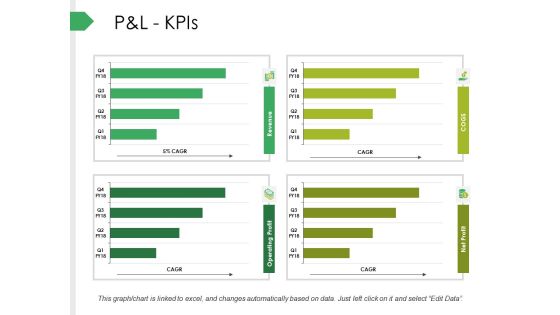
This is a p and l kpis ppt powerpoint presentation infographics background. This is a four stage process. The stages in this process are net sales, expenses, ebitda, profit before tax, profit after tax.

Activity Ratios Template 2 Ppt PowerPoint Presentation Summary Display
This is a activity ratios template 2 ppt powerpoint presentation summary display. This is a two stage process. The stages in this process are inventory turnover, receivable turnover, net credit sales, average accounts receivable.

Activity Ratios Template 3 Ppt PowerPoint Presentation Icon Demonstration
This is a activity ratios template 3 ppt powerpoint presentation icon demonstration. This is a two stage process. The stages in this process are total asset turnover, fixed assets turnover, net sales, fixed assets.

Activity Ratios Template 4 Ppt PowerPoint Presentation Pictures Example File
This is a activity ratios template 4 ppt powerpoint presentation pictures example file. This is a two stage process. The stages in this process are total asset turnover, fixed assets turnover, net sales, fixed assets.

Activity Ratios Template 1 Ppt PowerPoint Presentation Pictures Graphics Example
This is a activity ratios template 1 ppt powerpoint presentation pictures graphics example. This is a two stage process. The stages in this process are inventory turnover, receivables turnover, avg inventory, net credit sales, average accounts receivable.

Activity Ratios Template 2 Ppt PowerPoint Presentation Layouts Clipart Images
This is a activity ratios template 2 ppt powerpoint presentation layouts clipart images. This is a two stage process. The stages in this process are inventory turnover, receivables turnover, avg inventory, net credit sales, average accounts receivable.

Activity Ratios Template 3 Ppt PowerPoint Presentation Inspiration Example File
This is a activity ratios template 3 ppt powerpoint presentation inspiration example file. This is a two stage process. The stages in this process are total asset turnover, net sales, average total assets, fixed assets turnover, fixed assets.

Activity Ratios Template 4 Ppt PowerPoint Presentation Ideas Objects
This is a activity ratios template 4 ppt powerpoint presentation ideas objects. This is a two stage process. The stages in this process are total asset turnover, net sales, average total assets, fixed assets turnover, fixed assets.

Activity Ratios Template 3 Ppt PowerPoint Presentation Professional Example
This is a activity ratios template 3 ppt powerpoint presentation professional example. This is a two stage process. The stages in this process are total asset turnover, net sales, fixed assets turnover, fixed assets.

Activity Ratios Template Ppt PowerPoint Presentation Summary Slides
This is a activity ratios template ppt powerpoint presentation summary slides. This is a two stage process. The stages in this process are total asset turnover, net sales, fixed assets turnover, fixed assets.

Activity Ratios Ppt PowerPoint Presentation Icon Themes
This is a activity ratios ppt powerpoint presentation icon themes. This is a two stage process. The stages in this process are inventory turnover, cogs, average inventory, receivable turnover, net credit sales, average accounts receivable .

Activity Ratios Template 3 Ppt PowerPoint Presentation File Diagrams
This is a activity ratios template 3 ppt powerpoint presentation file diagrams. This is a two stage process. The stages in this process are total asset turnover, fixed assets turnover, net sales.

Activity Ratios Ppt PowerPoint Presentation Gallery Microsoft
This is a activity ratios ppt powerpoint presentation gallery microsoft. This is a two stage process. The stages in this process are inventory turnover, receivables turnover, net credit sales, average accounts receivable.
Key Profitability And Valuation Ratios Ppt Professional Portfolio PDF
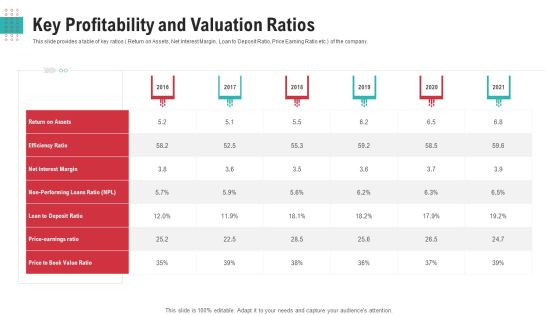
This slide provides a table of key ratios Return on Assets, Net Interest Margin, Loan to Deposit Ratio, Price Earning Ratio etc. of the company.Deliver an awe-inspiring pitch with this creative key profitability and valuation ratios ppt professional portfolio pdf. bundle. Topics like net interest margin, loan to deposit ratio, price earnings ratio can be discussed with this completely editable template. It is available for immediate download depending on the needs and requirements of the user
P And L Kpis Ppt PowerPoint Presentation Show Design Inspiration
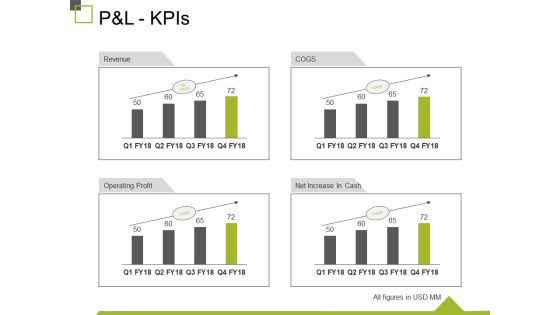
This is a p and l kpis ppt powerpoint presentation show design inspiration. This is a four stage process. The stages in this process are revenue, operating profit, cogs, net increase in cash, business.

Kips For Business Analysis And Project Management Example Of Ppt Presentation
This is a kips for business analysis and project management example of ppt presentation. This is a eight stage process. The stages in this process are business metrics, customer scarification, expense management, revenue attainment, net work, turnover, productivity, roi.

Overview Of Capital Budgeting Powerpoint Guide
This is a organizational learning models ppt example. This is a five stage process. The stages in this process are net present value, internal rate of return, profitability index, payback, discounted payback.

Capital Planning And Budgeting Solution Ppt Powerpoint Themes
This is a capital planning and budgeting solution ppt powerpoint themes. This is a six stage process. The stages in this process are profitability index, net present value, internal rate of return, strategies, budgets, capital plans.

Factors Of Just In Time Budgeting Ppt Powerpoint Templates Download
This is a factors of just in time budgeting ppt powerpoint templates download. This is a six stage process. The stages in this process are evaluate managers, profitability index, net present value npv, discounted payback, communicate plans, control resources.

Payback Method Template Ppt Presentation Examples
This is a payback method template ppt presentation examples. This is a five stage process. The stages in this process are payback period, net present value, cash flows, profitability index, internal rate of return.

Capital Budgeting Techniques Ppt Slide
This is a capital budgeting techniques ppt slide. This is a five stage process. The stages in this process are net present value, internal rate of return, profitability index, payback, discounted payback.

New Capital Budgeting Ppt PowerPoint Presentation Influencers
This is a new capital budgeting ppt powerpoint presentation influencers. This is a five stage process. The stages in this process are discounted payback, payback, profitability index, net present value.

Monthly Revenue Projection Ppt PowerPoint Presentation Pictures Slide
This is a monthly revenue projection ppt powerpoint presentation pictures slide. This is a four stage process. The stages in this process are average revenue per user, starting subscriber, new subscribers, cancellations, net additions.
Financial Projection Graph Template 2 Ppt PowerPoint Presentation Graphics
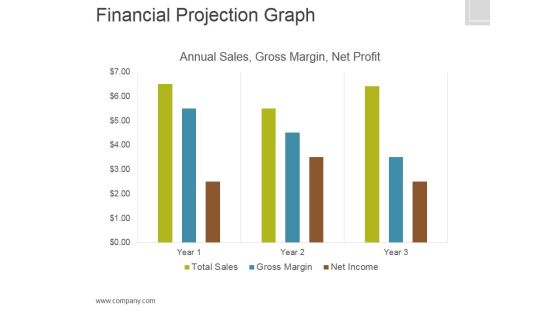
This is a financial projection graph template 2 ppt powerpoint presentation graphics. This is a three stage process. The stages in this process are annual sales, gross margin, net profit, finance.
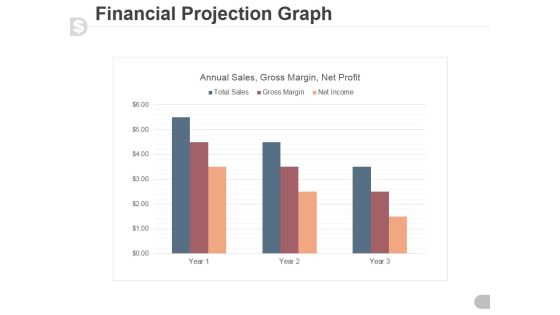
Financial Projection Graph Template 1 Ppt PowerPoint Presentation Guide
This is a financial projection graph template 1 ppt powerpoint presentation guide. This is a three stage process. The stages in this process are annual sales, gross margin, net profit.

Market Segmentation Evaluation Template 1 Ppt PowerPoint Presentation Templates
This is a market segmentation evaluation template 1 ppt powerpoint presentation templates. This is a two stage process. The stages in this process are market sale, net profit, evaluation, business, marketing.
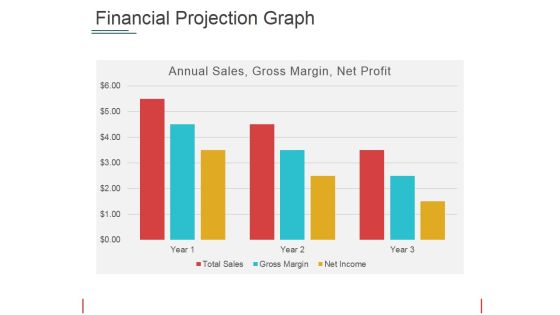
Financial Projection Graph Template 2 Ppt PowerPoint Presentation Show Picture
This is a financial projection graph template 2 ppt powerpoint presentation show picture. This is a three stage process. The stages in this process are annual sales, gross margin, net profit, years.
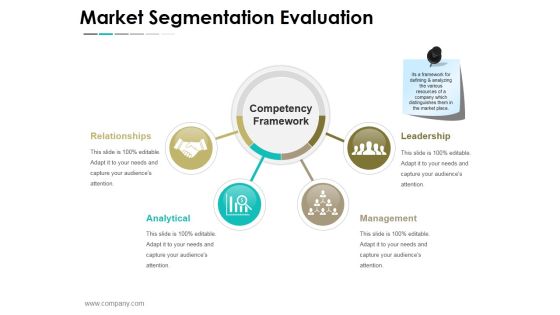
Market Segmentation Evaluation Ppt PowerPoint Presentation Layouts Images
This is a market segmentation evaluation ppt powerpoint presentation layouts images. This is a two stage process. The stages in this process are market sales, net profit, confectionary, milk products, beverages, nutrition and health care.
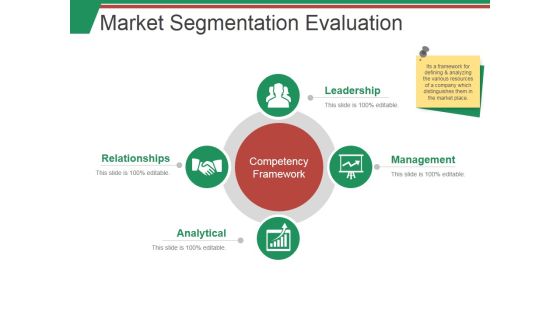
Market Segmentation Evaluation Template 1 Ppt PowerPoint Presentation Summary Smartart
This is a market segmentation evaluation template 1 ppt powerpoint presentation summary smartart. This is a two stage process. The stages in this process are market sales, net profit, beverages, milk product, nutrition.
Market Segmentation Evaluation Ppt PowerPoint Presentation Icon Pictures
This is a market segmentation evaluation ppt powerpoint presentation icon pictures. This is a two stage process. The stages in this process are net profit, in usd millions, market sales, business, marketing.

Market Segmentation Evaluation Ppt PowerPoint Presentation Infographics Background
This is a market segmentation evaluation ppt powerpoint presentation infographics background. This is a two stage process. The stages in this process are market sales, net profit, icons, finance, business, marketing.
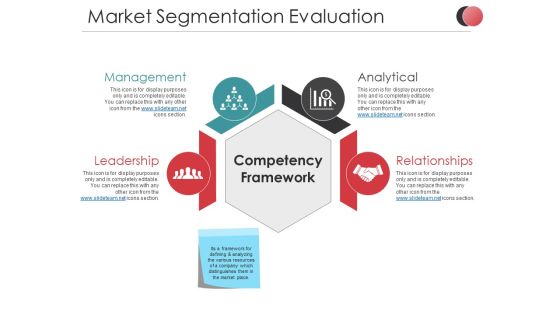
Market Segmentation Evaluation Ppt PowerPoint Presentation Summary Slideshow
This is a market segmentation evaluation ppt powerpoint presentation summary slideshow. This is a two stage process. The stages in this process are net profit, market sales, business, marketing, finance, icons.

Market Segmentation Evaluation Segment Size And Growth Potential Ppt PowerPoint Presentation Model
This is a market segmentation evaluation segment size and growth potential ppt powerpoint presentation model. This is a two stage process. The stages in this process are net profit, market sales, milk products, confectionary.
Financial Summary Ppt PowerPoint Presentation Icon Pictures
This is a financial summary ppt powerpoint presentation icon pictures. This is a seven stage process. The stages in this process are net sales, expenses, ebitda, profit after tax.
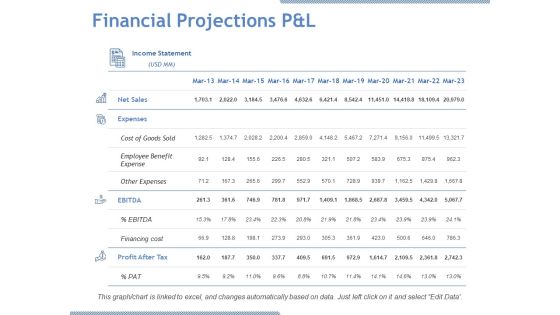
Financial Projections P And L Ppt PowerPoint Presentation Model Design Inspiration
This is a financial projections p and l ppt powerpoint presentation model design inspiration. This is a four stage process. The stages in this process are net sales, expenses, ebitda, profit after tax, cost of goods sold.

Balance Sheet Kpis Tabular Form Template 2 Ppt PowerPoint Presentation Summary Structure
This is a balance sheet kpis tabular form template 2 ppt powerpoint presentation summary structure. This is a four stage process. The stages in this process are net sales, expenses, ebitda, profit after tax, finecing cost.

Financial Projections P And L Ppt PowerPoint Presentation Summary Backgrounds
This is a financial projections p and l ppt powerpoint presentation summary backgrounds. This is a four stage process. The stages in this process are net sales, expenses, other expenses, profit after tax, pat.
