AI PPT Maker
Templates
PPT Bundles
Design Services
Business PPTs
Business Plan
Management
Strategy
Introduction PPT
Roadmap
Self Introduction
Timelines
Process
Marketing
Agenda
Technology
Medical
Startup Business Plan
Cyber Security
Dashboards
SWOT
Proposals
Education
Pitch Deck
Digital Marketing
KPIs
Project Management
Product Management
Artificial Intelligence
Target Market
Communication
Supply Chain
Google Slides
Research Services
 One Pagers
All Categories
-
Home
- Customer Favorites
- Monthly Dashboard
Monthly Dashboard

Information Technology Company Monthly Sales Forecast Dashboard Ppt Portfolio Images PDF
This slide shows the dashboard representing the data related to monthly sales forecast of an Information Technology Company. It shows information related to the net sales by customer, variance between actual and forecasted sales, total net sales, net sales per customer and total net sales per time for actual and forecasted sales. Pitch your topic with ease and precision using this Information Technology Company Monthly Sales Forecast Dashboard Ppt Portfolio Images PDF. This layout presents information on Total Net Sales, Actual vs Forecast, Net Sales Customer. It is also available for immediate download and adjustment. So, changes can be made in the color, design, graphics or any other component to create a unique layout.

Monthly Production Summary Monitoring And Analysis Dashboard Guidelines PDF
The slide shows the monitoring and analysis dashboard of monthly production. The slide covers run-time and down time comparison, production cost of last 12 months, and overall equipment effectiveness. Showcasing this set of slides titled Monthly Production Summary Monitoring And Analysis Dashboard Guidelines PDF. The topics addressed in these templates are Availability, Rework Quantity, Manufacturing Cost. All the content presented in this PPT design is completely editable. Download it and make adjustments in color, background, font etc. as per your unique business setting.
Monthly Sales Performance Tracking And Monitoring Dashboard Sample PDF
This slide showcases a dashboard presenting various metrics to measure and analyze sales performance for revenue growth. It includes key components such as number of sales, revenue, profit, cost, sales revenue, sales increment, cost analysis and cross sell. Do you have to make sure that everyone on your team knows about any specific topic I yes, then you should give Monthly Sales Performance Tracking And Monitoring Dashboard Sample PDF a try. Our experts have put a lot of knowledge and effort into creating this impeccable Monthly Sales Performance Tracking And Monitoring Dashboard Sample PDF. You can use this template for your upcoming presentations, as the slides are perfect to represent even the tiniest detail. You can download these templates from the Slidegeeks website and these are easy to edit. So grab these today.
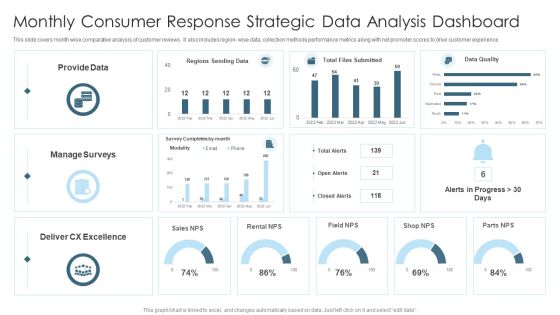
Monthly Consumer Response Strategic Data Analysis Dashboard Graphics PDF
This slide covers month wise comparative analysis of customer reviews . It also includes region wise data, collection methods performance metrics along with net promoter scores to drive customer experience. Showcasing this set of slides titled Monthly Consumer Response Strategic Data Analysis Dashboard Graphics PDF. The topics addressed in these templates are Provide Data, Sales, Manage Surveys. All the content presented in this PPT design is completely editable. Download it and make adjustments in color, background, font etc. as per your unique business setting.
Monthly Sales Performance Tracking And Monitoring Dashboard Diagrams PDF
This slide showcases a dashboard presenting various metrics to measure and analyze sales performance for revenue growth. It includes key components such as number of sales, revenue, profit, cost, sales revenue, sales increment, cost analysis and cross sell. Make sure to capture your audiences attention in your business displays with our gratis customizable Monthly Sales Performance Tracking And Monitoring Dashboard Diagrams PDF. These are great for business strategies, office conferences, capital raising or task suggestions. If you desire to acquire more customers for your tech business and ensure they stay satisfied, create your own sales presentation with these plain slides.
Monthly Sales Performance Tracking And Monitoring Dashboard Designs PDF
This slide showcases a dashboard presenting various metrics to measure and analyze sales performance for revenue growth. It includes key components such as number of sales, revenue, profit, cost, sales revenue, sales increment, cost analysis and cross sell. Make sure to capture your audiences attention in your business displays with our gratis customizable Monthly Sales Performance Tracking And Monitoring Dashboard Designs PDF. These are great for business strategies, office conferences, capital raising or task suggestions. If you desire to acquire more customers for your tech business and ensure they stay satisfied, create your own sales presentation with these plain slides.
Monthly Project Investment Expense Tracking KPI Dashboard Themes PDF
This slide showcases KPI dashboard for analysing the variance between billed and budgeted expenses. It also include metrics such as project budget, potential, billed, cost, margin billed vs. budget labour cost, hours details by resources, etc. Pitch your topic with ease and precision using this Monthly Project Investment Expense Tracking KPI Dashboard Themes PDF. This layout presents information on Project Summary, Sales Potential. It is also available for immediate download and adjustment. So, changes can be made in the color, design, graphics or any other component to create a unique layout.
Monthly Sales Performance Tracking And Monitoring Dashboard Inspiration PDF
This slide showcases a dashboard presenting various metrics to measure and analyze sales performance for revenue growth. It includes key components such as number of sales, revenue, profit, cost, sales revenue, sales increment, cost analysis and cross sell. Coming up with a presentation necessitates that the majority of the effort goes into the content and the message you intend to convey. The visuals of a PowerPoint presentation can only be effective if it supplements and supports the story that is being told. Keeping this in mind our experts created Monthly Sales Performance Tracking And Monitoring Dashboard Inspiration PDF to reduce the time that goes into designing the presentation. This way, you can concentrate on the message while our designers take care of providing you with the right template for the situation.

Six Months Lead Generation Marketing Dashboard Inspiration PDF
The slide carries lead generation dashboard to build deeper understanding of business and customer journey. Various KPIs included are lead values per month, number of leads per month and lead marketing channels. Showcasing this set of slides titled Six Months Lead Generation Marketing Dashboard Inspiration PDF. The topics addressed in these templates are Six Months Lead Generation, Marketing Dashboard. All the content presented in this PPT design is completely editable. Download it and make adjustments in color, background, font etc. as per your unique business setting.

6 Months Company Revenue Comparison Dashboard Graphics PDF
This slide showcases the half yearly profit comparison dashboard. It also includes comparison kp is such as monthly profit, profit margin growth, branch profit percentage, top 3 profitable products, etc. Showcasing this set of slides titled 6 Months Company Revenue Comparison Dashboard Graphics PDF. The topics addressed in these templates are Growth Rate, Overall Profit Margin, Branch Profit. All the content presented in this PPT design is completely editable. Download it and make adjustments in color, background, font etc. as per your unique business setting.

Monthly Profit And Loss Statement Reports Analysis Dashboard Brochure PDF
This slide shows a monthly profit and loss statement dashboard. The constituting elements herein are total net revenue, cost of goods sold and gross profit.Pitch your topic with ease and precision using this Monthly Profit And Loss Statement Reports Analysis Dashboard Brochure PDF. This layout presents information on Costs Good Sold, Earnings Before, Interest Expense. It is also available for immediate download and adjustment. So, changes can be made in the color, design, graphics or any other component to create a unique layout.
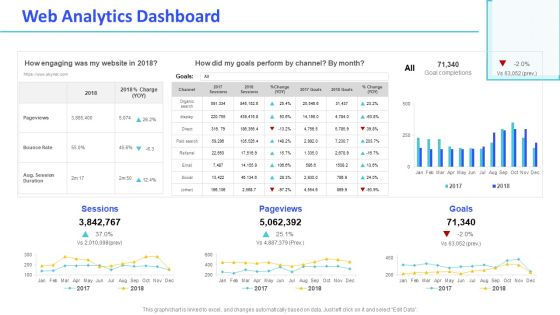
Monthly Digital Marketing Report Template Web Analytics Dashboard Mockup PDF
Deliver and pitch your topic in the best possible manner with this monthly digital marketing report template web analytics dashboard mockup pdf. Use them to share invaluable insights on web analytics dashboard and impress your audience. This template can be altered and modified as per your expectations. So, grab it now.
Real Estate Finance Dashboard With Monthly Sales And Properties Listed Ppt Gallery Icons PDF
This slide shows a Real Estate Finance Dashboard with variables such as monthly sales, properties listed, new listings, average days on market, commission paid etc. Deliver an awe inspiring pitch with this creative real estate finance dashboard with monthly sales and properties listed ppt gallery icons pdf bundle. Topics like real estate finance dashboard with monthly sales and properties listed can be discussed with this completely editable template. It is available for immediate download depending on the needs and requirements of the user.
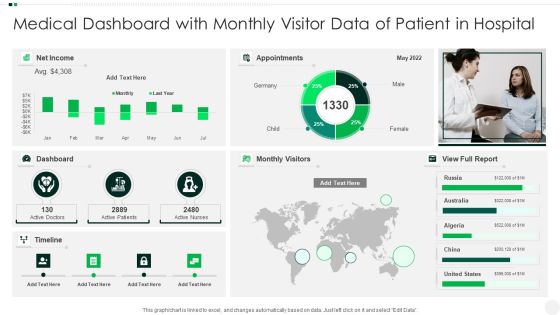
Medical Dashboard With Monthly Visitor Data Of Patient In Hospital Topics PDF
Pitch your topic with ease and precision using this Medical Dashboard With Monthly Visitor Data Of Patient In Hospital Topics PDF. This layout presents information on Medical Dashboard With Monthly Visitor Data Of Patient In Hospital. It is also available for immediate download and adjustment. So, changes can be made in the color, design, graphics or any other component to create a unique layout.

Promotion Dashboard With Monthly Organic And Paid Search Sales Mockup PDF Sample PDF
Showcasing this set of slides titled Promotion Dashboard With Monthly Organic And Paid Search Sales Mockup PDF Sample PDF The topics addressed in these templates are Promotion Dashboard With Monthly Organic And Paid Search Sales All the content presented in this PPT design is completely editable. Download it and make adjustments in color, background, font etc. as per your unique business setting.

Business Monthly Sales Report Summary Dashboard With Churn Rate Background PDF
The following slide highlights the monthly sales report dashboard with churn rate. It showcases details for current month sales, total revenue, current month profit, current month cost, sales revenue, current month expense, revenue churn rate and accumulated revenue.Pitch your topic with ease and precision using this Business Monthly Sales Report Summary Dashboard With Churn Rate Background PDF This layout presents information on Total Revenue, Accumulated Revenue, Marketing Medium It is also available for immediate download and adjustment. So, changes can be made in the color, design, graphics or any other component to create a unique layout.

Logistics KPI Status Dashboard With Monthly KPI Ppt Infographic Template Layout PDF
The following slide highlights the transportation status dashboard with monthly KPI illustrating order status with customer, order date and delivery date. It shows financial performance for four quarters as well as todays order, inventory and monthly KPI with Inventory, shipping cost for past 30 days. Pitch your topic with ease and precision using this Logistics KPI Status Dashboard With Monthly KPI Ppt Infographic Template Layout PDF. This layout presents information on Order Status, Today Order, Inventory, Monthly KPI. It is also available for immediate download and adjustment. So, changes can be made in the color, design, graphics or any other component to create a unique layout.

Monthly Project Progress Report Dashboard With Execution Timeline Ppt Icon Graphics Tutorials PDF
This slide showcases monthly project status dashboard with execution timeline. It provides information about sponsor, financials, budget, key risks and issues, work stream , etc. Presenting Monthly Project Progress Report Dashboard With Execution Timeline Ppt Icon Graphics Tutorials PDF to dispense important information. This template comprises one stages. It also presents valuable insights into the topics including Execution Timeline, Project Status, Project Manager. This is a completely customizable PowerPoint theme that can be put to use immediately. So, download it and address the topic impactfully.

Monthly Project Progress Report Dashboard With Assigned Tasks Ppt Styles Clipart PDF
This slide showcases monthly project status dashboard with assigned tasks. It provides information about kick off meeting, resource plan, technical requests, development, hardware configuration, budget, pending items, etc. Pitch your topic with ease and precision using this Monthly Project Progress Report Dashboard With Assigned Tasks Ppt Styles Clipart PDF. This layout presents information on Pending Items, Budget, Kick Off Meeting. It is also available for immediate download and adjustment. So, changes can be made in the color, design, graphics or any other component to create a unique layout.
Robotic Process Automation Dashboard With Monthly Test Execution KPI Icons PDF
This slide covers RPA metrics for analyzing test execution on automated platforms. It also includes test execution metrics such as total test executed, test status, tests executed daily for different operation systems, etc. Pitch your topic with ease and precision using this Robotic Process Automation Dashboard With Monthly Test Execution KPI Icons PDF. This layout presents information on Robotic Process Automation Dashboard, Monthly Test Execution Kpi. It is also available for immediate download and adjustment. So, changes can be made in the color, design, graphics or any other component to create a unique layout.

Deployment Of Process Automation To Increase Organisational Performance Dashboard For Monthly Graphics PDF
This slide presents a dashboard for monthly procurement activities in an organization. It includes number of suppliers, contract attainted, supplier share, top supplier report, average procurement cycle time, etc. Here you can discover an assortment of the finest PowerPoint and Google Slides templates. With these templates, you can create presentations for a variety of purposes while simultaneously providing your audience with an eye catching visual experience. Download Deployment Of Process Automation To Increase Organisational Performance Dashboard For Monthly Graphics PDF to deliver an impeccable presentation. These templates will make your job of preparing presentations much quicker, yet still, maintain a high level of quality. Slidegeeks has experienced researchers who prepare these templates and write high quality content for you. Later on, you can personalize the content by editing the Deployment Of Process Automation To Increase Organisational Performance Dashboard For Monthly Graphics PDF.

Dashboard Showing Monthly Sales And Sales Distribution Ppt PowerPoint Presentation Infographic Template Portrait PDF
Presenting this set of slides with name dashboard showing monthly sales and sales distribution ppt powerpoint presentation infographic template portrait pdf. The topics discussed in these slides are monthly sales, sales distribution. This is a completely editable PowerPoint presentation and is available for immediate download. Download now and impress your audience.

Monthly Profit And Loss Dashboard Reports With Expenses And Revenue Kpis Portrait PDF
This slide shows a dashboard of monthly profit and loss transactions of a company. It depicts last six months expenses, revenues, payment status and customer growth.Showcasing this set of slides titled Monthly Profit And Loss Dashboard Reports With Expenses And Revenue Kpis Portrait PDF. The topics addressed in these templates are Overall Profit Margin, Overall Outstanding Revenue, Customer Growth. All the content presented in this PPT design is completely editable. Download it and make adjustments in color, background, font etc. as per your unique business setting.
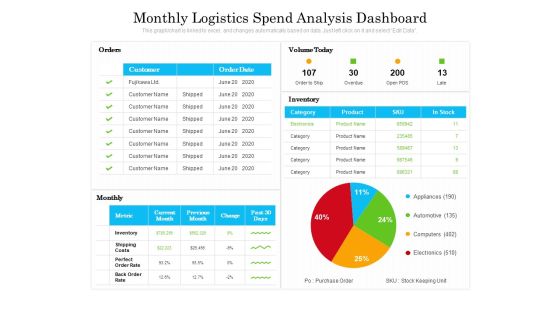
Monthly Logistics Spend Analysis Dashboard Ppt PowerPoint Presentation Gallery Objects PDF
Presenting this set of slides with name monthly logistics spend analysis dashboard ppt powerpoint presentation gallery objects pdf. The topics discussed in these slides are inventory, costs, electronics. This is a completely editable PowerPoint presentation and is available for immediate download. Download now and impress your audience.
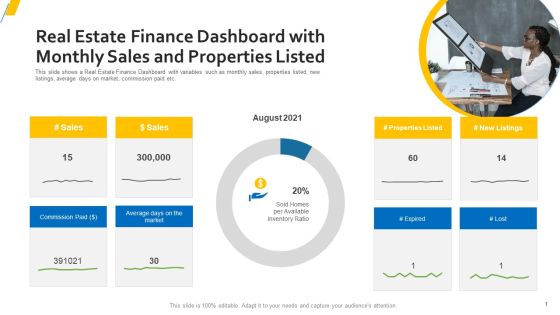
Real Estate Finance Dashboard With Monthly Sales And Properties Listed Microsoft PDF
Deliver an awe-inspiring pitch with this creative real estate finance dashboard with monthly sales and properties listed microsoft pdf. bundle. Topics like average days on the market, sales can be discussed with this completely editable template. It is available for immediate download depending on the needs and requirements of the user.
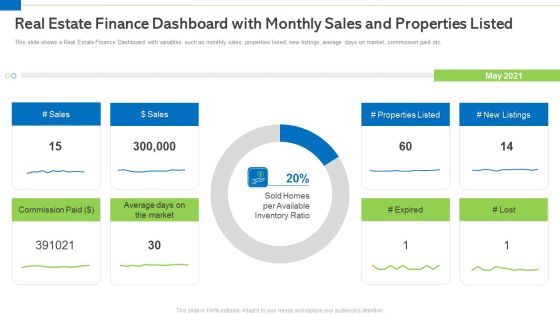
Real Estate Finance Dashboard With Monthly Sales And Properties Listed Portrait PDF
Deliver an awe-inspiring pitch with this creative real estate finance dashboard with monthly sales and properties listed portrait pdf bundle. Topics like sales, commission paid, properties listed, expired can be discussed with this completely editable template. It is available for immediate download depending on the needs and requirements of the user.
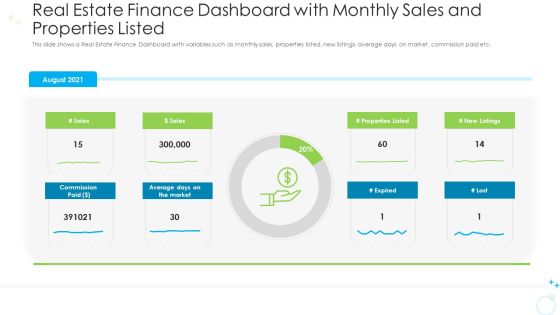
Real Estate Finance Dashboard With Monthly Sales And Properties Listed Ppt Gallery Visual Aids Pdf
Deliver and pitch your topic in the best possible manner with this real estate finance dashboard with monthly sales and properties listed ppt gallery visual aids pdf. Use them to share invaluable insights on average, market, sales and impress your audience. This template can be altered and modified as per your expectations. So, grab it now.

Customer Attrition Dashboard With Monthly Trends Ppt PowerPoint Presentation Show Vector PDF
Showcasing this set of slides titled Customer Attrition Dashboard With Monthly Trends Ppt PowerPoint Presentation Show Vector PDF. The topics addressed in these templates are Total Revenue, Customer Attrition, Customer Churn. All the content presented in this PPT design is completely editable. Download it and make adjustments in color, background, font etc. as per your unique business setting.

Packaging And Delivering Dashboard With Monthly Key Performance Metrics Microsoft PDF
The following slide showcases dashboard of supply chain with order status key metrics. Main KPIs covered are volume today, global financial performance and inventory. Pitch your topic with ease and precision using this Packaging And Delivering Dashboard With Monthly Key Performance Metrics Microsoft PDF. This layout presents information on Customer, Global Financial Performance, Inventory Distribution. It is also available for immediate download and adjustment. So, changes can be made in the color, design, graphics or any other component to create a unique layout.

Monthly Project Progress Details Dashboard Ppt PowerPoint Presentation Gallery Clipart PDF
The slide presents a dashboard showing progress status of project. It includes task timeline, status, priority, budget and pending items. Showcasing this set of slides titled Monthly Project Progress Details Dashboard Ppt PowerPoint Presentation Gallery Clipart PDF. The topics addressed in these templates are Goals Approval, Technical Applications, Task Priority. All the content presented in this PPT design is completely editable. Download it and make adjustments in color, background, font etc. as per your unique business setting.

Monthly Project Progress Details Dashboard To Monitor Work Progress Ppt Summary Design Templates PDF
The slide shows a dashboard for project progress management. It includes gross margin, billing utilization, invoiced, active users, scope delivered, quality, risks, etc. Showcasing this set of slides titled Monthly Project Progress Details Dashboard To Monitor Work Progress Ppt Summary Design Templates PDF. The topics addressed in these templates are Scope Delivered, Quality, Risks. All the content presented in this PPT design is completely editable. Download it and make adjustments in color, background, font etc. as per your unique business setting.
Streamlining Manufacturing Processes With Workflow Automation Dashboard For Monthly Procurement Process Automated Workflow Icons PDF
This slide presents a dashboard for monthly procurement activities in an organization. It includes number of suppliers, contract attainted, supplier share, top supplier report, average procurement cycle time, etc. Slidegeeks is here to make your presentations a breeze with Streamlining Manufacturing Processes With Workflow Automation Dashboard For Monthly Procurement Process Automated Workflow Icons PDF With our easy-to-use and customizable templates, you can focus on delivering your ideas rather than worrying about formatting. With a variety of designs to choose from, you are sure to find one that suits your needs. And with animations and unique photos, illustrations, and fonts, you can make your presentation pop. So whether you are giving a sales pitch or presenting to the board, make sure to check out Slidegeeks first
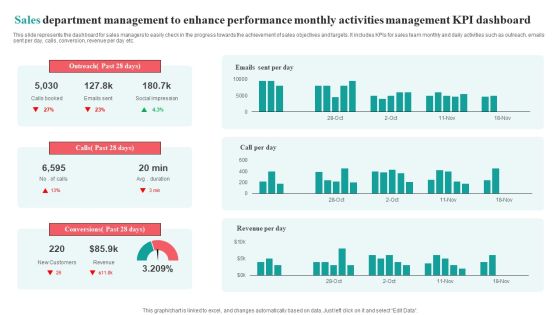
Sales Department Management To Enhance Performance Monthly Activities Management KPI Dashboard Brochure PDF
This slide represents the dashboard for sales managers to easily check in the progress towards the achievement of sales objectives and targets. It includes KPIs for sales team monthly and daily activities such as outreach, emails sent per day, calls, conversion, revenue per day etc.Pitch your topic with ease and precision using this Sales Department Management To Enhance Performance Monthly Activities Management KPI Dashboard Brochure PDF. This layout presents information on Social Impression, Conversions Past, Outreach Past. It is also available for immediate download and adjustment. So, changes can be made in the color, design, graphics or any other component to create a unique layout.

Monthly Real Estate Sales Dashboard For Real Estate Business Ppt PowerPoint Presentation File Skills PDF
This slide showcases property sales dashboard to track progress and communicate key development to management. It further includes details such as US sales, target per employee, top selling segments, etc. Showcasing this set of slides titled Monthly Real Estate Sales Dashboard For Real Estate Business Ppt PowerPoint Presentation File Skills PDF. The topics addressed in these templates are Top 5 Sales Segments, Sold Units By State, Top 10 Projects, Sales Vs Target Per Agent. All the content presented in this PPT design is completely editable. Download it and make adjustments in color, background, font etc. as per your unique business setting.
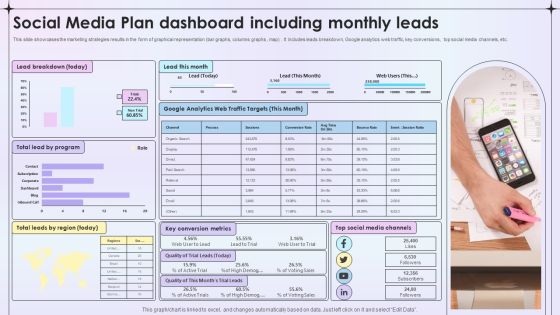
Social Media Plan Dashboard Including Monthly Leads Ppt File Slides PDF
This slide showcases the marketing strategies results in the form of graphical representation bar graphs, columns graphs , map. It includes leads breakdown, Google analytics web traffic, key conversions , top social media channels, etc. Showcasing this set of slides titled Social Media Plan Dashboard Including Monthly Leads Ppt File Slides PDF. The topics addressed in these templates are Lead Breakdown, Key Conversion Metrics, Social Media Channels. All the content presented in this PPT design is completely editable. Download it and make adjustments in color, background, font etc. as per your unique business setting.
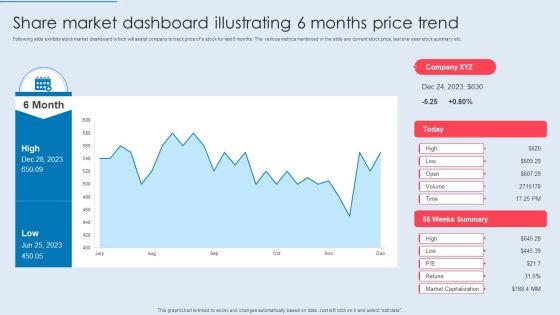
Share Market Dashboard Illustrating 6 Months Price Trend Ideas PDF
Following slide exhibits stock market dashboard which will assist company to track price of a stock for last 6 months. The various metrics mentioned in the slide are current stock price, last one year stock summary etc. Showcasing this set of slides titled Share Market Dashboard Illustrating 6 Months Price Trend Ideas PDF. The topics addressed in these templates are Share Market, Dashboard Illustrating, Months Price Trend. All the content presented in this PPT design is completely editable. Download it and make adjustments in color, background, font etc. as per your unique business setting.

Monthly Sales Reporting And Projections Dashboard Icon Ppt Icon Clipart Images PDF
Persuade your audience using this Monthly Sales Reporting And Projections Dashboard Icon Ppt Icon Clipart Images PDF. This PPT design covers three stages, thus making it a great tool to use. It also caters to a variety of topics including Monthly Sale,s Reporting And Projections, Dashboard Icon. Download this PPT design now to present a convincing pitch that not only emphasizes the topic but also showcases your presentation skills.

Dashboard Showing Website Monthly User Behavior Ppt PowerPoint Presentation File Professional PDF
Presenting this set of slides with name dashboard showing website monthly user behavior ppt powerpoint presentation file professional pdf. The topics discussed in these slides are performing, impressions, average. This is a completely editable PowerPoint presentation and is available for immediate download. Download now and impress your audience.

Dashboard For Managing Monthly Social Media Marketing Plan And Boost Post Themes PDF
The following slide presents a plan management dashboard for effectively manage and supervise social media monthly plan. It includes key elements such as published, post, type, targeting, reach, engagement and promote. Showcasing this set of slides titled Dashboard For Managing Monthly Social Media Marketing Plan And Boost Post Themes PDF. The topics addressed in these templates are Published, Targeting, Engagement. All the content presented in this PPT design is completely editable. Download it and make adjustments in color, background, font etc. as per your unique business setting.
Kpi Dashboard For Tracking Monthly Personal Finances Ppt Outline Graphics Example PDF
This slide shows dashboard which can be used by individuals to track monthly expenses in order to get better understanding of his or her finances. It includes metrics such as users spending, savings, debt, etc. Welcome to our selection of the Kpi Dashboard For Tracking Monthly Personal Finances Ppt Outline Graphics Example PDF. These are designed to help you showcase your creativity and bring your sphere to life. Planning and Innovation are essential for any business that is just starting out. This collection contains the designs that you need for your everyday presentations. All of our PowerPoints are 100 percent editable, so you can customize them to suit your needs. This multi purpose template can be used in various situations. Grab these presentation templates today.
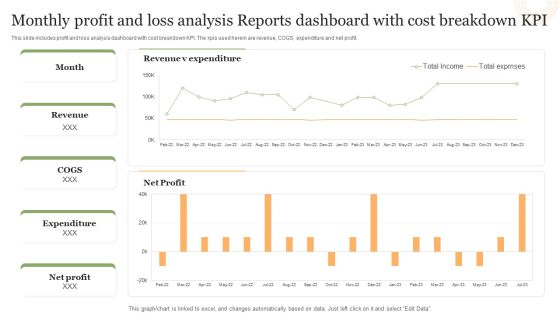
Monthly Profit And Loss Analysis Reports Dashboard With Cost Breakdown Kpi Structure PDF
This slide includes profit and loss analysis dashboard with cost breakdown KPI. The kpis used herein are revenue, COGS, expenditure and net profit.Pitch your topic with ease and precision using this Monthly Profit And Loss Analysis Reports Dashboard With Cost Breakdown Kpi Structure PDF. This layout presents information on Revenue Expenditure, Net Profit, Total Exprnses. It is also available for immediate download and adjustment. So, changes can be made in the color, design, graphics or any other component to create a unique layout.
Process Enhancement Plan To Boost Sales Performance Monthly Sales Performance Tracking And Monitoring Dashboard Professional PDF
This slide showcases a dashboard presenting various metrics to measure and analyze sales performance for revenue growth. It includes key components such as number of sales, revenue, profit, cost, sales revenue, sales increment, cost analysis and cross sell. Create an editable Process Enhancement Plan To Boost Sales Performance Monthly Sales Performance Tracking And Monitoring Dashboard Professional PDF that communicates your idea and engages your audience. Whether youre presenting a business or an educational presentation, pre designed presentation templates help save time. Process Enhancement Plan To Boost Sales Performance Monthly Sales Performance Tracking And Monitoring Dashboard Professional PDF is highly customizable and very easy to edit, covering many different styles from creative to business presentations. Slidegeeks has creative team members who have crafted amazing templates. So, go and get them without any delay.

Monthly Leads Report And Customer Relationship Management Dashboard With Revenue Information PDF
This slide illustrates graphical representation of CRM leads data. It includes revenue, open leads, won leads, cold leads, monthly leads report and leads dough nut graph etc. Pitch your topic with ease and precision using this Monthly Leads Report And Customer Relationship Management Dashboard With Revenue Information PDF. This layout presents information on Monthly Leads Report, Customer Relationship Management, Dashboard With Revenue. It is also available for immediate download and adjustment. So, changes can be made in the color, design, graphics or any other component to create a unique layout.

Dashboard To Track Leaders Competency Level On Monthly Basis Ppt Gallery Vector PDF
The following slide showcases the dashboard to track leaders skill level on monthly basis. Key parameters included here are leaders competency level, competency level on monthly basis etc. There are so many reasons you need a Dashboard To Track Leaders Competency Level On Monthly Basis Ppt Gallery Vector PDF. The first reason is you cannot spend time making everything from scratch, Thus, Slidegeeks has made presentation templates for you too. You can easily download these templates from our website easily.
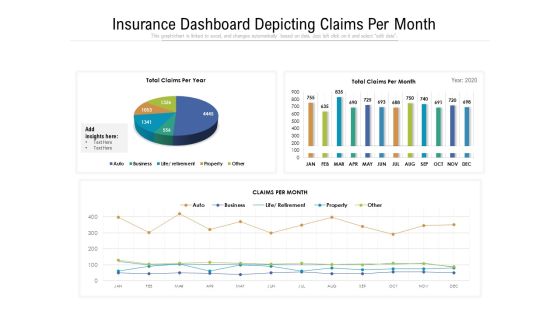
Insurance Dashboard Depicting Claims Per Month Ppt PowerPoint Presentation Show PDF
Pitch your topic with ease and precision using this insurance dashboard depicting claims per month ppt powerpoint presentation show example pdf. This layout presents information on property, business, sales. It is also available for immediate download and adjustment. So, changes can be made in the color, design, graphics or any other component to create a unique layout.
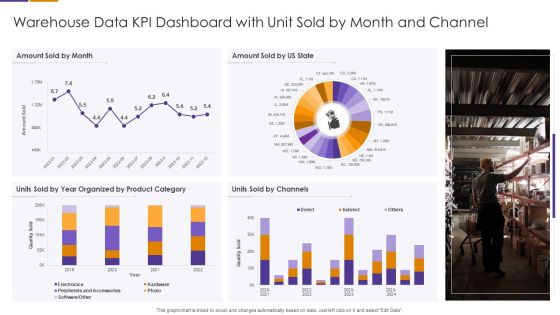
Warehouse Data KPI Dashboard With Unit Sold By Month And Channel Elements PDF
Showcasing this set of slides titled Warehouse Data KPI Dashboard With Unit Sold By Month And Channel Elements PDF The topics addressed in these templates are Organized By Product Category, Units Sold By Channels, Peripherals And Accessories All the content presented in this PPT design is completely editable. Download it and make adjustments in color, background, font etc. as per your unique business setting.

Consumer Statistics Dashboard Showing Sales Analysis By Month Ppt PowerPoint Presentation Icon Inspiration PDF
Presenting this set of slides with name consumer statistics dashboard showing sales analysis by month ppt powerpoint presentation icon inspiration pdf. The topics discussed in these slides are sales, analysis, growth. This is a completely editable PowerPoint presentation and is available for immediate download. Download now and impress your audience.

HR Recruitment Dashboard Kpis With Hires Per Month Ppt Slides Portfolio PDF
This slide showcases the recruitment dashboard of KPIs to know hiring from different sources. It include metrics like hires by department, per month, candidate feedback, offer acceptance rate, interview activity. Pitch your topic with ease and precision using this HR Recruitment Dashboard Kpis With Hires Per Month Ppt Slides Portfolio PDF. This layout presents information on HR Recruitment, Dashboard Kpis, Business Development. It is also available for immediate download and adjustment. So, changes can be made in the color, design, graphics or any other component to create a unique layout.
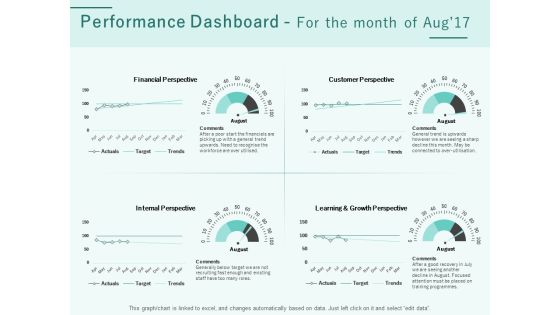
Progress Assessment Outline Performance Dashboard For The Month Of Aug 17 Ppt PowerPoint Presentation Model Clipart Images PDF
Presenting this set of slides with name progress assessment outline performance dashboard for the month of aug 17 ppt powerpoint presentation model clipart images pdf. The topics discussed in these slides are financial perspective, customer perspective, internal perspective, learning and growth perspective. This is a completely editable PowerPoint presentation and is available for immediate download. Download now and impress your audience.
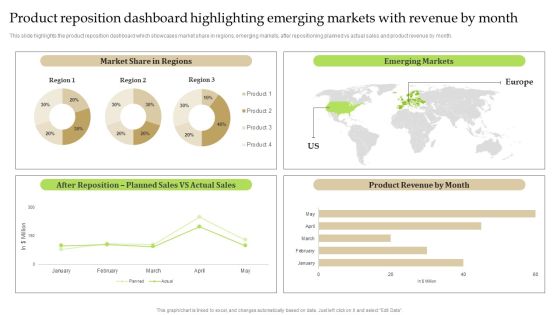
Product Reposition Dashboard Highlighting Emerging Markets With Revenue By Month Brochure PDF
This slide highlights the product reposition dashboard which showcases market share in regions, emerging markets, after repositioning planned vs actual sales and product revenue by month. Are you searching for a Product Reposition Dashboard Highlighting Emerging Markets With Revenue By Month Brochure PDF that is uncluttered, straightforward, and original Its easy to edit, and you can change the colors to suit your personal or business branding. For a presentation that expresses how much effort you have put in, this template is ideal. With all of its features, including tables, diagrams, statistics, and lists, its perfect for a business plan presentation. Make your ideas more appealing with these professional slides. Download Product Reposition Dashboard Highlighting Emerging Markets With Revenue By Month Brochure PDF from Slidegeeks today.
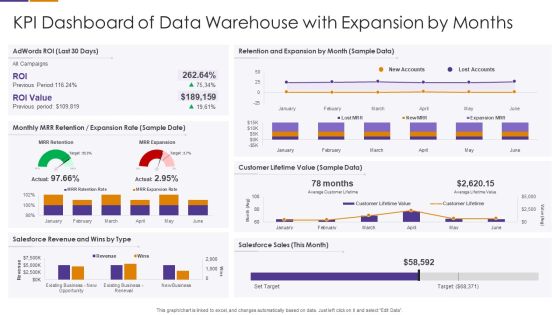
KPI Dashboard Of Data Warehouse With Expansion By Months Themes PDF
Showcasing this set of slides titled KPI Dashboard Of Data Warehouse With Expansion By Months Themes PDF The topics addressed in these templates are Customer Lifetime Value, Salesforce Revenue, Retention And Expansion All the content presented in this PPT design is completely editable. Download it and make adjustments in color, background, font etc. as per your unique business setting.
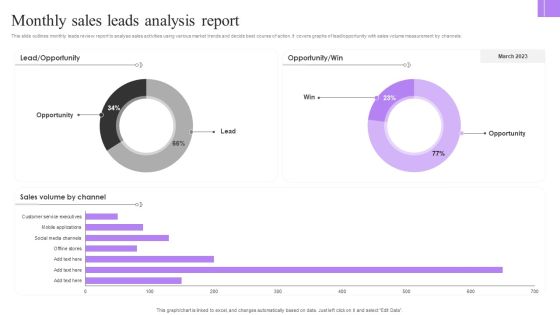
Monthly Sales Leads Analysis Report Clipart PDF
This slide outlines monthly leads review report to analyse sales activities using various market trends and decide best course of action. It covers graphs of lead opportunity with sales volume measurement by channels. Showcasing this set of slides titled Monthly Sales Leads Analysis Report Clipart PDF. The topics addressed in these templates are Lead, Opportunity, Win. All the content presented in this PPT design is completely editable. Download it and make adjustments in color, background, font etc. as per your unique business setting.
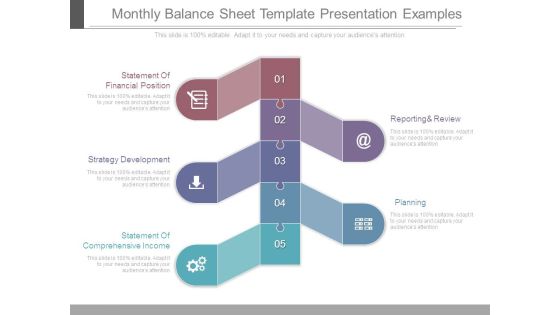
Monthly Balance Sheet Template Presentation Examples
This is a monthly balance sheet template presentation examples. This is a five stage process. The stages in this process are statement of financial position, strategy development, statement of comprehensive income, reporting and review, planning.

Monthly Reporting Procedure Best Practices Pictures PDF
This slide mentions the practices to be carried out on a monthly basis to ensure robust reporting process. It includes ensuring weekly data collection, data accessibility, leveraging ERP integration and scheduling. Persuade your audience using this Monthly Reporting Procedure Best Practices Pictures PDF. This PPT design covers four stages, thus making it a great tool to use. It also caters to a variety of topics including Data Accessibility, Leverage ERP Integration, Scheduling. Download this PPT design now to present a convincing pitch that not only emphasizes the topic but also showcases your presentation skills.
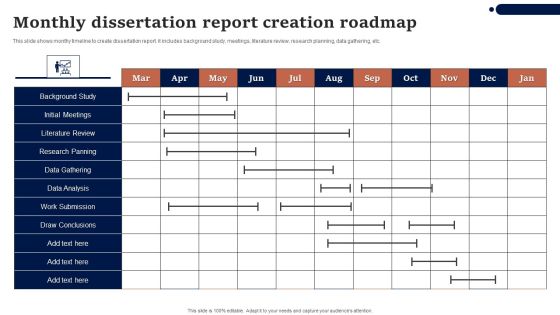
Monthly Dissertation Report Creation Roadmap Background PDF
This slide shows monthy timeline to create dissertation report. it includes background study, meetings, literature review, research planning, data gathering, etc. Pitch your topic with ease and precision using this Monthly Dissertation Report Creation Roadmap Background PDF. This layout presents information on Data Gathering, Data Analysis, Research Panning. It is also available for immediate download and adjustment. So, changes can be made in the color, design, graphics or any other component to create a unique layout.

Monthly Company Performance Analysiscompetitor Analysis Pictures PDF
This graph or chart is linked to excel, and changes automatically based on data. Just left click on it and select Edit Data. Deliver and pitch your topic in the best possible manner with this monthly company performance analysiscompetitor analysis pictures pdf. Use them to share invaluable insights on revenue, competitor analysis and impress your audience. This template can be altered and modified as per your expectations. So, grab it now.
Monthly Services Business Marketing Strategy Implementation Timeline Professional PDF
Following slide demonstrates dashboard for monitoring services company sales strategy impact on maximizing business profits. It includes elements such as number of sales, revenue, profit, cost, monthly sales revenue, cost breakdown, up and cross sell, revenue collected and sales by communication channel. Showcasing this set of slides titled Monthly Services Business Marketing Strategy Implementation Timeline Professional PDF. The topics addressed in these templates are Strategy, Lead Generation, Customer Retention. All the content presented in this PPT design is completely editable. Download it and make adjustments in color, background, font etc. as per your unique business setting.
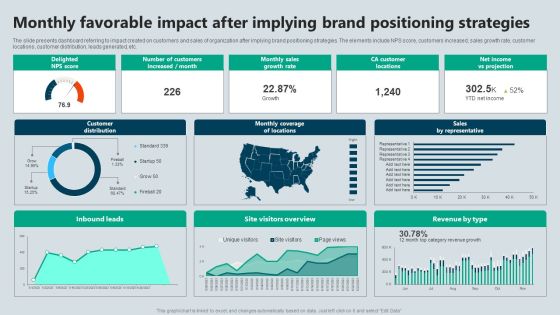
Monthly Favorable Impact After Implying Brand Positioning Strategies Demonstration PDF
The slide presents dashboard referring to impact created on customers and sales of organization after implying brand positioning strategies. The elements include NPS score, customers increased, sales growth rate, customer locations, customer distribution, leads generated, etc. Pitch your topic with ease and precision using this Monthly Favorable Impact After Implying Brand Positioning Strategies Demonstration PDF. This layout presents information on Strategies, Projection, Growth Rate. It is also available for immediate download and adjustment. So, changes can be made in the color, design, graphics or any other component to create a unique layout.

Monthly Marketing Report Ppt PowerPoint Presentation Complete Deck With Slides
This is a monthly marketing report ppt powerpoint presentation complete deck with slides. This is a one stage process. The stages in this process are business, monthly report, marketing, management, presentation.
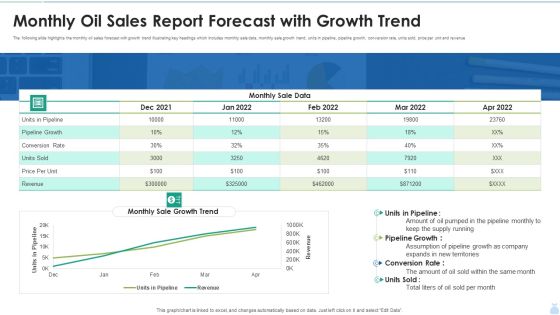
Monthly Oil Sales Report Forecast With Growth Trend Graphics PDF
The following slide highlights the monthly oil sales forecast with growth trend illustrating key headings which includes monthly sale data, monthly sale growth trend, units in pipeline, pipeline growth, conversion rate, units sold, price per unit and revenue. Showcasing this set of slides titled Monthly Oil Sales Report Forecast With Growth Trend Graphics PDF. The topics addressed in these templates are Pipeline Growth, Monthly Sale Data, Conversion Rate. All the content presented in this PPT design is completely editable. Download it and make adjustments in color, background, font etc. as per your unique business setting.
