Monetary Policy

competition comparison table ppt powerpoint presentation infographics design inspiration
This is a competition comparison table ppt powerpoint presentation infographics design inspiration. This is a seven stage process. The stages in this process are revenue, profit, market share, main activity, number of employee.

Break Even Analysis Ppt PowerPoint Presentation Gallery Master Slide
This is a break even analysis ppt powerpoint presentation gallery master slide. This is a two stage process. The stages in this process are total revenue, total costs, variable cost, fixed costs, units sold.

Competitor Analysis Ppt PowerPoint Presentation Ideas Icons
This is a competitor analysis ppt powerpoint presentation ideas icons. This is a seven stage process. The stages in this process are revenue, profit, market share, main activity, number of employee.

Comparison Based On Criteria Ppt PowerPoint Presentation Show Icon
This is a comparison based on criteria ppt powerpoint presentation show icon. This is a six stage process. The stages in this process are revenue, profit, market share, main activity, number of employee.

Comparison Based On Criteria Ppt PowerPoint Presentation Gallery Themes
This is a comparison based on criteria ppt powerpoint presentation gallery themes. This is a seven stage process. The stages in this process are revenue, profit, market share, main activity, product quality.

Comparison Based On Criteria Ppt PowerPoint Presentation Gallery Sample
This is a comparison based on criteria ppt powerpoint presentation gallery sample. This is a six stage process. The stages in this process are revenue, profit, market share, main activity, number of employee.

Comparison Based On Criteria Ppt PowerPoint Presentation Show File Formats
This is a comparison based on criteria ppt powerpoint presentation show file formats. This is a six stage process. The stages in this process are revenue, profit, market share, main activity, number of employee.
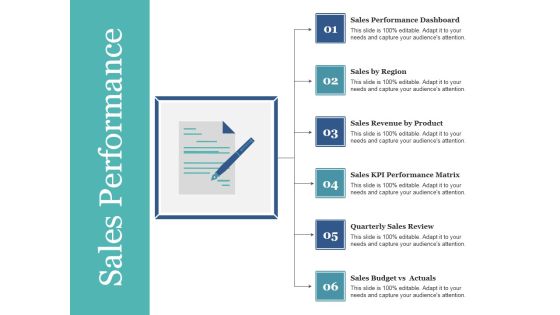
Sales Performance Ppt PowerPoint Presentation Summary Influencers
This is a sales performance ppt powerpoint presentation summary influencers. This is a six stage process. The stages in this process are sales performance dashboard, sales by region, sales revenue by product, sales kpi performance matrix, quarterly sales review.

Comparison Based On Criteria Ppt PowerPoint Presentation Show Background Image
This is a comparison based on criteria ppt powerpoint presentation show background image. This is a seven stage process. The stages in this process are revenue, market share, main activity, number of employees, product quality, insert your own text.

Comparison Based On Criteria Ppt PowerPoint Presentation File Templates
This is a comparison based on criteria ppt powerpoint presentation file templates. This is a seven stage process. The stages in this process are revenue, market share, main activity, number of employees, product quality, insert your own text.

Actual Vs Target Variance Ppt PowerPoint Presentation Gallery Background
This is a actual vs target variance ppt powerpoint presentation gallery background. This is a eight stage process. The stages in this process are Cost, Budget, Variation, Revenue, Budget.

Break Even Analysis Ppt PowerPoint Presentation Model Example File
This is a break even analysis ppt powerpoint presentation model example file. This is a six stage process. The stages in this process are gross revenue, variable expenses, contribution, fixed expenses, break even point.

Break Even Analysis Ppt PowerPoint Presentation Layouts Rules
This is a break even analysis ppt powerpoint presentation layouts rules. This is a six stage process. The stages in this process are gross revenue, variable expenses, contribution, fixed expenses.

Comparison Based On Criteria Ppt PowerPoint Presentation Infographic Template Graphic Tips
This is a comparison based on criteria ppt powerpoint presentation infographic template graphic tips. This is a seven stage process. The stages in this process are revenue, market share, main activity, number of employee, product quality.

Customer Success Vs Customer Service Ppt PowerPoint Presentation Summary Objects
This is a customer success vs customer service ppt powerpoint presentation summary objects. This is a two stage process. The stages in this process are proactive, customer goal achievement, driving customer value from product, long term perspective, revenue generating.
Roadmap With Year Based Timeline And Icons Powerpoint Slides
This infographic roadmap template can be used for multiple purposes including financial planning, new milestones and tasks. It contains year based timeline diagram. Download this PowerPoint timeline template to make impressive presentations.
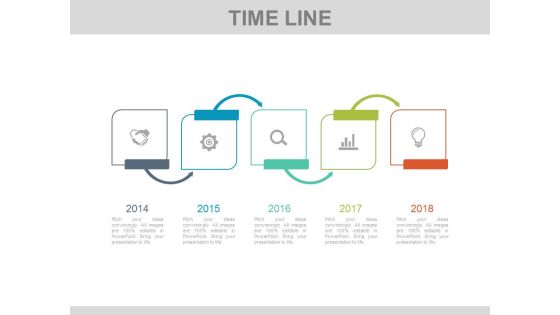
Five Steps Linear Timeline Infographic Diagram Powerpoint Slides
This infographic timeline template can be used for multiple purposes including financial planning, new milestones and tasks. It contains linear timeline infographic diagram. Download this PowerPoint timeline template to make impressive presentations.
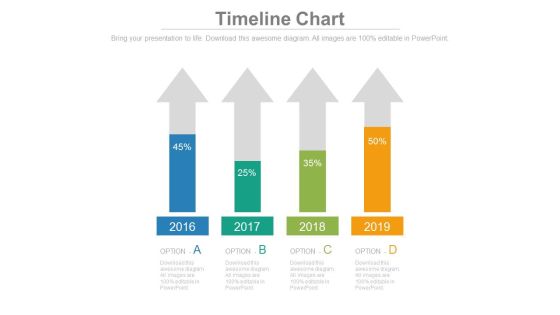
Four Arrows With Percentage Data Analysis Powerpoint Slides
This timeline template can be used for multiple purposes including financial planning, new milestones and tasks. It contains four upward arrows with percentage values. Download this PowerPoint timeline template to make impressive presentations.

Data Collection Form Requirements Ppt Examples Slides
This is a data collection form requirements ppt examples slides. This is a seven stage process. The stages in this process are personal details, basic financial details, cash flow, insurance, estate planning, qualitative information, attitude to risk.

Short Term Vs Long Term Objectives Ppt PowerPoint Presentation Clipart
This is a short term vs long term objectives ppt powerpoint presentation clipart. This is a two stage process. The stages in this process are long term objectives, financial plan.

4 Key Project Management Responsibilities To Legal Services Rules PDF
This slide provides the glimpse about the legal market, regulatory and commercial factors which defines, plans, delivers and close the legal projects. This is a 4 key project management responsibilities to legal services rules pdf template with various stages. Focus and dispense information on four stages using this creative set, that comes with editable features. It contains large content boxes to add your information on topics like requirements, quality, metrics, pricing, resourcing. You can also showcase facts, figures, and other relevant content using this PPT layout. Grab it now.

Occupational Health And Safety At Workplace Hazard Prevention And Control Topics PDF
This slide highlights the hard prevention and control measures which includes check control options, select control plan, measure non routine operations and implement hazard controls. Want to ace your presentation in front of a live audience Our Occupational Health And Safety At Workplace Hazard Prevention And Control Topics PDF can help you do that by engaging all the users towards you. Slidegeeks experts have put their efforts and expertise into creating these impeccable powerpoint presentations so that you can communicate your ideas clearly. Moreover, all the templates are customizable, and easy to edit and downloadable. Use these for both personal and commercial use.
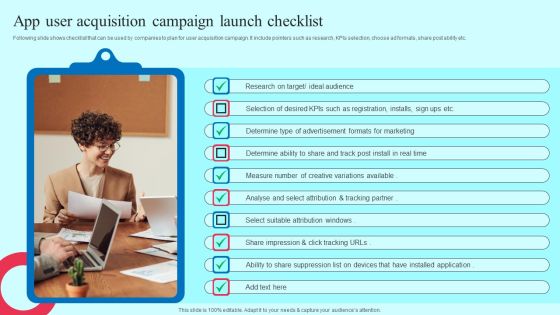
Smartphone Application User Acquisition Techniques App User Acquisition Campaign Launch Checklist Infographics PDF
Following slide shows checklist that can be used by companies to plan for user acquisition campaign. It include pointers such as research, KPIs selection, choose ad formats, share post ability etc. Want to ace your presentation in front of a live audience Our Smartphone Application User Acquisition Techniques App User Acquisition Campaign Launch Checklist Infographics PDF can help you do that by engaging all the users towards you. Slidegeeks experts have put their efforts and expertise into creating these impeccable powerpoint presentations so that you can communicate your ideas clearly. Moreover, all the templates are customizable, and easy to edit and downloadable. Use these for both personal and commercial use.
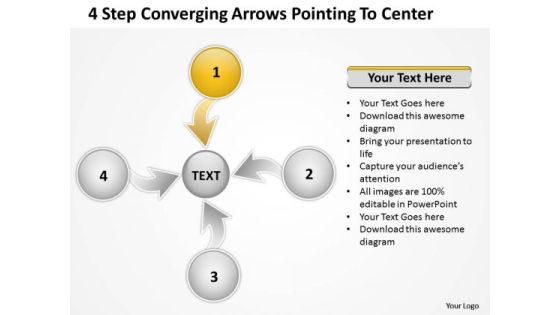
Converging Arrows Poiting To Center Relative Circular Process PowerPoint Templates
We present our converging arrows poiting to center Relative Circular Process PowerPoint templates.Download and present our Arrows PowerPoint Templates because It will Raise the bar of your Thoughts. They are programmed to take you to the next level. Use our Process and Flows PowerPoint Templates because this slide helps you to give your team an overview of your capability and insight into the minute details of the overall picture highlighting the interdependence at every operational level. Download and present our Flow Charts PowerPoint Templates because you have the ability to think out of the box. It helps you maintain your unique identity. Use our Circle Charts PowerPoint Templates because Our PowerPoint Templates and Slides will give you great value for your money. Be assured of finding the best projection to highlight your words. Use our Marketing PowerPoint Templates because clarity of thought has been the key to your growth.Use these PowerPoint slides for presentations relating to Arrow, blue, business, chart,check, circle, concept, control, cycle,design, development, diagram, do,engineering, evaluate, flow, flowchart,flowchart, graphic, idea,infographic, iterative, lifecycle, lifecycle,management, marble, method, model, plandocheckact, process,quality, red, research, schema, software,spiral, step, strategy, success, system,. The prominent colors used in the PowerPoint template are Yellow, Black, White. Use our converging arrows poiting to center Relative Circular Process PowerPoint templates will make the presenter look like a pro even if they are not computer savvy. Professionals tell us our check PowerPoint templates and PPT Slides are Wonderful. Customers tell us our converging arrows poiting to center Relative Circular Process PowerPoint templates are Elevated. Presenters tell us our concept PowerPoint templates and PPT Slides are Swanky. You can be sure our converging arrows poiting to center Relative Circular Process PowerPoint templates are Great. PowerPoint presentation experts tell us our check PowerPoint templates and PPT Slides are Nostalgic.
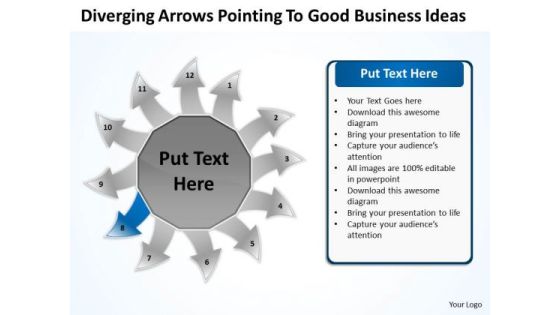
PowerPoint Presentation Ideas Ppt Relative Circular Flow Arrow Diagram Templates
We present our powerpoint presentation ideas ppt Relative Circular Flow Arrow Diagram templates.Use our Communication PowerPoint Templates because there are so many different pieces to the puzzle. Use our Arrows PowerPoint Templates because they enhance the essence of your viable ideas. Use our Circle Charts PowerPoint Templates because they are Gauranteed to focus the minds of your team. Use our Business PowerPoint Templates because your product has established a foothold in the market. Customers are happy with the value it brings to their lives. Present our Shapes PowerPoint Templates because you can Transmit your passion via our creative templates.Use these PowerPoint slides for presentations relating to Arrow, Bio, Business, Chart, Circle, Concept, Control, Cycle, Design, Development, Diagram, Eco, Ecology, Environmental, Evaluate, Flow, Flowchart, Fresh, Graphic, Green, Idea, Infographic, Iterative, Life, Lifecycle, Management, Method, Model, Natural, Nature, Organic, Process, Quality, Recycle, Research, Schema, Spiral, Step, Strategy, Success, System. The prominent colors used in the PowerPoint template are Blue, Gray, Black. Customers tell us our powerpoint presentation ideas ppt Relative Circular Flow Arrow Diagram templates provide great value for your money. Be assured of finding the best projection to highlight your words. Customers tell us our Chart PowerPoint templates and PPT Slides are Fabulous. Presenters tell us our powerpoint presentation ideas ppt Relative Circular Flow Arrow Diagram templates are Glamorous. PowerPoint presentation experts tell us our Cycle PowerPoint templates and PPT Slides are Great. Customers tell us our powerpoint presentation ideas ppt Relative Circular Flow Arrow Diagram templates are Stylish. Professionals tell us our Design PowerPoint templates and PPT Slides will get their audience's attention.
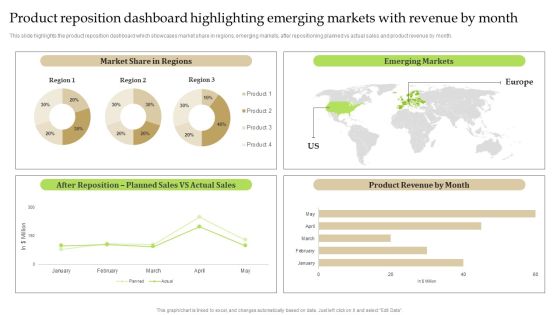
Product Reposition Dashboard Highlighting Emerging Markets With Revenue By Month Brochure PDF
This slide highlights the product reposition dashboard which showcases market share in regions, emerging markets, after repositioning planned vs actual sales and product revenue by month. Are you searching for a Product Reposition Dashboard Highlighting Emerging Markets With Revenue By Month Brochure PDF that is uncluttered, straightforward, and original Its easy to edit, and you can change the colors to suit your personal or business branding. For a presentation that expresses how much effort you have put in, this template is ideal. With all of its features, including tables, diagrams, statistics, and lists, its perfect for a business plan presentation. Make your ideas more appealing with these professional slides. Download Product Reposition Dashboard Highlighting Emerging Markets With Revenue By Month Brochure PDF from Slidegeeks today.
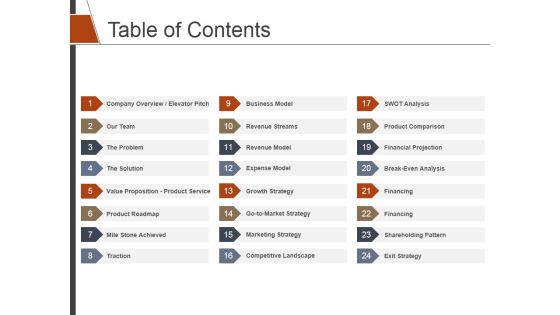
Table Of Contents Ppt PowerPoint Presentation Slides Grid
This is a table of contents ppt powerpoint presentation slides grid. This is a three stage process. The stages in this process are business model, revenue streams, revenue model, expense model, growth strategy, marketing, strategy, financing, product roadmap, traction.

Corporate Loan Approval Requirement For Lenders Background PDF
This slide showcases the minimum requirement details for corporate loan approval from private lenders. It includes requirements such as minimum revenue, business age, credit score, etc. Presenting Corporate Loan Approval Requirement For Lenders Background PDF to dispense important information. This template comprises four stages. It also presents valuable insights into the topics including Mini Business Age, Lenders, Min Revenue. This is a completely customizable PowerPoint theme that can be put to use immediately. So, download it and address the topic impactfully.

Web 3 0 Blockchain Based P2E Mobile Game Sector Report Promotional Plan Kpis For Measuring Marketing Diagrams PDF
The following slide helps organization in understanding the essential KPIs for measuring marketing activities for Web3 P2E based NFT game. These KPIs can be general mobile app KPI, App engagement metrics, revenue- focused mobile KPI and all store Kpis. Find highly impressive Web 3 0 Blockchain Based P2E Mobile Game Sector Report Promotional Plan Kpis For Measuring Marketing Diagrams PDF on Slidegeeks to deliver a meaningful presentation. You can save an ample amount of time using these presentation templates. No need to worry to prepare everything from scratch because Slidegeeks experts have already done a huge research and work for you. You need to download Web 3 0 Blockchain Based P2E Mobile Game Sector Report Promotional Plan Kpis For Measuring Marketing Topics PDF for your upcoming presentation. All the presentation templates are 100 percent editable and you can change the color and personalize the content accordingly. Download now.

Mitigating Sales Risks With Strategic Action Planning Key Metrics To Assess Effectiveness Of Sales Risk Analysis Rules PDF
The following slide highlights some key performance indicators to measure the effectiveness of sales risk evaluation on revenue performance. It includes elements such as opportunities, win rate, average time to win, sales velocity along with key insights etc. Create an editable Mitigating Sales Risks With Strategic Action Planning Key Metrics To Assess Effectiveness Of Sales Risk Analysis Rules PDF that communicates your idea and engages your audience. Whether youre presenting a business or an educational presentation, pre designed presentation templates help save time. Mitigating Sales Risks With Strategic Action Planning Key Metrics To Assess Effectiveness Of Sales Risk Analysis Rules PDF is highly customizable and very easy to edit, covering many different styles from creative to business presentations. Slidegeeks has creative team members who have crafted amazing templates. So, go and get them without any delay.

Financial Maximum Medium Ppt PowerPoint Presentation Summary Example
Presenting this set of slides with name financial maximum medium ppt powerpoint presentation summary example. The topics discussed in these slides are financial, minimum, maximum, marketing, strategy. This is a completely editable PowerPoint presentation and is available for immediate download. Download now and impress your audience.
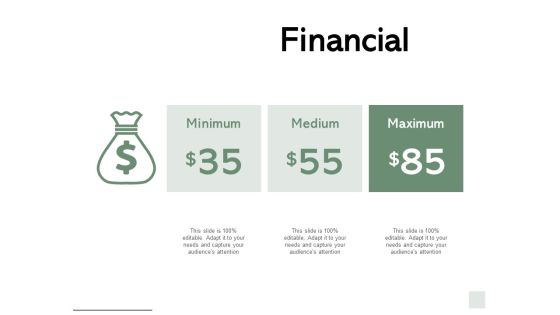
Financial Minimum Medium Ppt PowerPoint Presentation Professional Design Ideas
Presenting this set of slides with name financial minimum medium ppt powerpoint presentation professional design ideas. This is a three stage process. The stages in this process are financial, minimum, maximum, marketing, strategy. This is a completely editable PowerPoint presentation and is available for immediate download. Download now and impress your audience.

Financial Maximum Medium Ppt PowerPoint Presentation Infographics Background Designs
Presenting this set of slides with name financial maximum medium ppt powerpoint presentation infographics background designs. This is a three stage process. The stages in this process are financial, minimum, maximum, marketing, strategy. This is a completely editable PowerPoint presentation and is available for immediate download. Download now and impress your audience.
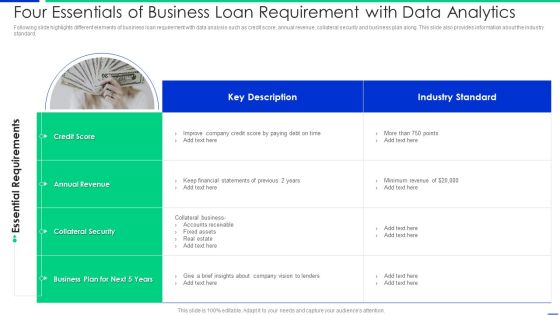
Four Essentials Of Business Loan Requirement With Data Analytics Information PDF
Following slide highlights different elements of business loan requirement with data analysis such as credit score, annual revenue, collateral security and business plan along. This slide also provides information about the industry standard Showcasing this set of slides titled four essentials of business loan requirement with data analytics information pdf. The topics addressed in these templates are financial, collateral security, annual revenue. All the content presented in this PPT design is completely editable. Download it and make adjustments in color, background, font etc. as per your unique business setting.
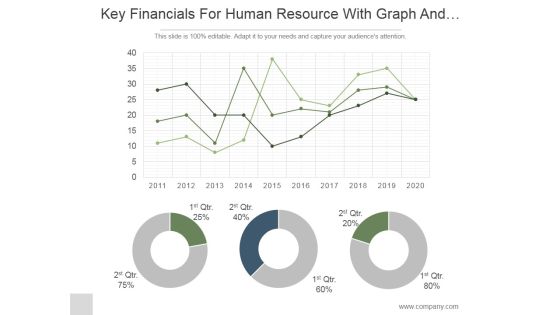
Key Financials For Human Resource With Graph And Pie Chart Ppt PowerPoint Presentation Ideas
This is a key financials for human resource with graph and pie chart ppt powerpoint presentation ideas. This is a three stage process. The stages in this process are business, strategy, marketing, analysis, donut, growth.

Financial Projection Graph Template 2 Ppt PowerPoint Presentation Infographic Template Gallery
This is a financial projection graph template 2 ppt powerpoint presentation infographic template gallery. This is a three stage process. The stages in this process are business, bar graph, finance, marketing, strategy, analysis.

Roles And Activities Of Private Wealth Administration Manager Graphics PDF
The following slide showcases role of wealth manager that allows individual to attain all possible goals in systematic manner. It presents information related to financial planning, risk management, etc. Persuade your audience using this Roles And Activities Of Private Wealth Administration Manager Graphics PDF. This PPT design covers six stages, thus making it a great tool to use. It also caters to a variety of topics including Financial Planning, Investment Management, Tax Planning. Download this PPT design now to present a convincing pitch that not only emphasizes the topic but also showcases your presentation skills.

3d Stages Of Process Analysis 8 Concepts Circular Flow Chart PowerPoint Slides
We present our 3d stages of process analysis 8 concepts Circular Flow Chart PowerPoint Slides.Use our Business PowerPoint Templates because it helps you to project your enthusiasm and single mindedness to your colleagues. Present our Circle Charts PowerPoint Templates because you should explain the process by which you intend to right it. Present our Shapes PowerPoint Templates because it outlines the process with this innovative graphic to authenticate your plan of achieving the goal of added value/profit. Present our Process and Flows PowerPoint Templates because it shows how one can contribute to the overall feeling of well-being. Download our Success PowerPoint Templates because iT outlines the entire thought process for the benefit of others. Tell it to the world with your characteristic aplomb.Use these PowerPoint slides for presentations relating to Abstract, arrow,blank, business, chart, circle, concept,connection, cycle, development,diagram, direction, element,environment, exchange, finance,financial, flow, graph, graphic, graphicpresentation, group, icon, illustration,investment, isolated, isometric, market,motion, movement, organization, p perspective, presentation,process, processchart, recycle, report,ring, sign, step, stock, success, symbol. The prominent colors used in the PowerPoint template are Blue light, Gray, White. The feedback we get is that our 3d stages of process analysis 8 concepts Circular Flow Chart PowerPoint Slides are Enchanting. The feedback we get is that our concept PowerPoint templates and PPT Slides are Clever. Presenters tell us our 3d stages of process analysis 8 concepts Circular Flow Chart PowerPoint Slides are Vintage. The feedback we get is that our blank PowerPoint templates and PPT Slides are Clever. PowerPoint presentation experts tell us our 3d stages of process analysis 8 concepts Circular Flow Chart PowerPoint Slides are Adorable. Customers tell us our concept PowerPoint templates and PPT Slides are Ultra.

Circle Chart For Value Analysis Powerpoint Slides
This PowerPoint template has been designed for business presentations and corporate slides. The PowerPoint template has a high quality design. You can download this PowerPoint slide for corporate presentations or annual meeting and business plans.

Target Chart For Strategic Management Process Powerpoint Slides
This PowerPoint template has been designed with four steps target chart. The PowerPoint template may be used to display strategic management process. You can download this PowerPoint slide for corporate presentations or annual meeting and business plans.
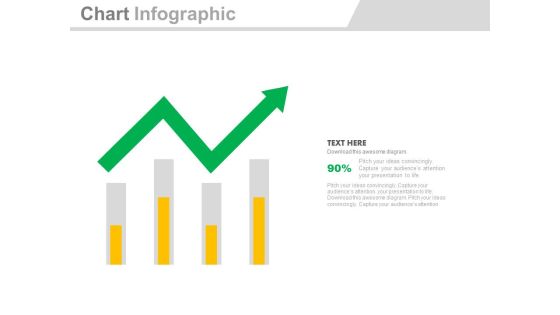
Four Bars With Green Growth Arrow Powerpoint Slides
Four bars with green arrow have been displayed in this business slide. This business diagram helps to exhibit process of business planning. Use this diagram to build an exclusive presentation.
Four Linear Steps And Icons Powerpoint Slides
This PPT slide has been designed with four linear text boxes with icons. This PowerPoint template helps to exhibit process of business planning. Use this diagram slide to build an exclusive presentation.
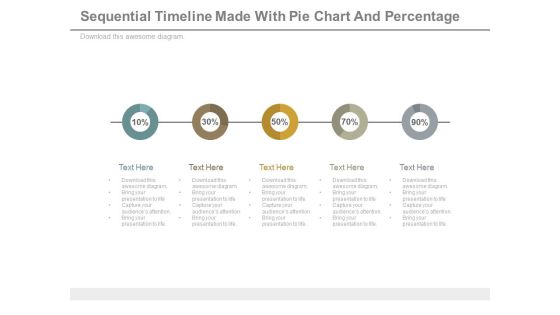
Sequential Timeline Diagram With Percentage Values Powerpoint Slides
This diagram contains graphics of linear circles timeline diagram. Download this diagram slide to display business planning and management. This diagram is editable you can edit text, color, shade and style as per you need.
Text Tags And Icons With Percentage Values Powerpoint Slides
This PowerPoint template has been designed with graphics of text tags, icons and percentage values. Download this business diagram to outline business plan. Present your views and ideas with this impressive design.

Key Performance Indicator Analytics Dashboard Ppt PowerPoint Presentation Model Example Topics
This is a key performance indicator analytics dashboard ppt powerpoint presentation model example topics. This is a five stage process. The stages in this process are kpi proposal, kpi plan, kpi scheme.
KPI Metrics Vector Icon Ppt PowerPoint Presentation Layouts Slide
This is a kpi metrics vector icon ppt powerpoint presentation layouts slide. This is a three stage process. The stages in this process are kpi proposal, kpi plan, kpi scheme.

Developing Content Marketing Roles And Responsibilities Of Content Marketing Download PDF
This slide focuses on roles and responsibilities of content marketing team which includes chief content officer, content strategy director, project manager, planning manager, audience development manager, etc. Make sure to capture your audiences attention in your business displays with our gratis customizable Developing Content Marketing Roles And Responsibilities Of Content Marketing Download PDF. These are great for business strategies, office conferences, capital raising or task suggestions. If you desire to acquire more customers for your tech business and ensure they stay satisfied, create your own sales presentation with these plain slides.

Business Company Dashboards Ppt Powerpoint Slide Show
This is a business company dashboards ppt powerpoint slide show. This is a four stage process. The stages in this process are presentation, finance, management, business, strategy, success.
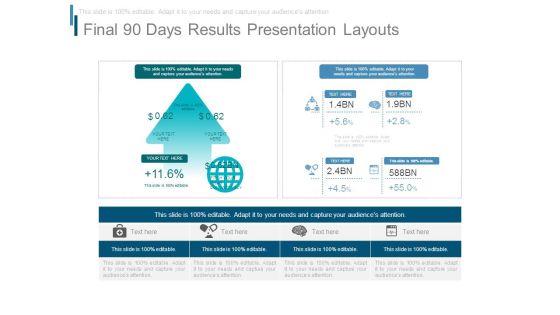
Final 90 Days Results Presentation Layouts
This is a final 90 days results presentation layouts. This is a two stage process. The stages in this process are business, marketing, management, strategy, presentation.
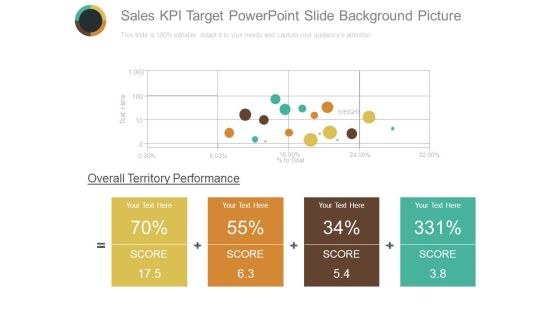
Sales Kpi Target Powerpoint Slide Background Picture
This is a sales kpi target powerpoint slide background picture. This is a four stage process. The stages in this process are business, management, marketing, finance, strategy.

Product Development Analysis Bar Graph Powerpoint Themes
This is a product development analysis bar graph powerpoint themes. This is a five stage process. The stages in this process are business, growth, strategy, management, pretention.

Key Driver Analysis For Sales Presentation Backgrounds
This is a key driver analysis for sales presentation backgrounds. This is a four stage process. The stages in this process are business, marketing, currency, strategy, management.

Business Model With Percentage Analysis Sample Ppt Presentation
This is a business model with percentage analysis sample ppt presentation. This is a three stage process. The stages in this process are business, success, strategy, finance, marketing.

Company Introduction Ppt PowerPoint Presentation Tips
This is a company introduction ppt powerpoint presentation tips. This is a one stage process. The stages in this process are business, about us, company introduction, marketing, strategy.

Marketing Road Map Ppt PowerPoint Presentation Ideas
This is a marketing road map ppt powerpoint presentation ideas. This is a four stage process. The stages in this process are business, percentage, marketing, strategy, success.
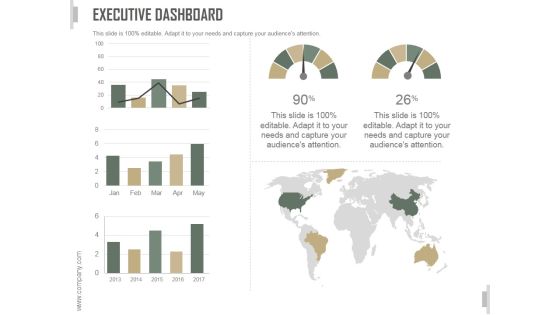
Executive Dashboard Ppt PowerPoint Presentation Examples
This is a executive dashboard ppt powerpoint presentation examples. This is a two stage process. The stages in this process are business, strategy, marketing, dashboard, location, bar chart.

Projected Quarterly Sales Ppt PowerPoint Presentation Files
This is a projected quarterly sales ppt powerpoint presentation files. This is a six stage process. The stages in this process are business, strategy, marketing, analysis, liner process.
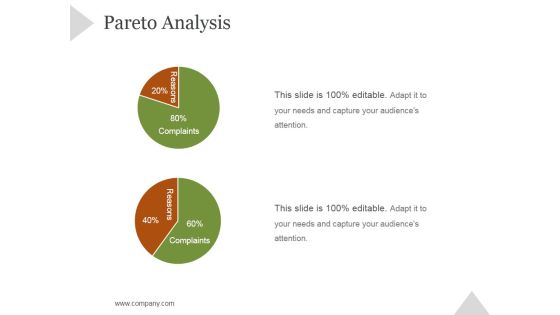
Pareto Analysis Ppt PowerPoint Presentation Design Ideas
This is a pareto analysis ppt powerpoint presentation design ideas. This is a two stage process. The stages in this process are business, strategy, marketing, success, reason, complaints.
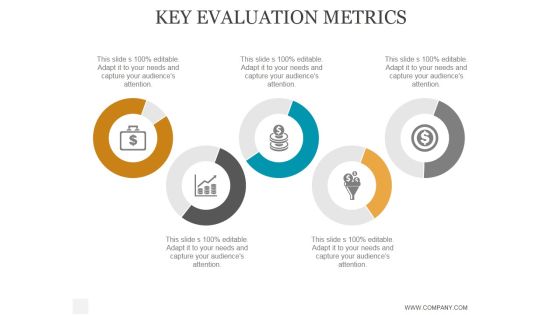
Key Evaluation Metrics Ppt PowerPoint Presentation Portfolio
This is a key evaluation metrics ppt powerpoint presentation portfolio. This is a five stage process. The stages in this process are business, strategy, marketing, analysis, success, icons.
Portfolio Evaluation Template Ppt PowerPoint Presentation Icon
This is a portfolio evaluation template ppt powerpoint presentation icon. This is a five stage process. The stages in this process are business, strategy, marketing, analysis, success, growth.

 Home
Home