Metrics List

Playbook To Formulate Efficient Web Performance Measurement Metrics Diagrams PDF
Mentioned slide shows the major key performance indicators used by organizations to measure their website performance. Metrics covered are related to organic traffic, inbound leads, bounce rate. Slidegeeks has constructed Playbook To Formulate Efficient Web Performance Measurement Metrics Diagrams PDF after conducting extensive research and examination. These presentation templates are constantly being generated and modified based on user preferences and critiques from editors. Here, you will find the most attractive templates for a range of purposes while taking into account ratings and remarks from users regarding the content. This is an excellent jumping-off point to explore our content and will give new users an insight into our top-notch PowerPoint Templates.

Business Referral Marketing Program Performance Metrics Dashboard Introduction PDF
This slide shows KPI dashboard to effectively track performance of business referral program in order to attract more leads and potential customers to the busines. It includes details related to key metrics such as referral participation rate, referred customers, referral conversion rate and total revenue generated. Showcasing this set of slides titled Business Referral Marketing Program Performance Metrics Dashboard Introduction PDF. The topics addressed in these templates are Referral Participation Rate, Referred Customers, Referral Conversion Rate, Total Revenue Generated. All the content presented in this PPT design is completely editable. Download it and make adjustments in color, background, font etc. as per your unique business setting.

Metrics Dashboard To Measure Call Center Success Themes PDF
Mentioned slide outlines a comprehensive KPI dashboard used to measure the call center performance. The dashboard monitors the status of key metrics such as call abandonment levels, current service level, average call length, total calls attended, calls waiting etc. Showcasing this set of slides titled Metrics Dashboard To Measure Call Center Success Themes PDF. The topics addressed in these templates are Center Success, Call Center Status, Call Monitor. All the content presented in this PPT design is completely editable. Download it and make adjustments in color, background, font etc. as per your unique business setting.

Business Analytics Application Employee Engagement Key Performance Metrics Icons PDF
This slide represents key metrics dashboard to analyze the engagement of employees in the organization. It includes details related to KPIs such as engagement score, response rate, net promoter score etc. Formulating a presentation can take up a lot of effort and time, so the content and message should always be the primary focus. The visuals of the PowerPoint can enhance the presenters message, so our Business Analytics Application Employee Engagement Key Performance Metrics Icons PDF was created to help save time. Instead of worrying about the design, the presenter can concentrate on the message while our designers work on creating the ideal templates for whatever situation is needed. Slidegeeks has experts for everything from amazing designs to valuable content, we have put everything into Business Analytics Application Employee Engagement Key Performance Metrics Icons PDF.

Human Resource Analytics Employee Engagement Key Performance Metrics Inspiration PDF
This slide represents key metrics dashboard to analyze the engagement of employees in the organization. It includes details related to KPIs such as engagement score, response rate, net promoter score etc. Crafting an eye-catching presentation has never been more straightforward. Let your presentation shine with this tasteful yet straightforward Human Resource Analytics Employee Engagement Key Performance Metrics Inspiration PDF template. It offers a minimalistic and classy look that is great for making a statement. The colors have been employed intelligently to add a bit of playfulness while still remaining professional. Construct the ideal Human Resource Analytics Employee Engagement Key Performance Metrics Inspiration PDF that effortlessly grabs the attention of your audience Begin now and be certain to wow your customers.

Brand Advertisement Plan Dashboard With Advertising Metrics Inspiration PDF
The following slide showcases marketing plan dashboard to improve the market share of brand and increase revenue. It includes metrics such as brand awareness, commitment, attributes, market share, repeat purchase and frequency profile etc Showcasing this set of slides titled Brand Advertisement Plan Dashboard With Advertising Metrics Inspiration PDF. The topics addressed in these templates are Brand Awareness, Brand Commitment, Awareness. All the content presented in this PPT design is completely editable. Download it and make adjustments in color, background, font etc. as per your unique business setting.
Post Event Activities Tracking Post Event Metrics Status Elements PDF
This slide provides an overview of the status of key metrics. The KPIs covered are the number of attendees, revenue and social media engagement. Whether you have daily or monthly meetings, a brilliant presentation is necessary. Post Event Activities Tracking Post Event Metrics Status Elements PDF can be your best option for delivering a presentation. Represent everything in detail using Post Event Activities Tracking Post Event Metrics Status Elements PDF and make yourself stand out in meetings. The template is versatile and follows a structure that will cater to your requirements. All the templates prepared by Slidegeeks are easy to download and edit. Our research experts have taken care of the corporate themes as well. So, give it a try and see the results.
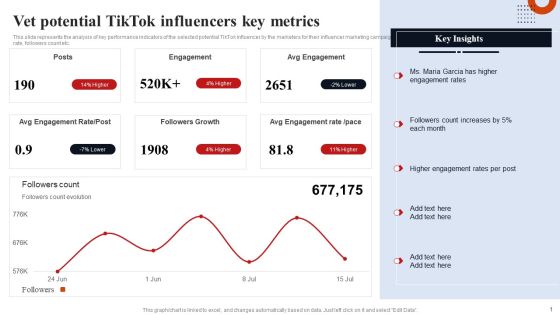
Vet Potential Tiktok Influencers Key Metrics Template PDF
This slide represents the analysis of key performance indicators of the selected potential TikTok influencer by the marketers for their influencer marketing campaign. It includes details related to key metrics such as engagement rate, followers count etc. Explore a selection of the finest Vet Potential Tiktok Influencers Key Metrics Template PDF here. With a plethora of professionally designed and pre made slide templates, you can quickly and easily find the right one for your upcoming presentation. You can use our Vet Potential Tiktok Influencers Key Metrics Template PDF to effectively convey your message to a wider audience. Slidegeeks has done a lot of research before preparing these presentation templates. The content can be personalized and the slides are highly editable. Grab templates today from Slidegeeks.

Brand Awareness Metrics Share Of Voice Ppt Infographics Show PDF
This slide provides information regarding share of voice as brand awareness metrics. It helps in determining online discussion initiated by specific public profile. The slide also include key initiatives to boost share of voice on social media. Here you can discover an assortment of the finest PowerPoint and Google Slides templates. With these templates, you can create presentations for a variety of purposes while simultaneously providing your audience with an eye catching visual experience. Download Brand Awareness Metrics Share Of Voice Ppt Infographics Show PDF to deliver an impeccable presentation. These templates will make your job of preparing presentations much quicker, yet still, maintain a high level of quality. Slidegeeks has experienced researchers who prepare these templates and write high quality content for you. Later on, you can personalize the content by editing the Brand Awareness Metrics Share Of Voice Ppt Infographics Show PDF.

KPI Metrics Dashboard Highlighting Employee Retention Rate Structure PDF
The purpose of this slide is to exhibit a key performance indicator KPI dashboard through which managers can analyze the monthly employee retention rate. The metrics covered in the slide are active employees, new candidates hired, internal, exit, employee turnover rate, etc. Do you have to make sure that everyone on your team knows about any specific topic I yes, then you should give KPI Metrics Dashboard Highlighting Employee Retention Rate Structure PDF a try. Our experts have put a lot of knowledge and effort into creating this impeccable KPI Metrics Dashboard Highlighting Employee Retention Rate Structure PDF. You can use this template for your upcoming presentations, as the slides are perfect to represent even the tiniest detail. You can download these templates from the Slidegeeks website and these are easy to edit. So grab these today.

Key Metrics For Client Engagement Loyalty Program Microsoft PDF
This slide shows key metrics to measure customer loyalty program . It includes factors such as retention rate, negative churn, promoter score, and effort score. Persuade your audience using this Key Metrics For Client Engagement Loyalty Program Microsoft PDF. This PPT design covers four stages, thus making it a great tool to use. It also caters to a variety of topics including Retention Rate, Negative Churn, Promoter Score, Effort Score. Download this PPT design now to present a convincing pitch that not only emphasizes the topic but also showcases your presentation skills.

Metrics To Measure Brand Image For Corporates Professional PDF
This slide showcases the best KPIs to monitor the brand reputation for corporates and helps in optimizing brand strategy. It includes metrics such as sentiment analysis, PR shares, share of voice and online reviews. Persuade your audience using this Metrics To Measure Brand Image For Corporates Professional PDF. This PPT design covers Five stages, thus making it a great tool to use. It also caters to a variety of topics including Sentiment Analysis, Share Of Voice, Online Reviews. Download this PPT design now to present a convincing pitch that not only emphasizes the topic but also showcases your presentation skills.

Cyber Security Risk Dashboard With KPI Metrics Elements PDF
This slide depicts global cyber security and risk trends providing information about every aspect of threat. It includes overall progression, critical risk identified, initiatives, incident and vulnerabilities management, compliance and patches. Showcasing this set of slides titled Cyber Security Risk Dashboard With KPI Metrics Elements PDF. The topics addressed in these templates are Vulnerability Management Program, Reports And Metrics Elaboration, Critical Risk Identified. All the content presented in this PPT design is completely editable. Download it and make adjustments in color, background, font etc. as per your unique business setting.

Customer Relationship Management Various CRM Program Success Metrics Icons PDF
This slide covers information regarding the metrics associated customer relationship to analyze CRM program success. Coming up with a presentation necessitates that the majority of the effort goes into the content and the message you intend to convey. The visuals of a PowerPoint presentation can only be effective if it supplements and supports the story that is being told. Keeping this in mind our experts created Customer Relationship Management Various CRM Program Success Metrics Icons PDF to reduce the time that goes into designing the presentation. This way, you can concentrate on the message while our designers take care of providing you with the right template for the situation.
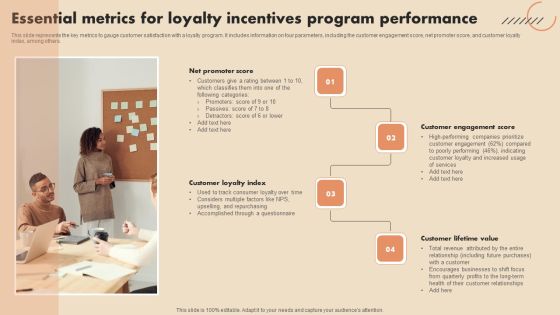
Essential Metrics For Loyalty Incentives Program Performance Microsoft PDF
This slide represents the key metrics to gauge customer satisfaction with a loyalty program. It includes information on four parameters, including the customer engagement score, net promoter score, and customer loyalty index, among others.Persuade your audience using this Essential Metrics For Loyalty Incentives Program Performance Microsoft PDF. This PPT design covers four stages, thus making it a great tool to use. It also caters to a variety of topics including Net Promoter Score, Customer Engagement Score. Download this PPT design now to present a convincing pitch that not only emphasizes the topic but also showcases your presentation skills.

Data Quality Kpis Metrics Score For Reports Monitoring Download PDF
This slide covers overall scores to analyse the quality of data provided by company. It includes annual reports data quality scores based on different metrics such as completeness, timeliness, validity, accuracy, consistency and uniqueness. Showcasing this set of slides titled Data Quality Kpis Metrics Score For Reports Monitoring Download PDF. The topics addressed in these templates are Total Rows Processed, Failed Rows. All the content presented in this PPT design is completely editable. Download it and make adjustments in color, background, font etc. as per your unique business setting.

KPI Metrics Dashboard To Measure Winning Sales Strategy Ideas PDF
The following slide highlights a comprehensive dashboard showcasing the winning sales strategy performance. The dashboard covers information about metrics such as sales by different products, region, channels, etc.Showcasing this set of slides titled KPI Metrics Dashboard To Measure Winning Sales Strategy Ideas PDF The topics addressed in these templates are Sales By Channel, Various Products, Inventory Outstanding All the content presented in this PPT design is completely editable. Download it and make adjustments in color, background, font etc. as per your unique business setting.
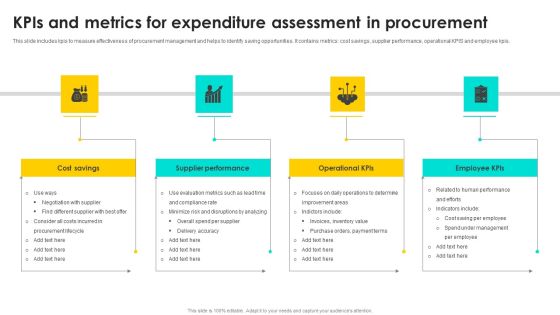
Kpis And Metrics For Expenditure Assessment In Procurement Slides PDF
This slide includes kpis to measure effectiveness of procurement management and helps to identify saving opportunities. It contains metrics cost savings, supplier performance, operational KPIS and employee kpis. Persuade your audience using this Kpis And Metrics For Expenditure Assessment In Procurement Slides PDF. This PPT design covers Four stages, thus making it a great tool to use. It also caters to a variety of topics including Cost Savings, Supplier Performance. Download this PPT design now to present a convincing pitch that not only emphasizes the topic but also showcases your presentation skills.

Batch Processing KPI Metrics Dashboard With Rejection Rate Topics PDF
Mentioned slide highlights performance KPI dashboard of batch processing system. The KPIs covered in the slide are batch rejection rate by product, number of reprocessed lots, rejection by product and reasons for the rejection. Pitch your topic with ease and precision using this Batch Processing KPI Metrics Dashboard With Rejection Rate Topics PDF. This layout presents information on Batch Processing KPI Metrics, Dashboard Rejection Rate. It is also available for immediate download and adjustment. So, changes can be made in the color, design, graphics or any other component to create a unique layout.
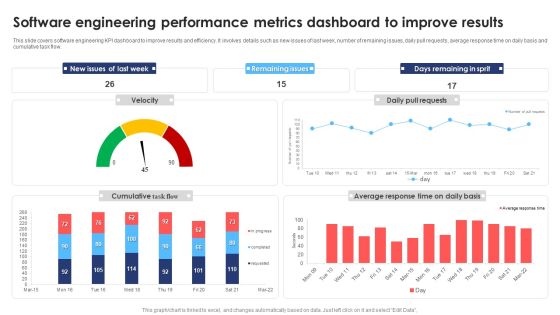
Software Engineering Performance Metrics Dashboard To Improve Results Infographics PDF
This slide covers software engineering KPI dashboard to improve results and efficiency. It involves details such as new issues of last week, number of remaining issues, daily pull requests, average response time on daily basis and cumulative task flow. Pitch your topic with ease and precision using this Software Engineering Performance Metrics Dashboard To Improve Results Infographics PDF. This layout presents information on Software Engineering Performance, Metrics Dashboard Improve Results. It is also available for immediate download and adjustment. So, changes can be made in the color, design, graphics or any other component to create a unique layout.
Performance Tracking Metrics Of Marketing Return On Investment Graphics PDF
This slide shows various key performance indicators to measure performance of marketing ROI. It includes metrics such as unique monthly visitors, cost per lead, return on ad spend, average order value, etc. Showcasing this set of slides titled Performance Tracking Metrics Of Marketing Return On Investment Graphics PDF. The topics addressed in these templates are Cost Per Lead, Customer Lifetime Value, Unique Monthly Visitors. All the content presented in this PPT design is completely editable. Download it and make adjustments in color, background, font etc. as per your unique business setting.
Metrics To Measure Results Of Performance Marketing Campaign Sample PDF
This slide showcases metrics that can help organization to track the effectiveness of performance advertisement campaign. Its key components are cost per click, cost per sales, cost per impression and cost per lead. Want to ace your presentation in front of a live audience Our Metrics To Measure Results Of Performance Marketing Campaign Sample PDF can help you do that by engaging all the users towards you. Slidegeeks experts have put their efforts and expertise into creating these impeccable powerpoint presentations so that you can communicate your ideas clearly. Moreover, all the templates are customizable, and easy-to-edit and downloadable. Use these for both personal and commercial use.
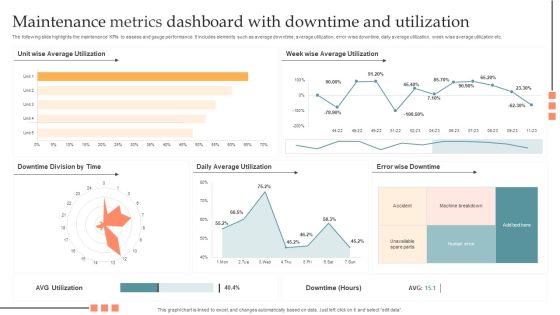
Maintenance Metrics Dashboard With Downtime And Utilization Pictures PDF
The following slide highlights the maintenance KPIs to assess and gauge performance. It includes elements such as average downtime, average utilization, error wise downtime, daily average utilization, week wise average utilization etc. Showcasing this set of slides titled Maintenance Metrics Dashboard With Downtime And Utilization Pictures PDF. The topics addressed in these templates are Maintenance Metrics Dashboard, Downtime And Utilization. All the content presented in this PPT design is completely editable. Download it and make adjustments in color, background, font etc. as per your unique business setting.

Education Dashboard With Fees Collection And Expense Metrics Demonstration PDF
This slide covers education key performance indicators tracking dashboard. It also include metrics such as total students, teachers, parents, total earrings, social media followers, event calendar, fees collection, and expenses. Showcasing this set of slides titled Education Dashboard With Fees Collection And Expense Metrics Demonstration PDF. The topics addressed in these templates are Event Calender, Annual Holidays, Fees Collection, Expenses. All the content presented in this PPT design is completely editable. Download it and make adjustments in color, background, font etc. as per your unique business setting.

Multi Project Metrics Dashboard With Overall Status Pictures PDF
This slide covers the dashboard that shows the status of project such as status of schedule, resource, quality with projects which are on schedule, in which issues has been occurred, that are critical, etc. That helps the project managers to understand the progress accurately. Pitch your topic with ease and precision using this Multi Project Metrics Dashboard With Overall Status Pictures PDF. This layout presents information on Multi Project, Metrics Dashboard. It is also available for immediate download and adjustment. So, changes can be made in the color, design, graphics or any other component to create a unique layout.

Commodity Adoption Metrics For Technique Development Microsoft PDF
This slide highlights various key performance indicators to identify product adoption rate for user acquisition strategy development. It includes key metrics such as net promoter score, client retention rate, active user percentage, customer lifetime value and churn rate. Presenting Commodity Adoption Metrics For Technique Development Microsoft PDF to dispense important information. This template comprises four stages. It also presents valuable insights into the topics including Build Customer, Onboarding Process, Analysis. This is a completely customizable PowerPoint theme that can be put to use immediately. So, download it and address the topic impactfully.

Call Center Metrics Dashboard Highlighting Service Level Infographics PDF
Mentioned slide outlines comprehensive call center KPI dashboard. Information covered in this slide is related to various metrics such as queue calls, support and billing service level, inbound volume, outbound volume etc. Pitch your topic with ease and precision using this Call Center Metrics Dashboard Highlighting Service Level Infographics PDF. This layout presents information on All Agents, Queue Calls, Billing Service Level. It is also available for immediate download and adjustment. So, changes can be made in the color, design, graphics or any other component to create a unique layout.

Call Center Metrics Dashboard With Customer Satisfaction Score Ideas PDF
Mentioned slide outlines a comprehensive call center KPI dashboard which can be used for those customers who are seeking technical support. It provides detailed information about metrics such as ticket status, ticket by channels and type, overall customer satisfaction score, etc. Showcasing this set of slides titled Call Center Metrics Dashboard With Customer Satisfaction Score Ideas PDF. The topics addressed in these templates are Customer Satisfaction, Score Ticket Status, Satisfaction Score. All the content presented in this PPT design is completely editable. Download it and make adjustments in color, background, font etc. as per your unique business setting.

Call Center Metrics Dashboard With First Response Time Background PDF
Mentioned slide outlines a KPI dashboard which can be used by call centers for the ticket system. Tickets created, unassigned, open, solved, escalated, tickets solved by agents, first response and full resolution time are the key metrics highlighted in the slide. Pitch your topic with ease and precision using this Call Center Metrics Dashboard With First Response Time Background PDF. This layout presents information on First Response Time, First Resolution Time, Response Time. It is also available for immediate download and adjustment. So, changes can be made in the color, design, graphics or any other component to create a unique layout.

Metrics Dashboard Depicting Call Center Performance Pictures PDF
Mentioned slide outlines key performance indicator KPI dashboard which can be used by call center to optimize the agents performance. The major metrics covered in the template are total calls, average speed of answer, abandon rate, service level agreement SLA limit etc. Pitch your topic with ease and precision using this Metrics Dashboard Depicting Call Center Performance Pictures PDF. This layout presents information on Overall Satisfaction Score, Satisfaction Score, Performance. It is also available for immediate download and adjustment. So, changes can be made in the color, design, graphics or any other component to create a unique layout.

Plan Personnel And Project Development Metrics Professional PDF
This slide show must have metrics for strategic workforce development that helps project team to have better communication and teamwork. It includes three elements such as components with there description and relevance. Pitch your topic with ease and precision using this Plan Personnel And Project Development Metrics Professional PDF. This layout presents information on Employees, Determines, Target Team. It is also available for immediate download and adjustment. So, changes can be made in the color, design, graphics or any other component to create a unique layout.
KPI Metrics For SQA Ppt PowerPoint Presentation Icon Deck PDF
This slide shows the KPI metrics which can be used by an organization to measure the software quality. It includes passed test defects fixed per day, Average time to test, quality ratio, etc. Showcasing this set of slides titled KPI Metrics For SQA Ppt PowerPoint Presentation Icon Deck PDF. The topics addressed in these templates are Quality Ratio, Kpis, Passed Tests. All the content presented in this PPT design is completely editable. Download it and make adjustments in color, background, font etc. as per your unique business setting.

Agile Virtual Project Management Agile Performance Evaluation Metrics Icons PDF
This slide covers the metrics used by the organisation to measure agile capability on the basis of product performance, security level and user satisfaction Present like a pro with Agile Virtual Project Management Agile Performance Evaluation Metrics Icons PDF Create beautiful presentations together with your team, using our easy-to-use presentation slides. Share your ideas in real-time and make changes on the fly by downloading our templates. So whether youre in the office, on the go, or in a remote location, you can stay in sync with your team and present your ideas with confidence. With Slidegeeks presentation got a whole lot easier. Grab these presentations today.

Human Resource Management Competency Framework And Metrics Brochure PDF
The slide shows an ability framework of human resource management including strategy, key initiatives and HR metrics. It also displays planning, hiring, identification, conduct management, learning and development, progression, retention, staff wellness and exit. Showcasing this set of slides titled Human Resource Management Competency Framework And Metrics Brochure PDF. The topics addressed in these templates are Develop, Purchase, Development. All the content presented in this PPT design is completely editable. Download it and make adjustments in color, background, font etc. as per your unique business setting.
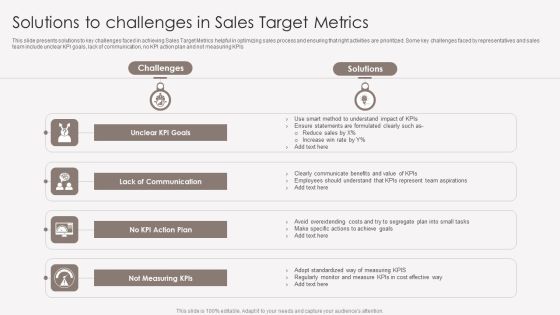
Solutions To Challenges In Sales Target Metrics Topics PDF
This slide presents solutions to key challenges faced in achieving Sales Target Metrics helpful in optimizing sales process and ensuring that right activities are prioritized. Some key challenges faced by representatives and sales team include unclear KPI goals, lack of communication, no KPI action plan and not measuring KPIs. Presenting Solutions To Challenges In Sales Target Metrics Topics PDF to dispense important information. This template comprises three stages. It also presents valuable insights into the topics including Lack Of Communication, Action Plan, Not Measuring. This is a completely customizable PowerPoint theme that can be put to use immediately. So, download it and address the topic impactfully.
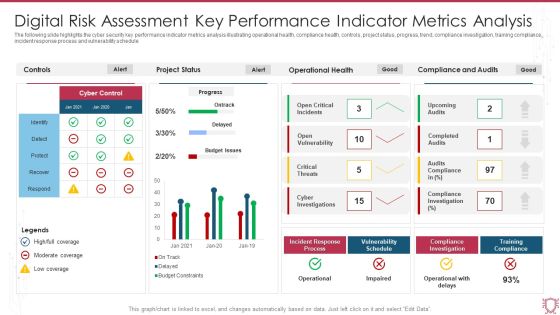
Digital Risk Assessment Key Performance Indicator Metrics Analysis Infographics PDF
The following slide highlights the cyber security key performance indicator metrics analysis illustrating operational health, compliance health, controls, project status, progress, trend, compliance investigation, training compliance, incident response process and vulnerability schedule. Showcasing this set of slides titled Digital Risk Assessment Key Performance Indicator Metrics Analysis Infographics PDF. The topics addressed in these templates are Project Status, Operational Health, Compliance And Audits. All the content presented in this PPT design is completely editable. Download it and make adjustments in color, background, font etc. as per your unique business setting.

Success Metrics To Assess Consumer Service Strategy Pictures PDF
This slide provides information regarding the customer relationship metrics in order to access CRM program success. This is a Success Metrics To Assess Consumer Service Strategy Pictures PDF template with various stages. Focus and dispense information on seven stages using this creative set, that comes with editable features. It contains large content boxes to add your information on topics like Increased Up Sale, Increased Referrals, Customer Lifetime Value. You can also showcase facts, figures, and other relevant content using this PPT layout. Grab it now.

Customer Lifecycle Marketing Techniques With Key Metrics Topics PDF
This slide shows the marketing strategies for customer lifecycle management for different stages of awareness, consideration, purchase and loyalty. It also includes the key metrics for measurement of effectiveness of implemented strategies. Showcasing this set of slides titled Customer Lifecycle Marketing Techniques With Key Metrics Topics PDF. The topics addressed in these templates are Consideration, Awareness, Purchase. All the content presented in this PPT design is completely editable. Download it and make adjustments in color, background, font etc. as per your unique business setting.

Smartphone App Installation Metrics Dashboard With User Sessions Microsoft PDF
This slide showcases dashboard that can help organization to identify the installation trend of mobile application and formulate strategies in case of declining downloads. Its key components are installs trend, total installs, total sessions and total media source breakdown by revenue. Pitch your topic with ease and precision using this Smartphone App Installation Metrics Dashboard With User Sessions Microsoft PDF. This layout presents information on Smartphone App Installation Metrics Dashboard With User Sessions. It is also available for immediate download and adjustment. So, changes can be made in the color, design, graphics or any other component to create a unique layout.

Customer Service Metrics Dashboard With Unresolved Calls Designs PDF
This slide showcases KPI dashboard for customer service that can help to identify the issue unresolved and response time by weekday. Its key elements are final call resolution, unresolved calls, avg response time and best day to call. Showcasing this set of slides titled Customer Service Metrics Dashboard With Unresolved Calls Designs PDF. The topics addressed in these templates are Customer Service, Metrics Dashboard, Unresolved Calls. All the content presented in this PPT design is completely editable. Download it and make adjustments in color, background, font etc. as per your unique business setting.

Brand Awareness Metrics Sentiment Analysis Opinion Mining Template PDF
This slide provides information regarding sentiment analysis or opinion mining as brand awareness metrics. It helps in identifying key influencer across social network. The slide also include key initiatives to manage sentiment analysis. Boost your pitch with our creative Brand Awareness Metrics Sentiment Analysis Opinion Mining Template PDF. Deliver an awe inspiring pitch that will mesmerize everyone. Using these presentation templates you will surely catch everyones attention. You can browse the ppts collection on our website. We have researchers who are experts at creating the right content for the templates. So you do not have to invest time in any additional work. Just grab the template now and use them.

Customer Service Metrics Sources With Improvement Strategies Rules PDF
This slide showcases comparison of customer service metrics from different sources that can help to leverage strategies to improve them in future. Its key performance indicators are average response time, net promoter score, average response time and customer satisfaction score. Showcasing this set of slides titled Customer Service Metrics Sources With Improvement Strategies Rules PDF. The topics addressed in these templates are Average, Strategies, Customer Satisfaction Score. All the content presented in this PPT design is completely editable. Download it and make adjustments in color, background, font etc. as per your unique business setting.

Hotel Checkout Process Flowchart With Key Metrics Structure PDF
This slide consists of a hotel check in and checkout process followed by hotel staff to manage guests. Key elements covered in this slide are welcome guests, check for room availability, prepare invoice, collect payment, handover invoice copy, request guests to fill feedback form, thank guests for stay. Showcasing this set of slides titled Hotel Checkout Process Flowchart With Key Metrics Structure PDF. The topics addressed in these templates are Responsibility, Outputs, Key Metrics. All the content presented in this PPT design is completely editable. Download it and make adjustments in color, background, font etc. as per your unique business setting.
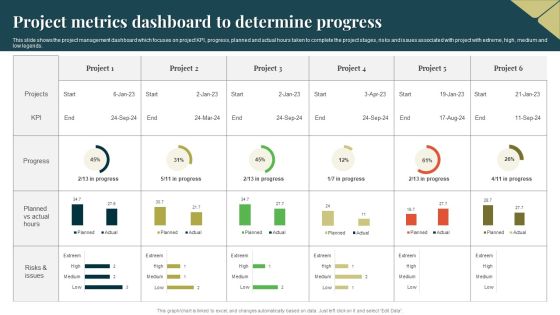
Project Metrics Dashboard To Determine Progress Guidelines PDF
This slide shows the project management dashboard which focuses on project KPI, progress, planned and actual hours taken to complete the project stages, risks and issues associated with project with extreme, high, medium and low legends. Showcasing this set of slides titled Project Metrics Dashboard To Determine Progress Guidelines PDF. The topics addressed in these templates are Project Metrics Dashboard, Determine Progress. All the content presented in this PPT design is completely editable. Download it and make adjustments in color, background, font etc. as per your unique business setting.

Call Centre Performance Dashboard With Customer Service Metrics Background PDF
This slide showcases dashboard for call centre performance that can help to evaluate the call abandon rate of customers and implement training of staff for improving customer satisfaction KPIs. Its key elements are total calls, avg answer speed and customer effort score. Showcasing this set of slides titled Call Centre Performance Dashboard With Customer Service Metrics Background PDF. The topics addressed in these templates are Call Centre Performance Dashboard, Customer Service Metrics. All the content presented in this PPT design is completely editable. Download it and make adjustments in color, background, font etc. as per your unique business setting.

Engineering Performance Metrics Dashboard To Track Pull Requests Background PDF
This slide covers engineering KPI dashboard to track pull request. It involves KPIs such as open time of average pull requests, average comment received, revision rounds, frequency of posting pull requests. Pitch your topic with ease and precision using this Engineering Performance Metrics Dashboard To Track Pull Requests Background PDF. This layout presents information on Dashboard Track Pull Requests, Engineering Performance Metrics. It is also available for immediate download and adjustment. So, changes can be made in the color, design, graphics or any other component to create a unique layout.

Dashboard Depicting Performance Metrics Of Customer Service Template PDF
This slide showcases dashboard depicting major customer service KPIs. The performance metrics covered are search exit rate, CSAT, average first response time, tickets solved, etc. Take your projects to the next level with our ultimate collection of Dashboard Depicting Performance Metrics Of Customer Service Template PDF. Slidegeeks has designed a range of layouts that are perfect for representing task or activity duration, keeping track of all your deadlines at a glance. Tailor these designs to your exact needs and give them a truly corporate look with your own brand colors they will make your projects stand out from the rest.

Current Team Performance Using Velocity Metrics Graphics PDF
This slide depicts the current performance of the team through a graph that shows the committed work to be done and the actual work that has been done. The tasks have been divided into various sprints and performance is measured in story points. Deliver and pitch your topic in the best possible manner with this current team performance using velocity metrics graphics pdf. Use them to share invaluable insights on current team performance using velocity metrics and impress your audience. This template can be altered and modified as per your expectations. So, grab it now.

Current Team Performance Using Velocity Metrics Clipart PDF
This slide depicts the current performance of the team through a graph that shows the committed work to be done and the actual work that has been done. The tasks have been divided into various sprints and performance is measured in story points. Deliver an awe-inspiring pitch with this creative current team performance using velocity metrics clipart pdf bundle. Topics like current team performance using velocity metrics can be discussed with this completely editable template. It is available for immediate download depending on the needs and requirements of the user.

Devops Business Performance Metrics Ppt Slides Inspiration PDF
This template covers metrics for evaluation of devOps performance on each stage such as operational efficiency, service quality, service velocity, business performance etc. Presenting devops business performance metrics ppt slides inspiration pdf to provide visual cues and insights. Share and navigate important information on five stages that need your due attention. This template can be used to pitch topics like customer value, organizational, service, business performance. In addtion, this PPT design contains high resolution images, graphics, etc, that are easily editable and available for immediate download.
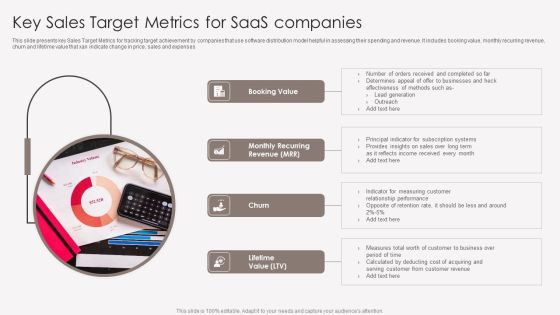
Key Sales Target Metrics For Saas Companies Portrait PDF
This slide presents key Sales Target Metrics for tracking target achievement by companies that use software distribution model helpful in assessing their spending and revenue. It includes booking value, monthly recurring revenue, churn and lifetime value that xan indicate change in price, sales and expenses. Persuade your audience using this Key Sales Target Metrics For Saas Companies Portrait PDF. This PPT design covers four stages, thus making it a great tool to use. It also caters to a variety of topics including Booking Value, Churn, Lifetime Value. Download this PPT design now to present a convincing pitch that not only emphasizes the topic but also showcases your presentation skills.

Track Metrics To Analyze Social Media Engagement Download PDF
This slide showcases key indicators to track and analyze social media engagement. The metrics covered are reach, impressions, audience growth rate, click-through and average engagement rate, share of voice and conversion rate. If your project calls for a presentation, then Slidegeeks is your go to partner because we have professionally designed, easy to edit templates that are perfect for any presentation. After downloading, you can easily edit Track Metrics To Analyze Social Media Engagement Download PDF and make the changes accordingly. You can rearrange slides or fill them with different images. Check out all the handy templates.
Project Performance Metrics Our Agenda Ppt Inspiration PDF
Presenting project performance metrics our agenda ppt inspiration pdf to provide visual cues and insights. Share and navigate important information on five stages that need your due attention. This template can be used to pitch topics like agenda. In addtion, this PPT design contains high resolution images, graphics, etc, that are easily editable and available for immediate download.

Two Year Comparison Of Customer Service Metrics Information PDF
This slide showcases yearly comparison of customer service metrics that can help to identify percentage change as compared to previous year and evaluate reason behind decrease and increase. Its key KPIs are customer satisfaction score, avg call response time, customer effort score and average handle time. Pitch your topic with ease and precision using this Two Year Comparison Of Customer Service Metrics Information PDF. This layout presents information on Customer Effort Score, Customer Satisfaction Score, Average Handle Time. It is also available for immediate download and adjustment. So, changes can be made in the color, design, graphics or any other component to create a unique layout.
Monthly Shipping And Inventory Tracking Metrics Tracker Icons PDF
This slide displays the KPI tracker for identifying the shipment, inventory, and fleet maintenance status. It also includes KPIs such as on-time delivery, on-time departure, inventory age, inventory cycle, etc. Showcasing this set of slides titled Monthly Shipping And Inventory Tracking Metrics Tracker Icons PDF. The topics addressed in these templates are Minimum Standard, Level Agreement, Metrics Tracker. All the content presented in this PPT design is completely editable. Download it and make adjustments in color, background, font etc. as per your unique business setting.

Dashboards Showing Consultancy Company Performance With Key Metrics Microsoft PDF
This slide shows the dashboard related to consultancy company performance which includes budget preparation, sales and goals. Company profits and goals etc.Presenting dashboards showing consultancy company performance with key metrics microsoft pdf to provide visual cues and insights. Share and navigate important information on four stages that need your due attention. This template can be used to pitch topics like dashboards showing consultancy company performance with key metrics. In addtion, this PPT design contains high resolution images, graphics, etc, that are easily editable and available for immediate download.

Supply Chain Approaches Dashboard Depicting Supply Chain Metrics Background PDF
This slide shows the dashboard that depicts supply chain metrics such as total net sales, supply chain expenses, average cash to cash cycle in days, carrying costs of inventory, etc.Deliver and pitch your topic in the best possible manner with this Supply Chain Approaches Dashboard Depicting Supply Chain Metrics Background PDF. Use them to share invaluable insights on Supply Chain, Expenses Based Category, Chain Expenses and impress your audience. This template can be altered and modified as per your expectations. So, grab it now.
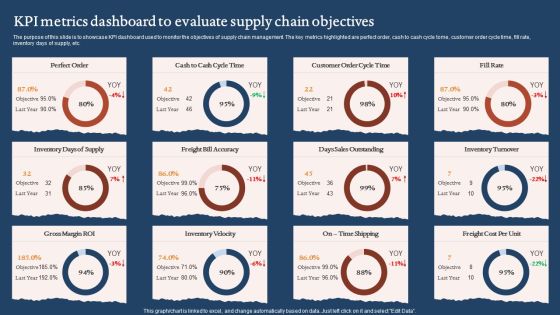
KPI Metrics Dashboard To Evaluate Supply Chain Objectives Graphics PDF
The purpose of this slide is to showcase KPI dashboard used to monitor the objectives of supply chain management. The key metrics highlighted are perfect order, cash to cash cycle tome, customer order cycle time, fill rate, inventory days of supply, etc. Pitch your topic with ease and precision using this KPI Metrics Dashboard To Evaluate Supply Chain Objectives Graphics PDF. This layout presents information on Days Sales Outstanding, Inventory Velocity, Gross Margin Roi. It is also available for immediate download and adjustment. So, changes can be made in the color, design, graphics or any other component to create a unique layout.

Dashboard For Education Institutes With Student Retention Metrics Slides PDF
This slide covers dashboard for tracking student and faculty members details. It include metrics such as faculty to student ratio, student attendance rate, faculty retention rate, student enrollment details, examination results overview, etc. Showcasing this set of slides titled Dashboard For Education Institutes With Student Retention Metrics Slides PDF. The topics addressed in these templates are Student Enrollment Details, Examination Results Overview, Faculty Student Ratio. All the content presented in this PPT design is completely editable. Download it and make adjustments in color, background, font etc. as per your unique business setting.
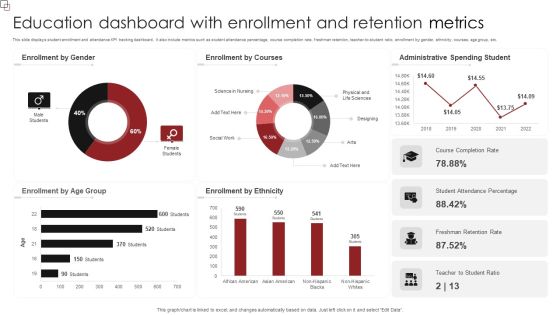
Education Dashboard With Enrollment And Retention Metrics Sample PDF
This slide displays student enrollment and attendance KPI tracking dashboard. It also include metrics such as student attendance percentage, course completion rate, freshman retention, teacher-to-student ratio, enrollment by gender, ethnicity, courses, age group, etc. Pitch your topic with ease and precision using this Education Dashboard With Enrollment And Retention Metrics Sample PDF. This layout presents information on Enrollment Gender, Enrollment Courses, Administrative Spending Student. It is also available for immediate download and adjustment. So, changes can be made in the color, design, graphics or any other component to create a unique layout.

 Home
Home