Metrics List
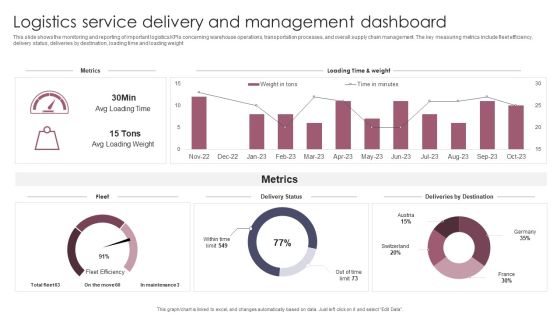
Logistics Service Delivery And Management Dashboard Introduction PDF
This slide shows the monitoring and reporting of important logistics KPIs concerning warehouse operations, transportation processes, and overall supply chain management. The key measuring metrics include fleet efficiency, delivery status, deliveries by destination, loading time and loading weight. Showcasing this set of slides titled Logistics Service Delivery And Management Dashboard Introduction PDF. The topics addressed in these templates are Logistics Service Delivery, Management Dashboard. All the content presented in this PPT design is completely editable. Download it and make adjustments in color, background, font etc. as per your unique business setting.

Deliver Efficiency Innovation Challenges Associated With User Experience Team Themes PDF
This slide represents metrics used to measure product team performance that covers product stickiness and usage, feature adoption and retention, net promoter score, product delivery predictability, etc. Deliver an awe inspiring pitch with this creative Deliver Efficiency Innovation Challenges Associated With User Experience Team Themes PDF bundle. Topics like Product Development Procedure, Value Achieving Objectives, Securing Resources And Budget, Experience And Research Value can be discussed with this completely editable template. It is available for immediate download depending on the needs and requirements of the user.
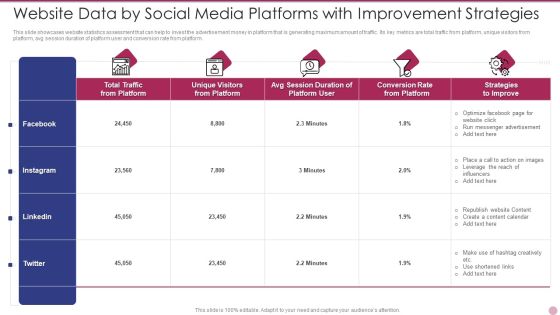
Website Data By Social Media Platforms With Improvement Strategies Diagrams PDF
This slide showcases website statistics assessment that can help to invest the advertisement money in platform that is generating maximum amount of traffic. Its key metrics are total traffic from platform, unique visitors from platform, avg session duration of platform user and conversion rate from platform. Showcasing this set of slides titled Website Data By Social Media Platforms With Improvement Strategies Diagrams PDF. The topics addressed in these templates are Strategies To Improve, Advertisement, Optimize. All the content presented in this PPT design is completely editable. Download it and make adjustments in color, background, font etc. as per your unique business setting.

Vendor Selection Prioritization Matrix And Request For Proposal Evaluation Sample PDF
This slide illustrates Response for Proposal RFP evaluation for selection of vendors. It includes metrics such as process fit, ease of use, services and support, performance etc. Showcasing this set of slides titled Vendor Selection Prioritization Matrix And Request For Proposal Evaluation Sample PDF. The topics addressed in these templates are Segments To Prioritize, Prioritization Matrix, Proposal Evaluation. All the content presented in this PPT design is completely editable. Download it and make adjustments in color, background, font etc. as per your unique business setting.

Competitive Analysis Of Abs Healthcare Company For 2021 Ppt Portfolio Templates PDF
This slide shows the competitive analysis of ABS Healthcare Company with other similar line of competitors on the based of certain parameters such as Sales, Stole Personal Records, Hacking Incidents, Total Cybersecurity Cases etc. Deliver an awe-inspiring pitch with this creative competitive analysis of abs healthcare company for 2021 ppt portfolio templates pdf. bundle. Topics like logistic companies, revenue, personal records stolen, hacking incidents, total cybersecurity cases, metrics can be discussed with this completely editable template. It is available for immediate download depending on the needs and requirements of the user.
Logistics Management Strategy Effectiveness Tracker Professional PDF
This slide covers the key performance indicator for tracking the success of a new logistics management strategy. It includes metrics such as shipping time, order accuracy, lead time, capacity utilization, customer backorder rate, inventory turnover, etc. Showcasing this set of slides titled logistics management strategy effectiveness tracker professional pdf. The topics addressed in these templates are supply management, order management, inventory management. All the content presented in this PPT design is completely editable. Download it and make adjustments in color, background, font etc. as per your unique business setting.

Audience Satisfaction Study On Virtual Event Experience Inspiration PDF
This slide covers survey outcomes for audience satisfaction with virtual events. It includes metrics such as opinions on date and time, ease of accessibility, reviews on event speakers, breakout sessions, networking, sponsors and exhibitors, etc. Showcasing this set of slides titled Audience Satisfaction Study On Virtual Event Experience Inspiration PDF. The topics addressed in these templates are Networking, Audience Satisfaction Study, Virtual Event Experience. All the content presented in this PPT design is completely editable. Download it and make adjustments in color, background, font etc. as per your unique business setting.
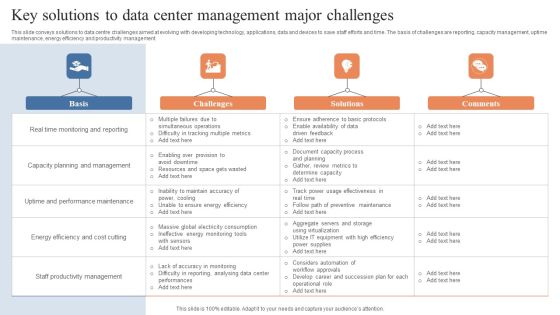
Key Solutions To Data Center Management Major Challenges Brochure PDF
This slide conveys solutions to data centre challenges aimed at evolving with developing technology, applications, data and devices to save staff efforts and time. The basis of challenges are reporting, capacity management, uptime maintenance, energy efficiency and productivity management. Showcasing this set of slides titled Key Solutions To Data Center Management Major Challenges Brochure PDF. The topics addressed in these templates are Multiple Failures, Simultaneous Operations, Difficulty Tracking, Multiple Metrics . All the content presented in this PPT design is completely editable. Download it and make adjustments in color, background, font etc. as per your unique business setting.
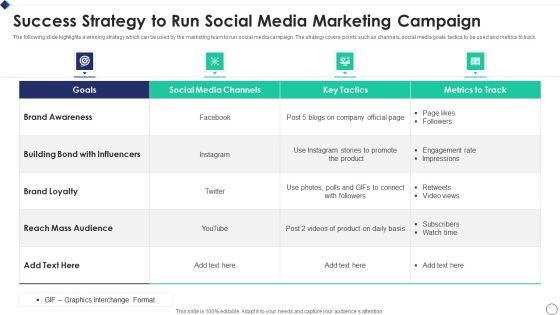
Success Strategy To Run Social Media Marketing Campaign Template PDF
The following slide highlights a winning strategy which can be used by the marketing team to run social media campaign. The strategy covers points such as channels, social media goals, tactics to be used and metrics to track. Showcasing this set of slides titled Success Strategy To Run Social Media Marketing Campaign Template PDF The topics addressed in these templates are Building Bond, Reach Mass, Instagram Stories All the content presented in this PPT design is completely editable. Download it and make adjustments in color, background, font etc. as per your unique business setting.
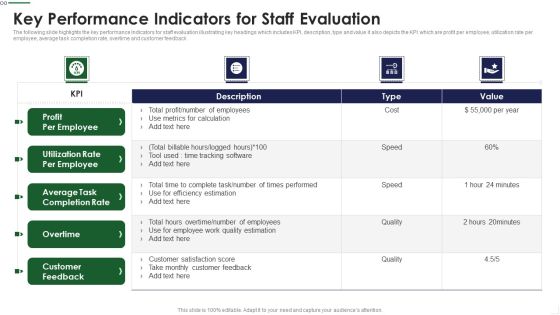
Key Performance Indicators For Staff Evaluation Infographics PDF
The following slide highlights the key performance Indicators for staff evaluation illustrating key headings which includes KPI, description, type and value it also depicts the KPI which are profit per employee, utilization rate per employee, average task completion rate, overtime and customer feedback Showcasing this set of slides titled Key Performance Indicators For Staff Evaluation Infographics PDF The topics addressed in these templates are Metrics Calculation, Times Performed, Customer Satisfaction All the content presented in this PPT design is completely editable. Download it and make adjustments in color, background, font etc. as per your unique business setting.

Video Promotion Techniques To Enhance Business Revenue Ppt Inspiration PDF
This slide signifies the video marketing approach to increase organisation revenue. It covers information regarding to the metrics like engagement rate, view count, play rate, social sharing and feedback. Showcasing this set of slides titled Video Promotion Techniques To Enhance Business Revenue Ppt Inspiration PDF. The topics addressed in these templates are Engagement Rate, View Count, Play Rate. All the content presented in this PPT design is completely editable. Download it and make adjustments in color, background, font etc. as per your unique business setting.

Money Valuation Analysis Pre And Post Funding Formats PDF
This slide shows the companys balance sheet before and after Series A fund raising. Key metrics covered in this are enterprise value, cash, debt, equity value, share price etc. Showcasing this set of slides titled Money Valuation Analysis Pre And Post Funding Formats PDF. The topics addressed in these templates are Share Price, Equity Value, Enterprise Value. All the content presented in this PPT design is completely editable. Download it and make adjustments in color, background, font etc. as per your unique business setting.

Gap Analysis Highlighting The Need For Shopping Mall Marketing Strategy Themes PDF
This slide represents gap assessment for shopping centers showcasing need for marketing strategy. It include key performance metrics such as unique visitors, dwell time, number of visits and repetition rate. Boost your pitch with our creative Gap Analysis Highlighting The Need For Shopping Mall Marketing Strategy Themes PDF. Deliver an awe-inspiring pitch that will mesmerize everyone. Using these presentation templates you will surely catch everyones attention. You can browse the ppts collection on our website. We have researchers who are experts at creating the right content for the templates. So you do not have to invest time in any additional work. Just grab the template now and use them.

Agile Methodologies Team Performance Measurement After Agile Implementation Infographics Ppt Infographic Template Ideas PDF
This slide shows team iteration metrics for the measurement of team performance based on parameters such as actual and planned velocity, planned and accepted stories, number of defects and test cases, percentage of automated tests etc. Deliver an awe inspiring pitch with this creative agile methodologies team performance measurement after agile implementation infographics ppt infographic template ideas pdf bundle. Topics like Team Performance Measurement After Agile Implementation can be discussed with this completely editable template. It is available for immediate download depending on the needs and requirements of the user.
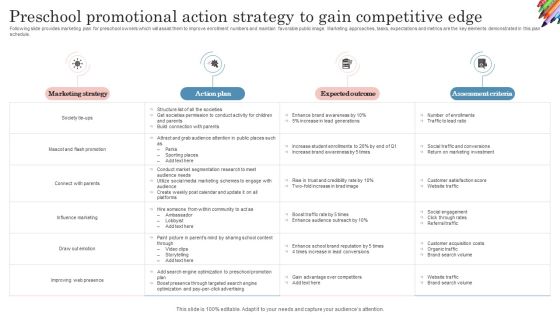
Preschool Promotional Action Strategy To Gain Competitive Edge Download PDF
Following slide provides marketing plan for preschool owners which will assist them to improve enrollment numbers and maintain favorable public image. Marketing approaches, tasks, expectations and metrics are the key elements demonstrated in this plan schedule. Pitch your topic with ease and precision using this Preschool Promotional Action Strategy To Gain Competitive Edge Download PDF. This layout presents information on Marketing Strategy, Action Plan, Expected Outcome, Assessment Criteria. It is also available for immediate download and adjustment. So, changes can be made in the color, design, graphics or any other component to create a unique layout.

KPI Dashboard To Track Automation Performance In Employee Onboarding Introduction PDF
The following slide outlines performance key performance indicator KPI which can be used to evaluate business process automation performance in employee onboarding. The metrics highlighted in the slide are onboarding completion status, hires per office, etc. Deliver an awe inspiring pitch with this creative KPI Dashboard To Track Automation Performance In Employee Onboarding Introduction PDF bundle. Topics like Onboarding Completion Status, Onboardings In Progress, Employee Onboarding can be discussed with this completely editable template. It is available for immediate download depending on the needs and requirements of the user.

Stream Processing Dashboard With Incidents Status Ppt PowerPoint Presentation Gallery Portrait PDF
The following slide outlines a KPI dashboard of data ingestion. The dashboard covers key metrics such as incidents by category and severity, contributing cause, root cause, incident trends and status, etc. Showcasing this set of slides titled Stream Processing Dashboard With Incidents Status Ppt PowerPoint Presentation Gallery Portrait PDF. The topics addressed in these templates are Incidens, Category And Severity, Incidents By Facility, Contributing Cause. All the content presented in this PPT design is completely editable. Download it and make adjustments in color, background, font etc. as per your unique business setting.

KPI Dashboard To Track Automation Performance In Employee Onboarding Achieving Operational Efficiency Download PDF
The following slide outlines performance key performance indicator KPI which can be used to evaluate business process automation performance in employee onboarding. The metrics highlighted in the slide are onboarding completion status, hires per office, etc.Deliver an awe inspiring pitch with this creative KPI Dashboard To Track Automation Performance In Employee Onboarding Achieving Operational Efficiency Download PDF bundle. Topics like Onboarding Completion, Onboarding, Onboarding Completion can be discussed with this completely editable template. It is available for immediate download depending on the needs and requirements of the user.

R2R Dashboard With Income Statement Ppt PowerPoint Presentation Show Slide Download PDF
Following slide outlines a comprehensive R2R dashboard used for taking financial decisions. The various metrics covered in this slide are total income, expenses, net profit, cash at end of month, income and expenses, quick ratio, current ratio etc.Showcasing this set of slides titled R2R Dashboard With Income Statement Ppt PowerPoint Presentation Show Slide Download PDF. The topics addressed in these templates are Operating Expenses, Total Experience, Accounts Receivable. All the content presented in this PPT design is completely editable. Download it and make adjustments in color, background, font etc. as per your unique business setting.
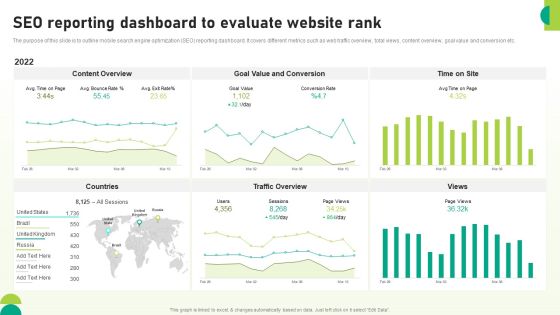
Utilizing SEO To Boost Customer SEO Reporting Dashboard To Evaluate Website Rank Background PDF
The purpose of this slide is to outline mobile search engine optimization SEO reporting dashboard. It covers different metrics such as web traffic overview, total views, content overview, goal value and conversion etc. Take your projects to the next level with our ultimate collection of Utilizing SEO To Boost Customer SEO Reporting Dashboard To Evaluate Website Rank Background PDF. Slidegeeks has designed a range of layouts that are perfect for representing task or activity duration, keeping track of all your deadlines at a glance. Tailor these designs to your exact needs and give them a truly corporate look with your own brand colors theyll make your projects stand out from the rest.
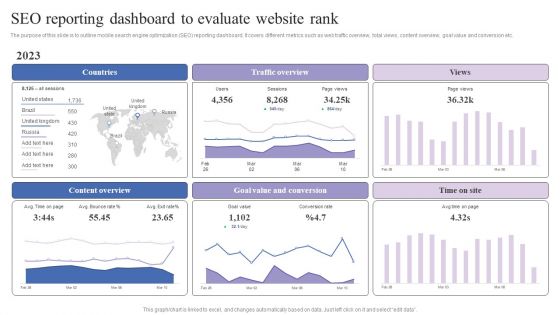
SEO Reporting Dashboard To Evaluate Website Rank Mobile Search Engine Optimization Guide Mockup PDF
The purpose of this slide is to outline mobile search engine optimization SEO reporting dashboard. It covers different metrics such as web traffic overview, total views, content overview, goal value and conversion etc. The best PPT templates are a great way to save time, energy, and resources. Slidegeeks have 100 precent editable powerpoint slides making them incredibly versatile. With these quality presentation templates, you can create a captivating and memorable presentation by combining visually appealing slides and effectively communicating your message. Download SEO Reporting Dashboard To Evaluate Website Rank Mobile Search Engine Optimization Guide Mockup PDF from Slidegeeks and deliver a wonderful presentation.

BPA Tools For Process Enhancement And Cost Minimization KPI Dashboard To Track Automation Performance In Employee Onboarding Graphics PDF
The following slide outlines performance key performance indicator KPI which can be used to evaluate business process automation performance in employee onboarding. The metrics highlighted in the slide are onboarding completion status, hires per office, etc. There are so many reasons you need a BPA Tools For Process Enhancement And Cost Minimization KPI Dashboard To Track Automation Performance In Employee Onboarding Graphics PDF. The first reason is you can not spend time making everything from scratch, Thus, Slidegeeks has made presentation templates for you too. You can easily download these templates from our website easily.

Comprehensive Market Research Guide Brand Analytics Kpi Dashboard For Organization Brochure PDF
The following slide outlines key performance indicator KPI dashboard that can assist marketers to evaluate brand performance on social media channels. The metrics covered are age group, gender, brand perception, branding themes, celebrity analysis, etc. From laying roadmaps to briefing everything in detail, our templates are perfect for you. You can set the stage with your presentation slides. All you have to do is download these easy-to-edit and customizable templates. Comprehensive Market Research Guide Brand Analytics Kpi Dashboard For Organization Brochure PDF will help you deliver an outstanding performance that everyone would remember and praise you for. Do download this presentation today.

Share Market Dashboard Highlighting Price Moving Average Trend Themes PDF
Following slide outlines stock market dashboard of an industry. The various metrics highlighted in the slide are stock codes, previous day price of stock, percent of price change, maximum and lowest price of stock, moving average trend etc. Pitch your topic with ease and precision using this Share Market Dashboard Highlighting Price Moving Average Trend Themes PDF. This layout presents information on Moving Average, Stock Price, Performing Stocks. It is also available for immediate download and adjustment. So, changes can be made in the color, design, graphics or any other component to create a unique layout.

Brand Analytics KPI Dashboard For Organization Ppt PowerPoint Presentation Diagram PDF
The following slide outlines key performance indicator KPI dashboard that can assist marketers to evaluate brand performance on social media channels. The metrics covered are age group, gender, brand perception, branding themes, celebrity analysis, etc. Take your projects to the next level with our ultimate collection of Brand Analytics KPI Dashboard For Organization Ppt PowerPoint Presentation Diagram PDF. Slidegeeks has designed a range of layouts that are perfect for representing task or activity duration, keeping track of all your deadlines at a glance. Tailor these designs to your exact needs and give them a truly corporate look with your own brand colors they will make your projects stand out from the rest.

Market Research To Determine Business Opportunities Brand Analytics KPI Dashboard For Organization Inspiration PDF
The following slide outlines key performance indicator KPI dashboard that can assist marketers to evaluate brand performance on social media channels. The metrics covered are age group, gender, brand perception, branding themes, celebrity analysis, etc. There are so many reasons you need a Market Research To Determine Business Opportunities Brand Analytics KPI Dashboard For Organization Inspiration PDF. The first reason is you cannot spend time making everything from scratch, Thus, Slidegeeks has made presentation templates for you too. You can easily download these templates from our website easily.
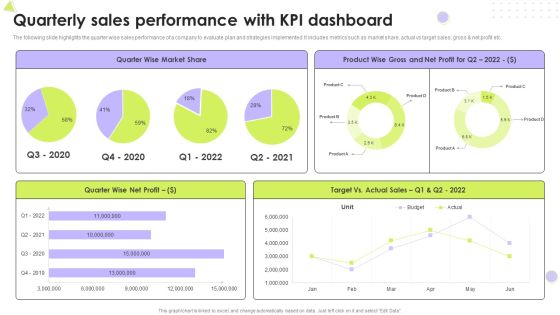
Quarterly Sales Performance With Kpi Dashboard Introduction PDF
The following slide highlights the quarter wise sales performance of a company to evaluate plan and strategies implemented. It includes metrics such as market share, actual vs target sales, gross and net profit etc. Pitch your topic with ease and precision using this Quarterly Sales Performance With Kpi Dashboard Introduction PDF. This layout presents information on Market Share, Net Profit, Target. It is also available for immediate download and adjustment. So, changes can be made in the color, design, graphics or any other component to create a unique layout.

Automation Project Status Dashboard Of Consulting Firm Report Background PDF
This slide showcases project status dashboard that provides a concise visual of key indicators progress and allow to compare actual performance with pre-built objectives. Key metrics covered are cost performance, time v or s project phase, timeline v or s resource capacity. Showcasing this set of slides titled Automation Project Status Dashboard Of Consulting Firm Report Background PDF. The topics addressed in these templates are Project Phase, Planned Value, Cost Performance Index. All the content presented in this PPT design is completely editable. Download it and make adjustments in color, background, font etc. as per your unique business setting.

Investment Project Performance Analysis KPI Dashboard Professional PDF
This slide showcases KPI dashboard for project planning and resource allocation. It also include metrics such as invested amount, return amount, NPV, return to investor, annualized IRR, ROI, payback period, etc. Pitch your topic with ease and precision using this Investment Project Performance Analysis KPI Dashboard Professional PDF. This layout presents information on Project Cash Flows, Project Performance, Innovation Lab. It is also available for immediate download and adjustment. So, changes can be made in the color, design, graphics or any other component to create a unique layout.

Customer Support Services Impact 2 Declining Ticket Backlogs And Support Cost Microsoft PDF
This slide showcases the impact of good support service on the company. The metrics covered are ticket backlog and support cost. Welcome to our selection of the Customer Support Services Impact 2 Declining Ticket Backlogs And Support Cost Microsoft PDF. These are designed to help you showcase your creativity and bring your sphere to life. Planning and Innovation are essential for any business that is just starting out. This collection contains the designs that you need for your everyday presentations. All of our PowerPoints are 100 percent editable, so you can customize them to suit your needs. This multi-purpose template can be used in various situations. Grab these presentation templates today.
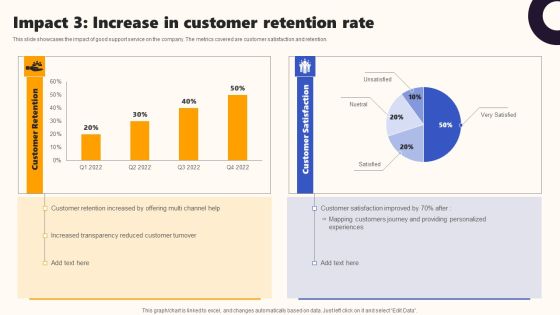
Techniques To Optimize UX Impact 3 Increase In Customer Retention Rate Graphics PDF
This slide showcases the impact of good support service on the company. The metrics covered are customer satisfaction and retention. Welcome to our selection of the Techniques To Optimize UX Impact 3 Increase In Customer Retention Rate Graphics PDF. These are designed to help you showcase your creativity and bring your sphere to life. Planning and Innovation are essential for any business that is just starting out. This collection contains the designs that you need for your everyday presentations. All of our PowerPoints are 100 percent editable, so you can customize them to suit your needs. This multi-purpose template can be used in various situations. Grab these presentation templates today.

Company Payout Dashboard For Subscription Based Startup Designs PDF
The slide carries different metrics to evaluate and record payments of subscription-based business start-up. Various KPIs included are net revenue, MRR, customers, current day revenue, failed and successful payments, live feed- subscription and payments. Pitch your topic with ease and precision using this Company Payout Dashboard For Subscription Based Startup Designs PDF. This layout presents information on Net Revenue, MRR, Customers, Current Day Revenue. It is also available for immediate download and adjustment. So, changes can be made in the color, design, graphics or any other component to create a unique layout.
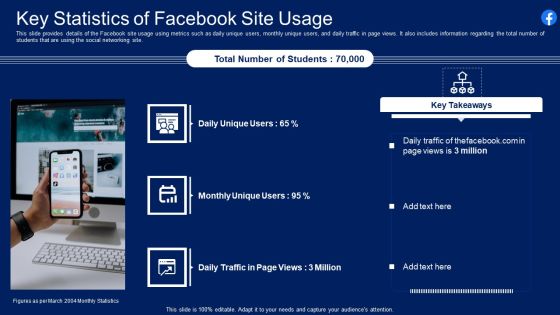
Facebook Original Capital Funding Key Statistics Of Facebook Site Usage Topics PDF
This slide provides details of the Facebook site usage using metrics such as daily unique users, monthly unique users, and daily traffic in page views. It also includes information regarding the total number of students that are using the social networking site. Presenting facebook original capital funding key statistics of facebook site usage topics pdf to provide visual cues and insights. Share and navigate important information on three stages that need your due attention. This template can be used to pitch topics like key statistics of facebook site usage. In addtion, this PPT design contains high resolution images, graphics, etc, that are easily editable and available for immediate download.
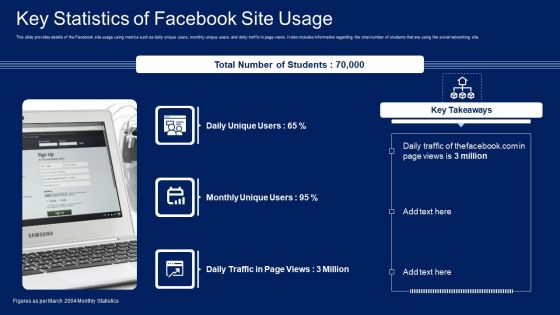
Facebook Original Elevator Funding Pitch Deck Key Statistics Of Facebook Site Usage Background PDF
This slide provides details of the Facebook site usage using metrics such as daily unique users, monthly unique users, and daily traffic in page views. It also includes information regarding the total number of students that are using the social networking site. Presenting Facebook Original Elevator Funding Pitch Deck Key Statistics Of Facebook Site Usage Background PDF to provide visual cues and insights. Share and navigate important information on three stages that need your due attention. This template can be used to pitch topics like Key Statistics. In addtion, this PPT design contains high resolution images, graphics, etc, that are easily editable and available for immediate download.

Dashboard For Tracking Logistics Management Strategy Results Ideas PDF
This slide covers a dashboard for tracking the logistics operations KPIs. It includes metrics such as warehousing operating cost, perfect order rate, total shipments by areas, on time shipments, etc. Pitch your topic with ease and precision using this dashboard for tracking logistics management strategy results ideas pdf. This layout presents information on cost, warehouse, rate. It is also available for immediate download and adjustment. So, changes can be made in the color, design, graphics or any other component to create a unique layout.
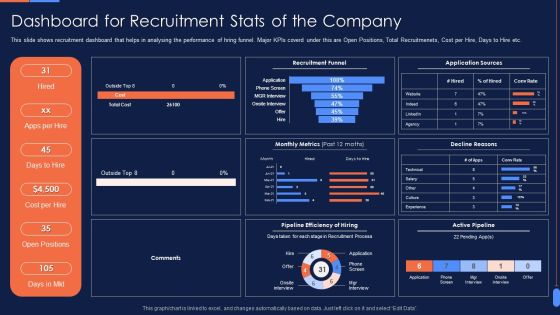
Recruitment Training To Optimize Dashboard For Recruitment Stats Of The Company Structure PDF
This slide shows recruitment dashboard that helps in analysing the performance of hring funnel. Major KPIs coverd under this are Open Positions, Total Recruitmenets, Cost per Hire, Days to Hire etc. Deliver an awe inspiring pitch with this creative Recruitment Training To Optimize Dashboard For Recruitment Stats Of The Company Structure PDF bundle. Topics like Cost Per Hire, Open Positions, Apps Per Hire, Pipeline Efficiency Of Hiring, Monthly Metrics can be discussed with this completely editable template. It is available for immediate download depending on the needs and requirements of the user.
Remarketing Techniques Dashboard For Tracking Facebook Retargeting Campaign Sample PDF
This slide covers metrics for analysing the results of Facebook retargeting campaign. It includes KPIs such as ad spend, cost per click, click-through rate, ad reach, post engagement, ad clicks, ad impressions, link clicks, etc. Deliver an awe inspiring pitch with this creative Remarketing Techniques Dashboard For Tracking Facebook Retargeting Campaign Sample PDF bundle. Topics like Ad Spend, Cost Per Thousand, Cost Per Click, Clicks Through Rate can be discussed with this completely editable template. It is available for immediate download depending on the needs and requirements of the user.
Effective Company Event Communication Tactics Dashboard For Tracking Active Number Of Attendances Demonstration PDF
This slide covers metrics for analyzing the number of most active event participants. It includes KPIs such as check-in status, contract roles, top industries, contract by country, top 5 job functions, etc. Deliver and pitch your topic in the best possible manner with this Effective Company Event Communication Tactics Dashboard For Tracking Active Number Of Attendances Demonstration PDF. Use them to share invaluable insights on Attendance, Exhibitors, Management and impress your audience. This template can be altered and modified as per your expectations. So, grab it now.

Conversational Marketing Dashboard For B2B And B2C Organization Sample PDF
Purpose of the following slide is to show key metrics that can help the organization to track conversational marketing efforts, it highlights essential KPIs such as open opportunities, qualified influence etc. Deliver and pitch your topic in the best possible manner with this Conversational Marketing Dashboard For B2B And B2C Organization Sample PDF. Use them to share invaluable insights on Conversational Marketing Dashboard, B2c Organization and impress your audience. This template can be altered and modified as per your expectations. So, grab it now.

Consumer Retargeting Techniques Dashboard For Tracking Facebook Retargeting Campaign Ideas PDF
This slide covers metrics for analysing the results of Facebook retargeting campaign. It includes KPIs such as ad spend, cost per click, click-through rate, ad reach, post engagement, ad clicks, ad impressions, link clicks, etc. Deliver an awe inspiring pitch with this creative Consumer Retargeting Techniques Dashboard For Tracking Facebook Retargeting Campaign Ideas PDF bundle. Topics like Cost Thousand, Cost Per, Through Rate can be discussed with this completely editable template. It is available for immediate download depending on the needs and requirements of the user.
Strategies To Attract Customers And Lead Generation Dashboard For Tracking Facebook Retargeting Campaign Graphics PDF
This slide covers metrics for analysing the results of Facebook retargeting campaign. It includes KPIs such as ad spend, cost per click, click through rate, ad reach, post engagement, ad clicks, ad impressions, link clicks, etc. Deliver and pitch your topic in the best possible manner with this Strategies To Attract Customers And Lead Generation Dashboard For Tracking Facebook Retargeting Campaign Graphics PDF. Use them to share invaluable insights on Cost Per Click, Dashboard, Tracking Facebook Retargeting Campaign and impress your audience. This template can be altered and modified as per your expectations. So, grab it now.

Account Based Marketing Customer Engagement Dashboard Infographics PDF
Purpose of the following slide is to show key metrics that can help the organization to track their account based marketing efforts, it highlights essential KPIs such as CTR, session by account. Boost your pitch with our creative Account Based Marketing Customer Engagement Dashboard Infographics PDF. Deliver an awe inspiring pitch that will mesmerize everyone. Using these presentation templates you will surely catch everyones attention. You can browse the ppts collection on our website. We have researchers who are experts at creating the right content for the templates. So you do not have to invest time in any additional work. Just grab the template now and use them.

Account Based Marketing Customer Engagement Dashboard Demonstration PDF
Purpose of the following slide is to show key metrics that can help the organization to track their account based marketing efforts, it highlights essential KPIs such as CTR, session by account.Find a pre-designed and impeccable Account Based Marketing Customer Engagement Dashboard Demonstration PDF. The templates can ace your presentation without additional effort. You can download these easy-to-edit presentation templates to make your presentation stand out from others. So, what are you waiting for Download the template from Slidegeeks today and give a unique touch to your presentation.

Conversational Marketing Dashboard For B2B And B2C Organization Mockup PDF
Purpose of the following slide is to show key metrics that can help the organization to track conversational marketing efforts, it highlights essential KPIs such as subscribers, e-mail sent, sessions through link sent on e-mail. If your project calls for a presentation, then Slidegeeks is your go-to partner because we have professionally designed, easy-to-edit templates that are perfect for any presentation. After downloading, you can easily edit Conversational Marketing Dashboard For B2B And B2C Organization Mockup PDF and make the changes accordingly. You can rearrange slides or fill them with different images. Check out all the handy templates.

Supermarket Online Service Delivery And Management Dashboard Formats PDF
This slide shows the online grocery delivery dashboard of various products based on certain metrics and KPIs to achieve grocery retail revenue goals. It includes total orders, total customers total categories, and revenue. Showcasing this set of slides titled Supermarket Online Service Delivery And Management Dashboard Formats PDF. The topics addressed in these templates are Total Revenue, Total Customers, Dashboard. All the content presented in this PPT design is completely editable. Download it and make adjustments in color, background, font etc. as per your unique business setting.

Organizational Expense Management With Kpi Dashboard Slides PDF
The following slide highlights the key metrics to assess the organizational expenses and meet financial goals. It includes KPIs such as quarterly and annual business expense details, expenditure breakdown etc. Showcasing this set of slides titled Organizational Expense Management With Kpi Dashboard Slides PDF. The topics addressed in these templates are Annual Expenses, Expense Details, Expense Breakdown. All the content presented in this PPT design is completely editable. Download it and make adjustments in color, background, font etc. as per your unique business setting.

Customer Support Services Issue 1 Increasing Average Response Time Formats PDF
This slide provides an overview of major KPIs of customer service team. The metrics covered are average response time and first call resolution. The best PPT templates are a great way to save time, energy, and resources. Slidegeeks have 100 percent editable powerpoint slides making them incredibly versatile. With these quality presentation templates, you can create a captivating and memorable presentation by combining visually appealing slides and effectively communicating your message. Download Customer Support Services Issue 1 Increasing Average Response Time Formats PDF from Slidegeeks and deliver a wonderful presentation.

Customer Support Services Issue 2 Increase In Ticket Backlogs And Support Cost Topics PDF
This slide provides an overview of major KPIs of customer service team that impact the organization. The metrics covered are ticket backlog and support cost. The Customer Support Services Issue 2 Increase In Ticket Backlogs And Support Cost Topics PDF is a compilation of the most recent design trends as a series of slides. It is suitable for any subject or industry presentation, containing attractive visuals and photo spots for businesses to clearly express their messages. This template contains a variety of slides for the user to input data, such as structures to contrast two elements, bullet points, and slides for written information. Slidegeeks is prepared to create an impression.

Selling App Development Launch And Marketing Application Performance Dashboard Inspiration PDF
This slide covers application performance in market KPIs and metrics such as impressions, clicks, searches for app, conversion rate etc. This Selling App Development Launch And Marketing Application Performance Dashboard Inspiration PDF from Slidegeeks makes it easy to present information on your topic with precision. It provides customization options, so you can make changes to the colors, design, graphics, or any other component to create a unique layout. It is also available for immediate download, so you can begin using it right away. Slidegeeks has done good research to ensure that you have everything you need to make your presentation stand out. Make a name out there for a brilliant performance.
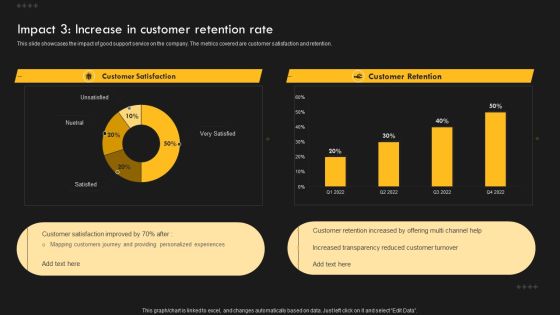
Service Improvement Techniques For Client Retention Impact 3 Increase In Customer Retention Rate Themes PDF
This slide provides an overview of major KPIs of customer service team. The metrics covered are average response time and first call resolution. The best PPT templates are a great way to save time, energy, and resources. Slidegeeks have 100 percent editable powerpoint slides making them incredibly versatile. With these quality presentation templates, you can create a captivating and memorable presentation by combining visually appealing slides and effectively communicating your message. Download Service Improvement Techniques For Client Retention Impact 3 Increase In Customer Retention Rate Themes PDF from Slidegeeks and deliver a wonderful presentation.

Service Improvement Techniques For Client Retention Issue 1 Increasing Average Response Time Template PDF
This slide provides an overview of major KPIs of customer service team that impact the organization. The metrics covered are ticket backlog and support cost. The Service Improvement Techniques For Client Retention Issue 1 Increasing Average Response Time Template PDF is a compilation of the most recent design trends as a series of slides. It is suitable for any subject or industry presentation, containing attractive visuals and photo spots for businesses to clearly express their messages. This template contains a variety of slides for the user to input data, such as structures to contrast two elements, bullet points, and slides for written information. Slidegeeks is prepared to create an impression.
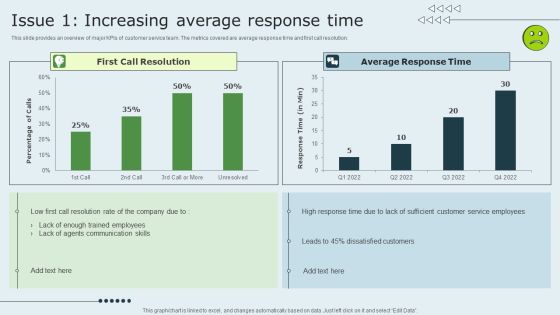
Enhancing Client Experience Issue 1 Increasing Average Response Time Microsoft PDF
This slide provides an overview of major KPIs of customer service team. The metrics covered are average response time and first call resolution. Slidegeeks is here to make your presentations a breeze with Enhancing Client Experience Issue 1 Increasing Average Response Time Microsoft PDF With our easy-to-use and customizable templates, you can focus on delivering your ideas rather than worrying about formatting. With a variety of designs to choose from, youre sure to find one that suits your needs. And with animations and unique photos, illustrations, and fonts, you can make your presentation pop. So whether youre giving a sales pitch or presenting to the board, make sure to check out Slidegeeks first.
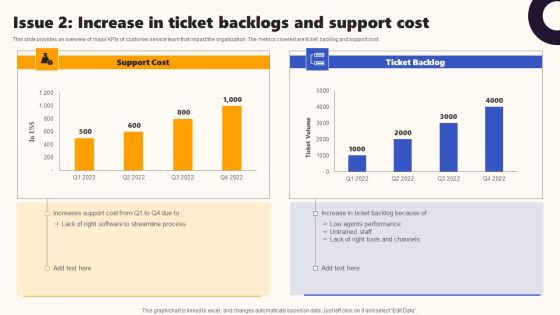
Techniques To Optimize UX Issue 2 Increase In Ticket Backlogs And Support Cost Inspiration PDF
This slide provides an overview of major KPIs of customer service team that impact the organization. The metrics covered are ticket backlog and support cost. The best PPT templates are a great way to save time, energy, and resources. Slidegeeks have 100 percent editable powerpoint slides making them incredibly versatile. With these quality presentation templates, you can create a captivating and memorable presentation by combining visually appealing slides and effectively communicating your message. Download Techniques To Optimize UX Issue 2 Increase In Ticket Backlogs And Support Cost Inspiration PDF from Slidegeeks and deliver a wonderful presentation.
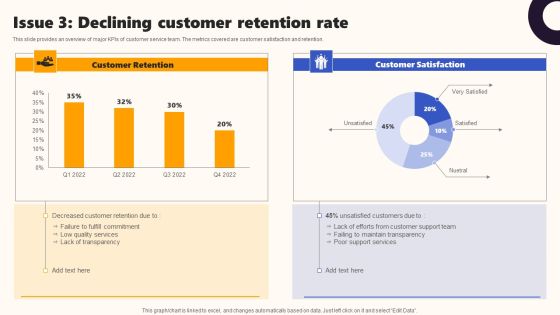
Techniques To Optimize UX Issue 3 Declining Customer Retention Rate Structure PDF
This slide provides an overview of major KPIs of customer service team. The metrics covered are customer satisfaction and retention. The Techniques To Optimize UX Issue 3 Declining Customer Retention Rate Structure PDF is a compilation of the most recent design trends as a series of slides. It is suitable for any subject or industry presentation, containing attractive visuals and photo spots for businesses to clearly express their messages. This template contains a variety of slides for the user to input data, such as structures to contrast two elements, bullet points, and slides for written information. Slidegeeks is prepared to create an impression.
Retargeting Strategies To Improve Sales Dashboard For Tracking Facebook Retargeting Campaign Background PDF
This slide covers metrics for analysing the results of Facebook retargeting campaign. It includes KPIs such as ad spend, cost per click, click-through rate, ad reach, post engagement, ad clicks, ad impressions, link clicks, etc. Want to ace your presentation in front of a live audience Our Retargeting Strategies To Improve Sales Dashboard For Tracking Facebook Retargeting Campaign Background PDF can help you do that by engaging all the users towards you.. Slidegeeks experts have put their efforts and expertise into creating these impeccable powerpoint presentations so that you can communicate your ideas clearly. Moreover, all the templates are customizable, and easy-to-edit and downloadable. Use these for both personal and commercial use.

Strategies To Improve Customer Support Services Issue 1 Increasing Average Response Time Elements PDF
This slide provides an overview of major KPIs of customer service team. The metrics covered are average response time and first call resolution. From laying roadmaps to briefing everything in detail, our templates are perfect for you. You can set the stage with your presentation slides. All you have to do is download these easy to edit and customizable templates. Strategies To Improve Customer Support Services Issue 1 Increasing Average Response Time Elements PDF will help you deliver an outstanding performance that everyone would remember and praise you for. Do download this presentation today.
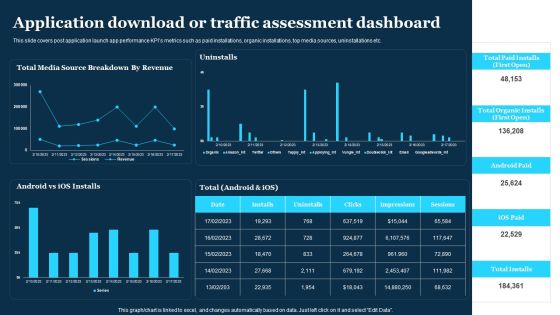
Play Store Launch Techniques For Shopping Apps Application Download Traffic Assessment Structure PDF
This slide covers post application launch app performance KPIs metrics such as paid installations, organic installations, top media sources, uninstallations etc. From laying roadmaps to briefing everything in detail, our templates are perfect for you. You can set the stage with your presentation slides. All you have to do is download these easy to edit and customizable templates. Play Store Launch Techniques For Shopping Apps Application Download Traffic Assessment Structure PDF will help you deliver an outstanding performance that everyone would remember and praise you for. Do download this presentation today.
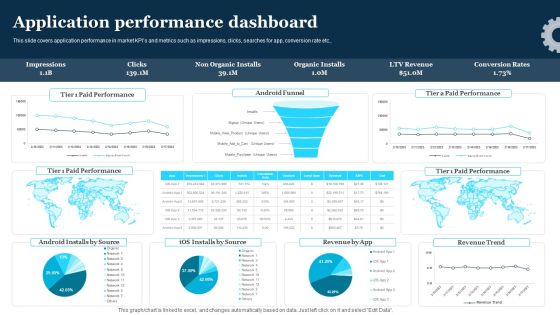
Play Store Launch Techniques For Shopping Apps Application Performance Dashboard Template PDF
This slide covers application performance in market KPIs and metrics such as impressions, clicks, searches for app, conversion rate etc., Present like a pro with Play Store Launch Techniques For Shopping Apps Application Performance Dashboard Template PDF Create beautiful presentations together with your team, using our easy to use presentation slides. Share your ideas in real time and make changes on the fly by downloading our templates. So whether you are in the office, on the go, or in a remote location, you can stay in sync with your team and present your ideas with confidence. With Slidegeeks presentation got a whole lot easier. Grab these presentations today.

Property Rental Portfolio Dashboard Topics PDF
The following slide presents a real estate portfolio dashboard for rental and letting out with key performance indicator metrics to provide information at glance. The KPIs covered in this dashboard are number of property viewings, actively let properties etc. Showcasing this set of slides titled Property Rental Portfolio Dashboard Topics PDF. The topics addressed in these templates are People Registered Looking, Actively Let Properties, Average Property Letting Time. All the content presented in this PPT design is completely editable. Download it and make adjustments in color, background, font etc. as per your unique business setting.
Online Marketing Analytics To Enhance Business Growth Website Landing Page KPI Tracking Dashboard Sample PDF
This slide covers a dashboard for analyzing the metrics of the website landing page. It includes KPIs such as conversions, conversion rate, sessions, bounce rate, engagement sickness, etc. If your project calls for a presentation, then Slidegeeks is your go to partner because we have professionally designed, easy to edit templates that are perfect for any presentation. After downloading, you can easily edit Online Marketing Analytics To Enhance Business Growth Website Landing Page KPI Tracking Dashboard Sample PDF and make the changes accordingly. You can rearrange slides or fill them with different images. Check out all the handy templates

 Home
Home