Metric Comparison
Lead Tracking Dashboard With Metric Comparison Brochure PDF
This slide showcases dashboard of lead pipeline that can help to identify total number of leads generated and expenses incurred to acquire the audience. It also showcases other key performance metrics like lead breakdown by status and number of leads per month. Pitch your topic with ease and precision using this Lead Tracking Dashboard With Metric Comparison Brochure PDF. This layout presents information on Metric Comparison, Lead Pipeline, Lead Breakdown Status. It is also available for immediate download and adjustment. So, changes can be made in the color, design, graphics or any other component to create a unique layout.

Product Performance Metrics Comparison In Automotive Industry Topics Pdf
This slide includes the KPI comparison for automotive industry product performance to enhance product management. This includes various KPIs such as on time delivery rate, inventory turns, scrap and reject, etc. Showcasing this set of slides titled Product Performance Metrics Comparison In Automotive Industry Topics Pdf. The topics addressed in these templates are Inventory Turns, Supplier Quality Score, Energy Usage And Cost. All the content presented in this PPT design is completely editable. Download it and make adjustments in color, background, font etc. as per your unique business setting.

Comparison Metrics For Business Partner Lifecycle Management Guidelines PDF
The following slide highlights the comparison metrics for partner lifecycle management illustrating key headings which includes comparison area, comparison metric, high score, low score and partner. Where comparison are depicts business size, management, growth strategy, integration and finance. Pitch your topic with ease and precision using this Comparison Metrics For Business Partner Lifecycle Management Guidelines PDF. This layout presents information on Business Size, Management, Growth Strategy. It is also available for immediate download and adjustment. So, changes can be made in the color, design, graphics or any other component to create a unique layout.

Marketing Success Metrics Top Marketing Analytics Software Comparison Template PDF
This slide covers a comparative analysis of the market analytics system based on features such as real-time analytics and insights, brand measurement capabilities, contextualized customer and market insights, annual media plan recommendations, etc. Create an editable Marketing Success Metrics Top Marketing Analytics Software Comparison Template PDF that communicates your idea and engages your audience. Whether youre presenting a business or an educational presentation, pre-designed presentation templates help save time. Marketing Success Metrics Top Marketing Analytics Software Comparison Template PDF is highly customizable and very easy to edit, covering many different styles from creative to business presentations. Slidegeeks has creative team members who have crafted amazing templates. So, go and get them without any delay.
Comparison Metrics Of Digital And Offline Marketing Ppt Icon Format PDF
This slide showcases essential key performance indicators of online and offline marketing. Key metrics covered are spend, lead generated, revenue and customer retention. Persuade your audience using this Comparison Metrics Of Digital And Offline Marketing Ppt Icon Format PDF. This PPT design covers four stages, thus making it a great tool to use. It also caters to a variety of topics including Lead Generated, Revenue, Customer Retention, Spend. Download this PPT design now to present a convincing pitch that not only emphasizes the topic but also showcases your presentation skills.
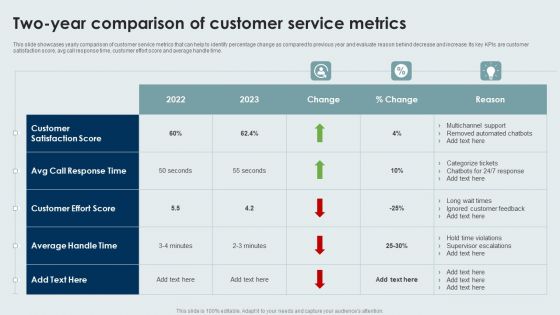
Two Year Comparison Of Customer Service Metrics Information PDF
This slide showcases yearly comparison of customer service metrics that can help to identify percentage change as compared to previous year and evaluate reason behind decrease and increase. Its key KPIs are customer satisfaction score, avg call response time, customer effort score and average handle time. Pitch your topic with ease and precision using this Two Year Comparison Of Customer Service Metrics Information PDF. This layout presents information on Customer Effort Score, Customer Satisfaction Score, Average Handle Time. It is also available for immediate download and adjustment. So, changes can be made in the color, design, graphics or any other component to create a unique layout.
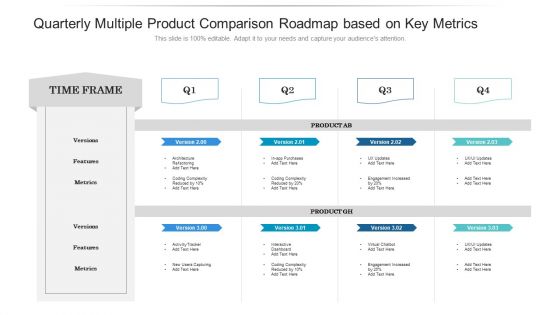
Quarterly Multiple Product Comparison Roadmap Based On Key Metrics Structure
Introducing our quarterly multiple product comparison roadmap based on key metrics structure. This PPT presentation is Google Slides compatible, therefore, you can share it easily with the collaborators for measuring the progress. Also, the presentation is available in both standard screen and widescreen aspect ratios. So edit the template design by modifying the font size, font type, color, and shapes as per your requirements. As this PPT design is fully editable it can be presented in PDF, JPG and PNG formats.

Maintaining Customer Relations Financial Statement Comparison Productivity Metrics Ppt PowerPoint Presentation Infographics Graphic Images
This is a maintaining customer relations financial statement comparison productivity metrics ppt powerpoint presentation infographics graphic images. This is a six stage process. The stages in this process are maintaining customer relations, financial statement comparison, productivity metrics.
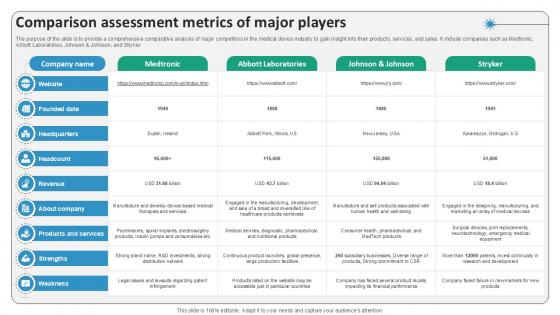
Comparison Assessment Metrics Of Major Players Surgical Devices Ppt Slides IR SS V
The purpose of the slide is to provide a comprehensive comparative analysis of major competitors in the medical device industry to gain insight into their products, services, and sales. It include companies such as Medtronic, Abbott Laboratories, Johnson and Johnson, and Stryker. Do you have to make sure that everyone on your team knows about any specific topic I yes, then you should give Comparison Assessment Metrics Of Major Players Surgical Devices Ppt Slides IR SS V a try. Our experts have put a lot of knowledge and effort into creating this impeccable Comparison Assessment Metrics Of Major Players Surgical Devices Ppt Slides IR SS V. You can use this template for your upcoming presentations, as the slides are perfect to represent even the tiniest detail. You can download these templates from the Slidegeeks website and these are easy to edit. So grab these today
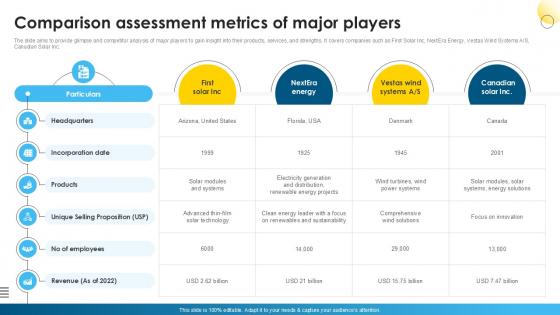
Comparison Assessment Metrics Global Wind Power Market PPT Template IR SS V
The slide aims to provide glimpse and competitor analysis of major players to gain insight into their products, services, and strengths. It covers companies such as First Solar Inc, NextEra Energy, Vestas Wind Systems AS, Canadian Solar Inc. Slidegeeks is one of the best resources for PowerPoint templates. You can download easily and regulate Comparison Assessment Metrics Global Wind Power Market PPT Template IR SS V for your personal presentations from our wonderful collection. A few clicks is all it takes to discover and get the most relevant and appropriate templates. Use our Templates to add a unique zing and appeal to your presentation and meetings. All the slides are easy to edit and you can use them even for advertisement purposes.

Comparison Of Lean Production Metrics With Competitors Deploying And Managing Lean Ideas PDF
This slide represents lean production comparison metrics with competitors. It includes unexpected outrages rate, cost of work order, overall equipment efficiency etc.This is a Comparison Of Lean Production Metrics With Competitors Deploying And Managing Lean Ideas PDF template with various stages. Focus and dispense information on one stage using this creative set, that comes with editable features. It contains large content boxes to add your information on topics like Unexpected Outages, Average Lead, Recurring Issues. You can also showcase facts, figures, and other relevant content using this PPT layout. Grab it now.
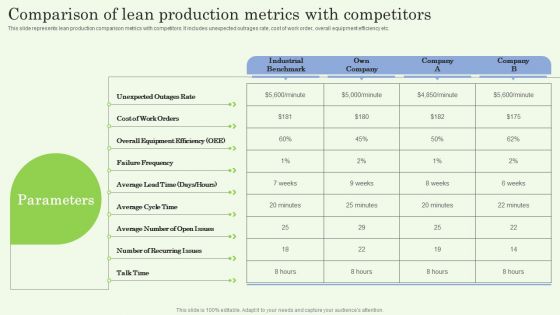
Comparison Of Lean Production Metrics With Competitors Ppt PowerPoint Presentation Diagram Lists PDF
This slide represents lean production comparison metrics with competitors. It includes unexpected outrages rate, cost of work order, overall equipment efficiency etc. Get a simple yet stunning designed Comparison Of Lean Production Metrics With Competitors Ppt PowerPoint Presentation Diagram Lists PDF. It is the best one to establish the tone in your meetings. It is an excellent way to make your presentations highly effective. So, download this PPT today from Slidegeeks and see the positive impacts. Our easy to edit Comparison Of Lean Production Metrics With Competitors Ppt PowerPoint Presentation Diagram Lists PDF can be your go to option for all upcoming conferences and meetings. So, what are you waiting for Grab this template today.
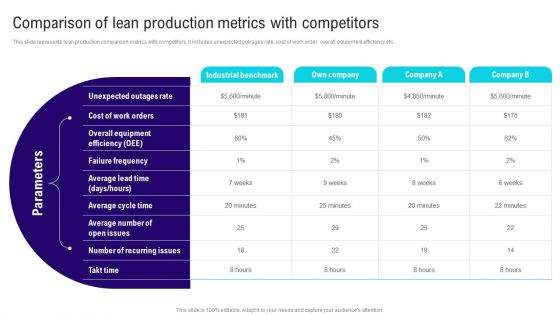
Implementing Lean Production Tool And Techniques Comparison Of Lean Production Metrics Introduction PDF
This slide represents lean production comparison metrics with competitors. It includes unexpected outrages rate, cost of work order, overall equipment efficiency etc. Crafting an eye catching presentation has never been more straightforward. Let your presentation shine with this tasteful yet straightforward Implementing Lean Production Tool And Techniques Comparison Of Lean Production Metrics Introduction PDF template. It offers a minimalistic and classy look that is great for making a statement. The colors have been employed intelligently to add a bit of playfulness while still remaining professional. Construct the ideal Implementing Lean Production Tool And Techniques Comparison Of Lean Production Metrics Introduction PDF that effortlessly grabs the attention of your audience. Begin now and be certain to wow your customers.
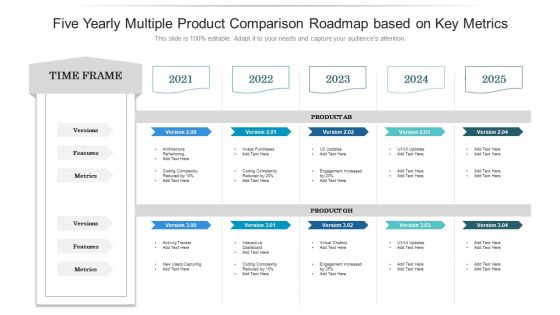
Five Yearly Multiple Product Comparison Roadmap Based On Key Metrics Slides
Introducing our five yearly multiple product comparison roadmap based on key metrics slides. This PPT presentation is Google Slides compatible, therefore, you can share it easily with the collaborators for measuring the progress. Also, the presentation is available in both standard screen and widescreen aspect ratios. So edit the template design by modifying the font size, font type, color, and shapes as per your requirements. As this PPT design is fully editable it can be presented in PDF, JPG and PNG formats.

Half Yearly Multiple Product Comparison Roadmap Based On Key Metrics Download
Introducing our half yearly multiple product comparison roadmap based on key metrics download. This PPT presentation is Google Slides compatible, therefore, you can share it easily with the collaborators for measuring the progress. Also, the presentation is available in both standard screen and widescreen aspect ratios. So edit the template design by modifying the font size, font type, color, and shapes as per your requirements. As this PPT design is fully editable it can be presented in PDF, JPG and PNG formats.

Six Months Multiple Product Comparison Roadmap Based On Key Metrics Infographics
Introducing our six months multiple product comparison roadmap based on key metrics infographics. This PPT presentation is Google Slides compatible, therefore, you can share it easily with the collaborators for measuring the progress. Also, the presentation is available in both standard screen and widescreen aspect ratios. So edit the template design by modifying the font size, font type, color, and shapes as per your requirements. As this PPT design is fully editable it can be presented in PDF, JPG and PNG formats.
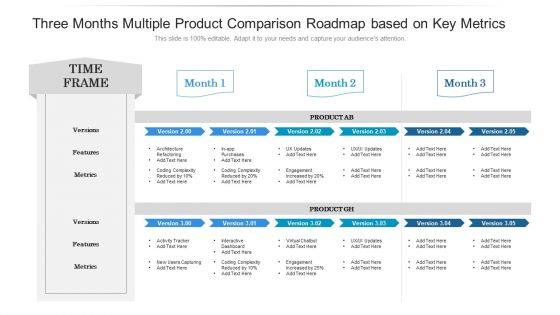
Three Months Multiple Product Comparison Roadmap Based On Key Metrics Information
Introducing our three months multiple product comparison roadmap based on key metrics information. This PPT presentation is Google Slides compatible, therefore, you can share it easily with the collaborators for measuring the progress. Also, the presentation is available in both standard screen and widescreen aspect ratios. So edit the template design by modifying the font size, font type, color, and shapes as per your requirements. As this PPT design is fully editable it can be presented in PDF, JPG and PNG formats.

Client Self Service Metric Dashboard Brochure Pdf
The following slide highlights dashboard for customer self service to limit repetitive questions and facilitate support staff to handle complex issues. It includes components such as self service score, unique customers who survey help content, unique customers who produced tickets etc. Pitch your topic with ease and precision using this Client Self Service Metric Dashboard Brochure Pdf. This layout presents information on Self Service Score, Published, Content Type. It is also available for immediate download and adjustment. So, changes can be made in the color, design, graphics or any other component to create a unique layout.

Comparison Chart For Performance Analysis Ppt Design
This is a comparison chart for performance analysis ppt design. This is a two stage process. The stages in this process are compare, scale, measurement, business, marketing.

Comparison Ppt PowerPoint Presentation Inspiration Structure
This is a comparison ppt powerpoint presentation inspiration structure. This is a two stage process. The stages in this process are compare, measure, finance, percentage, business.

State Comparison Of HDI Matrix Introduction PDF
Following slides shows human development index state comparison matrix which will assist in measuring which state need to be focused more for economic growth It includes various states such as Alaska, Indiana, Florida, etc. Showcasing this set of slides titled State Comparison Of HDI Matrix Introduction PDF. The topics addressed in these templates are State Comparison, Value, Hdi Matrix . All the content presented in this PPT design is completely editable. Download it and make adjustments in color, background, font etc. as per your unique business setting.

Virtual Onboarding Software Comparison Matrix Sample PDF
The slide presents software comparison matrix to evaluate remotely onboarded employees performance. It contains application names such as hub staff, google drive, slack etc. along with features, pricing, comments. Showcasing this set of slides titled Virtual Onboarding Software Comparison Matrix Sample PDF. The topics addressed in these templates are Monitoring Employee Productivity, Management Payrolls, Spreadsheets Presentation. All the content presented in this PPT design is completely editable. Download it and make adjustments in color, background, font etc. as per your unique business setting.

Residential Estate Market Comparison Matrix Slides PDF
This slide shows comparison matrix of residential property to give a detailed overview of all available options. It include measure such as price status, built date and no of bedrooms etc. Persuade your audience using this Residential Estate Market Comparison Matrix Slides PDF. This PPT design covers five stages, thus making it a great tool to use. It also caters to a variety of topics including Price Status, Measures, Pyramid Circle. Download this PPT design now to present a convincing pitch that not only emphasizes the topic but also showcases your presentation skills.
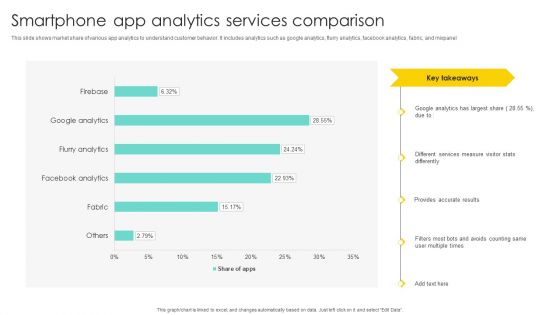
Smartphone App Analytics Services Comparison Brochure PDF
This slide shows market share of various app analytics to understand customer behavior. It includes analytics such as google analytics, flurry analytics, facebook analytics, fabric, and mixpanel. Pitch your topic with ease and precision using this Smartphone App Analytics Services Comparison Brochure PDF. This layout presents information on Different Services Measure, Visitor Stats Differently, Provides Accurate Results. It is also available for immediate download and adjustment. So, changes can be made in the color, design, graphics or any other component to create a unique layout.

Comparison Between Agile And Scrum IT Scrum Vs Kanban Comparison Between Agile Approaches Slides PDF
Mentioned slide shows a comparison between agile approaches namely scrum and Kanban based on parameters namely meetings, work-in-progress, KPIs and roles. This is a comparison between agile and scrum it scrum vs kanban comparison between agile approaches slides pdf template with various stages. Focus and dispense information on two stages using this creative set, that comes with editable features. It contains large content boxes to add your information on topics like scrum, kanban, meetings work progress, key performance indicators, roles. You can also showcase facts, figures, and other relevant content using this PPT layout. Grab it now.

Comparison Between White Black And Grey Hat SEO Training Ppt
The following slide depicts the comparison of white, black, and grey hat SEO. The multiple parameters used for comparison are search engine guidelines, ideal for long term, time taken to deliver results, cost involved long term, and risk involved.

Comparison Of Broad And Long Tail Keywords Training Ppt
This slide provides information regarding the comparison of board and long-tail keywords on multiple factors such as the number of words, search intent, keyword search volume, keyword competition, effort required to rank, and conversion rate.
Icon For Customer Retention Business Metric Template Pdf
Pitch your topic with ease and precision using this Icon For Customer Retention Business Metric Template Pdf. This layout presents information on Icon For Customer, Retention Business Metric. It is also available for immediate download and adjustment. So, changes can be made in the color, design, graphics or any other component to create a unique layout.
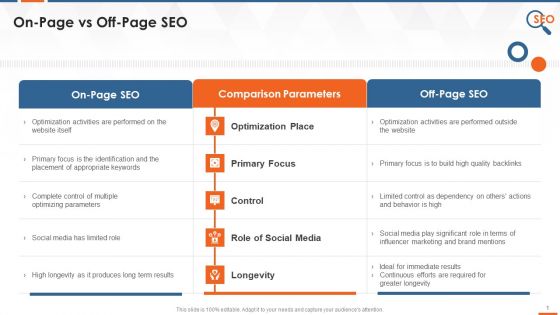
Comparison Of On Page And Off Page SEO Training Ppt
This slide highlights the difference between on-page and off-page SEO based on multiple parameters such as optimization place, primary focus, control, role of social media, and longevity.
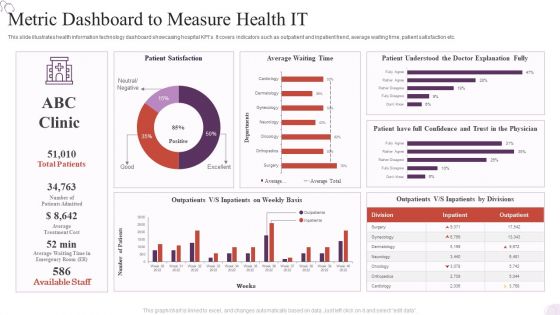
Metric Dashboard To Measure Health IT Background PDF
Pitch your topic with ease and precision using this Metric Dashboard To Measure Health IT Background PDF. This layout presents information on Metric Dashboard, Patient Satisfaction, Average Waiting Time. It is also available for immediate download and adjustment. So, changes can be made in the color, design, graphics or any other component to create a unique layout.
Icon Showcasing Metric To Track Business Diversity Mockup PDF

Process Advancement Scheme Goal Question Metric Model Themes PDF
This slide provides the glimpse about the GQM technique to evaluate the current situation of the company which focuses on goal, question and metric to evaluate the current situation of the software company. This is a process advancement scheme goal question metric model themes pdf template with various stages. Focus and dispense information on three stages using this creative set, that comes with editable features. It contains large content boxes to add your information on topics like metric, questions, goal, analysis warnings. You can also showcase facts, figures, and other relevant content using this PPT layout. Grab it now.
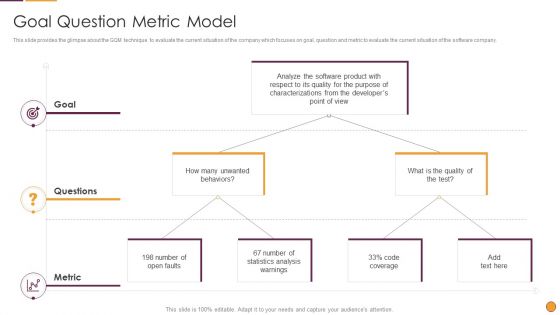
Process Enhancement Program Success Goal Question Metric Model Download PDF
This is a Process Enhancement Program Success Goal Question Metric Model Download PDF template with various stages. Focus and dispense information on three stages using this creative set, that comes with editable features. It contains large content boxes to add your information on topics like Goal Questions, Metric Behaviors, Quality Test. You can also showcase facts, figures, and other relevant content using this PPT layout. Grab it now.

Small Business Advertising With Social Media Metric Map Graphics PDF
This slide represents a social media metric map for small businesses to effectively conduct social media advertising by analysing objective, consumer needs and build strong bonds with them. It includes aspects such as buyers journey, objective, social media strategy, social activity, social KPIs and business impact. Pitch your topic with ease and precision using this Small Business Advertising With Social Media Metric Map Graphics PDF. This layout presents information on Awareness, Consideration, Decision . It is also available for immediate download and adjustment. So, changes can be made in the color, design, graphics or any other component to create a unique layout.
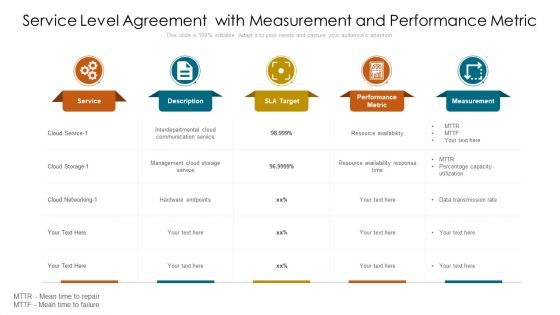
Service Level Agreement With Measurement And Performance Metric Themes PDF
Pitch your topic with ease and precision using this service level agreement with measurement and performance metric themes pdf. This layout presents information on service, measurement, target. It is also available for immediate download and adjustment. So, changes can be made in the color, design, graphics or any other component to create a unique layout.

Metric Checklist To Measure Supplier Diversity And Performance Pictures PDF
This slide represents KPI checklist to assess and monitor supplier diversity program performance. It provides information such as develop objective, identify KPI, establish baseline, data analysis and tracking. Pitch your topic with ease and precision using this Metric Checklist To Measure Supplier Diversity And Performance Pictures PDF. This layout presents information on Create Objective, Establish Baseline, Data Analysis. It is also available for immediate download and adjustment. So, changes can be made in the color, design, graphics or any other component to create a unique layout.

Inclusive Diversity Strategic Objectives With Metric Elements PDF
This slide highlight strategic inclusive diversity objectives with KPIs which help increase business stability and security and create powerful employee connections. It provides information regarding team building, growth opportunities and intention. Pitch your topic with ease and precision using this Inclusive Diversity Strategic Objectives With Metric Elements PDF. This layout presents information on Team Building, Growth Opportunities, Intention. It is also available for immediate download and adjustment. So, changes can be made in the color, design, graphics or any other component to create a unique layout.
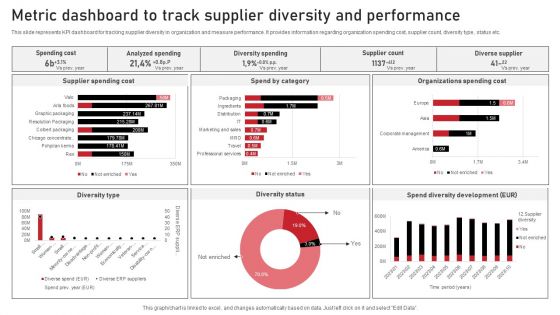
Metric Dashboard To Track Supplier Diversity And Performance Designs PDF
This slide represents KPI dashboard for tracking supplier diversity in organization and measure performance. It provides information regarding organization spending cost, supplier count, diversity type, status etc. Pitch your topic with ease and precision using this Metric Dashboard To Track Supplier Diversity And Performance Designs PDF. This layout presents information on Diversity Type, Diversity Status, Diverse Supplier. It is also available for immediate download and adjustment. So, changes can be made in the color, design, graphics or any other component to create a unique layout.
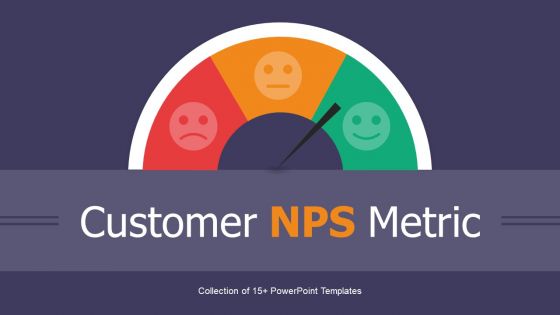
Customer NPS Metric Ppt PowerPoint Presentation Complete Deck With Slides
Boost your confidence and team morale with this well-structured Customer NPS Metric Ppt PowerPoint Presentation Complete Deck With Slides. This prefabricated set gives a voice to your presentation because of its well-researched content and graphics. Our experts have added all the components very carefully, thus helping you deliver great presentations with a single click. Not only that, it contains a set of seventeen slides that are designed using the right visuals, graphics, etc. Various topics can be discussed, and effective brainstorming sessions can be conducted using the wide variety of slides added in this complete deck. Apart from this, our PPT design contains clear instructions to help you restructure your presentations and create multiple variations. The color, format, design anything can be modified as deemed fit by the user. Not only this, it is available for immediate download. So, grab it now.
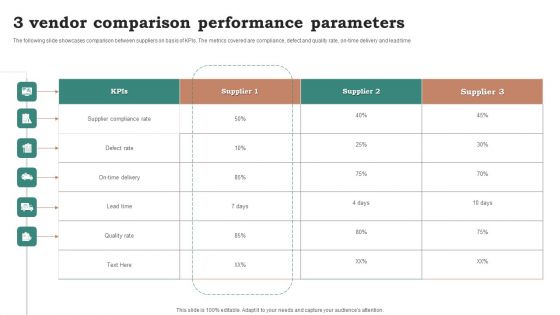
3 Vendor Comparison Performance Parameters Ppt Portfolio Topics PDF
The following slide showcases comparison between suppliers on basis of KPIs. The metrics covered are compliance, defect and quality rate, on-time delivery and lead time. Pitch your topic with ease and precision using this 3 Vendor Comparison Performance Parameters Ppt Portfolio Topics PDF. This layout presents information on Supplier Compliance Rate, Defect Rate, Lead Time. It is also available for immediate download and adjustment. So, changes can be made in the color, design, graphics or any other component to create a unique layout.

Logistics Shipment Company Profile Competitor Comparison By Services Diagrams PDF
The slide highlights the competitor comparison by services which includes general freight, air freight, sea freight, refrigerated freight, rail freight and special freight. Deliver an awe inspiring pitch with this creative Logistics Shipment Company Profile Competitor Comparison By Services Diagrams PDF bundle. Topics like Metrics, Total Delivery, National Transport can be discussed with this completely editable template. It is available for immediate download depending on the needs and requirements of the user.
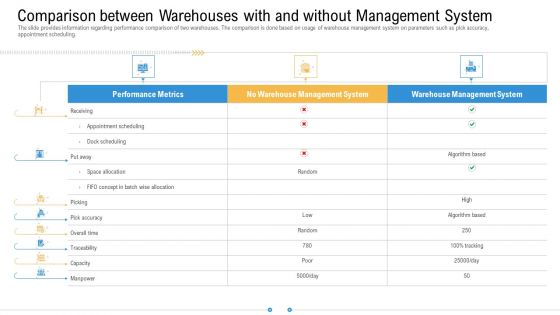
Comparison Between Warehouses With And Without Management System Structure PDF
The slide provides information regarding performance comparison of two warehouses. The comparison is done based on usage of warehouse management system on parameters such as pick accuracy, appointment scheduling. Deliver an awe inspiring pitch with this creative comparison between warehouses with and without management system structure pdf bundle. Topics like warehouse management system, performance metrics can be discussed with this completely editable template. It is available for immediate download depending on the needs and requirements of the user.

Ecommerce Marketing Tools Comparison Matrix Comprehensive Guide For Marketing Technology
Following slide provides information about ecommerce marketing software solution. It includes key metrics such as pricing, best for business, rating, ecommerce platform, marketing automation, email marketing, and drip campaigns.Presenting this PowerPoint presentation, titled Ecommerce Marketing Tools Comparison Matrix Comprehensive Guide For Marketing Technology, with topics curated by our researchers after extensive research. This editable presentation is available for immediate download and provides attractive features when used. Download now and captivate your audience. Presenting this Ecommerce Marketing Tools Comparison Matrix Comprehensive Guide For Marketing Technology. Our researchers have carefully researched and created these slides with all aspects taken into consideration. This is a completely customizable Ecommerce Marketing Tools Comparison Matrix Comprehensive Guide For Marketing Technology that is available for immediate downloading. Download now and make an impact on your audience. Highlight the attractive features available with our PPTs.
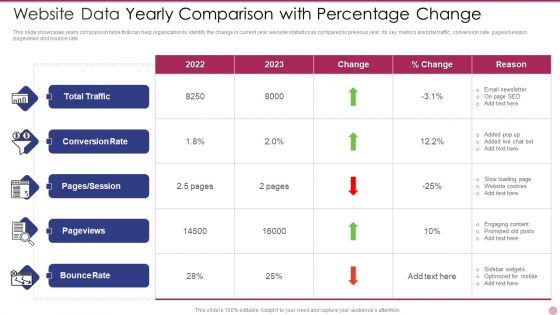
Website Data Yearly Comparison With Percentage Change Formats PDF
This slide showcases yearly comparison table that can help organization to identify the change in current year website statistics as compared to previous year. Its key metrics are total traffic, conversion rate, pages or session, pageviews and bounce rate. Pitch your topic with ease and precision using this Website Data Yearly Comparison With Percentage Change Formats PDF. This layout presents information on Website Data Yearly Comparison With Percentage Change. It is also available for immediate download and adjustment. So, changes can be made in the color, design, graphics or any other component to create a unique layout.
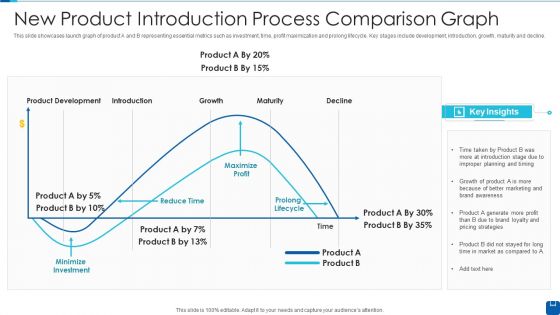
New Product Introduction Process Comparison Graph Slides PDF
This slide showcases launch graph of product A and B representing essential metrics such as investment, time, profit maximization and prolong lifecycle. Key stages include development, introduction, growth, maturity and decline.Showcasing this set of slides titled New Product Introduction Process Comparison Graph Slides PDF The topics addressed in these templates are Product Development, Improper Planning, Minimize Investment All the content presented in this PPT design is completely editable. Download it and make adjustments in color, background, font etc. as per your unique business setting.
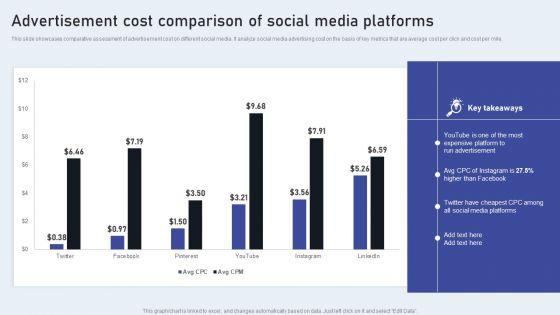
Advertisement Cost Comparison Of Social Media Platforms Graphics PDF
This slide showcases comparative assessment of advertisement cost on different social media. It analyze social media advertising cost on the basis of key metrics that are average cost per click and cost per mile. Make sure to capture your audiences attention in your business displays with our gratis customizable Advertisement Cost Comparison Of Social Media Platforms Graphics PDF. These are great for business strategies, office conferences, capital raising or task suggestions. If you desire to acquire more customers for your tech business and ensure they stay satisfied, create your own sales presentation with these plain slides.
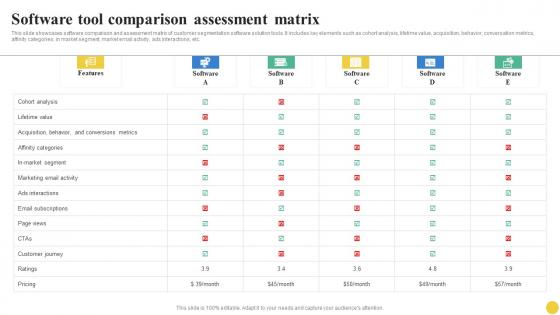
Software Tool Comparison Assessment Matrix User Segmentation Pictures Pdf
This slide showcases software comparison and assessment matrix of customer segmentation software solution tools. It includes key elements such as cohort analysis, lifetime value, acquisition, behavior, conversation metrics, affinity categories, in market segment, market email activity, ads interactions, etc. If your project calls for a presentation, then Slidegeeks is your go-to partner because we have professionally designed, easy-to-edit templates that are perfect for any presentation. After downloading, you can easily edit Software Tool Comparison Assessment Matrix User Segmentation Pictures Pdf and make the changes accordingly. You can rearrange slides or fill them with different images. Check out all the handy templates
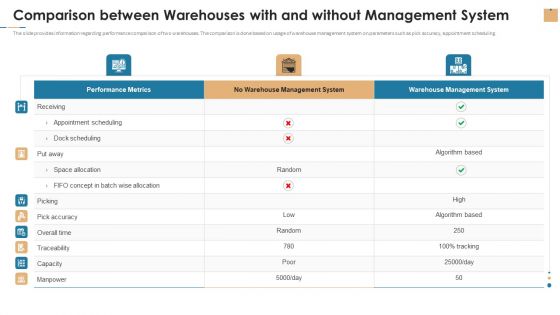
Comparison Between Warehouses With And Without Management System Rules PDF
The slide provides information regarding performance comparison of two warehouses. The comparison is done based on usage of warehouse management system on parameters such as pick accuracy, appointment scheduling. Deliver an awe inspiring pitch with this creative comparison between warehouses with and without management system rules pdf bundle. Topics like performance metrics, warehouse management system, capacity can be discussed with this completely editable template. It is available for immediate download depending on the needs and requirements of the user.
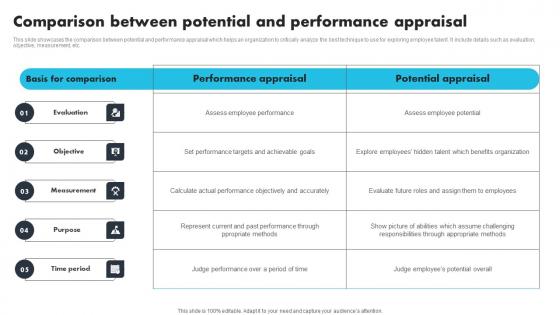
Comparison Between Potential And Performance Appraisal Structure Pdf
This slide showcases the comparison between potential and performance appraisal which helps an organization to critically analyze the best technique to use for exploring employee talent. It include details such as evaluation, objective, measurement, etc. Pitch your topic with ease and precision using this Comparison Between Potential And Performance Appraisal Structure Pdf. This layout presents information on Evaluation, Objective, Measurement. It is also available for immediate download and adjustment. So, changes can be made in the color, design, graphics or any other component to create a unique layout.
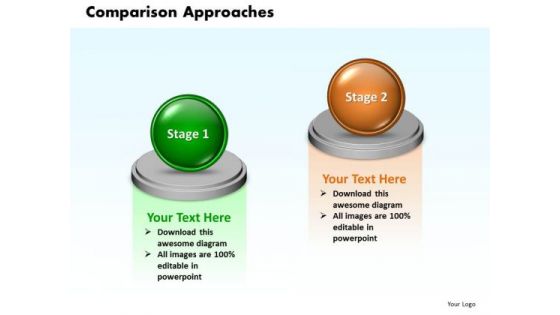
Ppt 3d Animated 2 Circular Approaches Comparison PowerPoint Templates
PPT 3d animated 2 circular approaches comparison PowerPoint Templates-This 3D animated Circular approaches diagram allows presenters to illustrate two approaches.-PPT 3d animated 2 circular approaches comparison PowerPoint Templates-3d, Abstract, Backgrounds, Ball, Business, Choice, Comparison, Concept, Descriptive, Equilibrium, Grow, Illustrations, Instrument, Measurement, Metallic, Part, Partnership, Pattern, Progress, Reflections, Scales, Several, Sphere, Strategy, Success
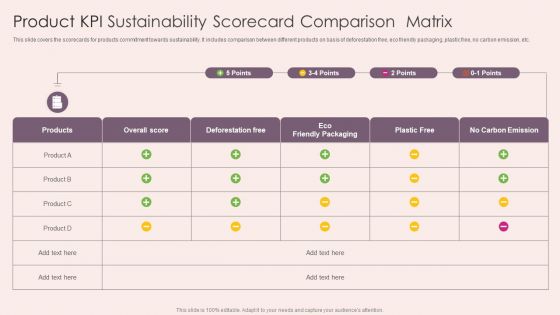
Product KPI Sustainability Scorecard Comparison Matrix Demonstration PDF
This slide covers the scorecards for products commitment towards sustainability. It includes comparison between different products on basis of deforestation free, eco friendly packaging, plastic free, no carbon emission, etc. Showcasing this set of slides titled Product KPI Sustainability Scorecard Comparison Matrix Demonstration PDF. The topics addressed in these templates are Product Kpi Sustainability, Scorecard Comparison Matrix. All the content presented in this PPT design is completely editable. Download it and make adjustments in color, background, font etc. as per your unique business setting.
Two Product KPI Attributes Comparison Scorecard Icon Formats PDF
Persuade your audience using this Two Product KPI Attributes Comparison Scorecard Icon Formats PDF. This PPT design covers four stages, thus making it a great tool to use. It also caters to a variety of topics including Product Kpi Attributes, Comparison Scorecard Icon. Download this PPT design now to present a convincing pitch that not only emphasizes the topic but also showcases your presentation skills.
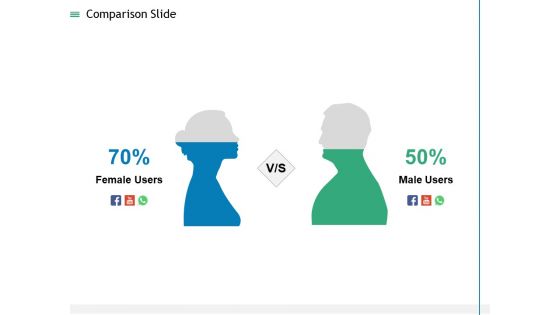
Measuring Influencer Marketing ROI Comparison Slide Ppt Professional Slides PDF
This is a measuring influencer marketing roi comparison slide ppt professional slides pdf template with various stages. Focus and dispense information on two stages using this creative set, that comes with editable features. It contains large content boxes to add your information on topic like comparison. You can also showcase facts, figures, and other relevant content using this PPT layout. Grab it now.

Preventive Measures Workplace Comparison Ppt Inspiration Clipart Images PDF
Presenting this set of slides with name preventive measures workplace comparison ppt inspiration clipart images pdf. The topics discussed in these slides are comparison. This is a completely editable PowerPoint presentation and is available for immediate download. Download now and impress your audience.
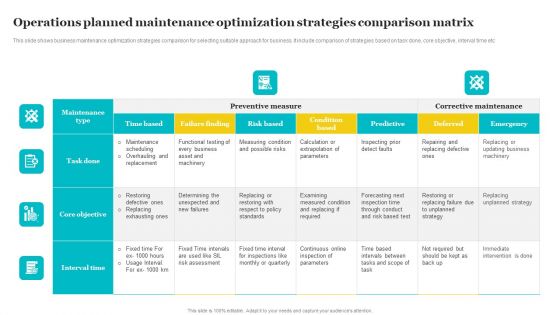
Operations Planned Maintenance Optimization Strategies Comparison Matrix Introduction PDF
This slide shows business maintenance optimization strategies comparison for selecting suitable approach for business. It include comparison of strategies based on task done, core objective, interval time etc. Showcasing this set of slides titled Operations Planned Maintenance Optimization Strategies Comparison Matrix Introduction PDF. The topics addressed in these templates are Preventive Measure, Corrective Maintenance, Interval Time. All the content presented in this PPT design is completely editable. Download it and make adjustments in color, background, font etc. as per your unique business setting.
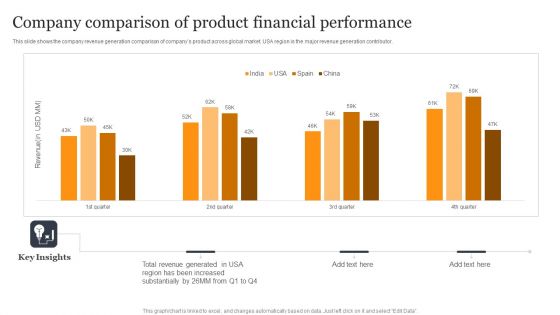
Company Comparison Of Product Financial Performance Summary PDF
This slide shows the company revenue generation comparison of companys product across global market. USA region is the major revenue generation contributor. Showcasing this set of slides titled Company Comparison Of Product Financial Performance Summary PDF. The topics addressed in these templates are Revenue Generated, Region Increased, Substantially. All the content presented in this PPT design is completely editable. Download it and make adjustments in color, background, font etc. as per your unique business setting.
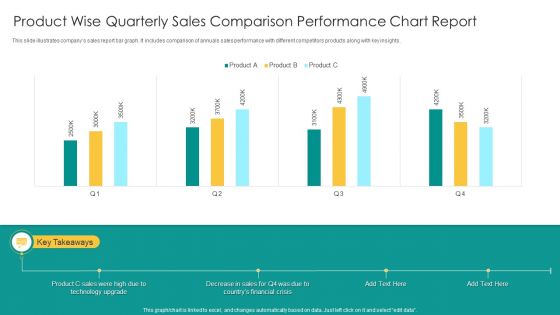
Product Wise Quarterly Sales Comparison Performance Chart Report Infographics PDF
This slide illustrates companys sales report bar graph. It includes comparison of annuals sales performance with different competitors products along with key insights. Showcasing this set of slides titled Product Wise Quarterly Sales Comparison Performance Chart Report Infographics PDF. The topics addressed in these templates are Product C Sales, Technology Upgrade, Financial Crisis. All the content presented in this PPT design is completely editable. Download it and make adjustments in color, background, font etc. as per your unique business setting.

Customer And Product Sales Performance Comparison Matrix Introduction PDF
This slide shows client and product sales Performance comparison matrix. It includes top products and Customer of the organization. Showcasing this set of slides titled Customer And Product Sales Performance Comparison Matrix Introduction PDF. The topics addressed in these templates are Top Products, Top Customers, Sales. All the content presented in this PPT design is completely editable. Download it and make adjustments in color, background, font etc. as per your unique business setting.
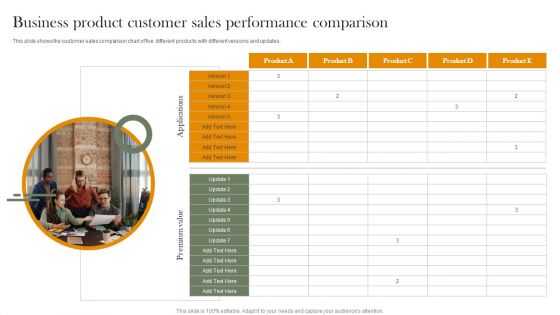
Business Product Customer Sales Performance Comparison Information PDF
This slide shows the customer sales comparison chart of five different products with different versions and updates. Presenting Business Product Customer Sales Performance Comparison Information PDF to dispense important information. This template comprises one stages. It also presents valuable insights into the topics including Premium Value, Applications, Product. This is a completely customizable PowerPoint theme that can be put to use immediately. So, download it and address the topic impactfully.
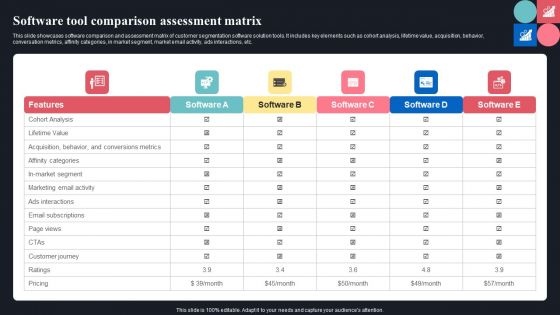
Software Tool Comparison Assessment Matrix Ppt Pictures Outline PDF
This slide showcases software comparison and assessment matrix of customer segmentation software solution tools. It includes key elements such as cohort analysis, lifetime value, acquisition, behavior, conversation metrics, affinity categories, in market segment, market email activity, ads interactions, etc. Present like a pro with Software Tool Comparison Assessment Matrix Ppt Pictures Outline PDF Create beautiful presentations together with your team, using our easy to use presentation slides. Share your ideas in real time and make changes on the fly by downloading our templates. So whether you are in the office, on the go, or in a remote location, you can stay in sync with your team and present your ideas with confidence. With Slidegeeks presentation got a whole lot easier. Grab these presentations today.

Project Management Life Cycle Performance Comparison Mockup PDF
This slide depicts comparison of different projects performance and overall progress of project towards milestone set for completion. It include the pointer such as project integrator overview, product overview and average profit of project. Pitch your topic with ease and precision using this Project Management Life Cycle Performance Comparison Mockup PDF. This layout presents information on Project Integrator Overview, Overview Of Product, Cycle Performance Comparison. It is also available for immediate download and adjustment. So, changes can be made in the color, design, graphics or any other component to create a unique layout.

Companys Performance Comparison Before And After Strategy Implementation Professional PDF
This slide shows the comparison of companys performance before and after the product marketing strategy implementation. It shows the comparison based on parameters such as number of product sold, total sale, lead conversion rate, customer retention rate, per customer acquisition cost etc. If you are looking for a format to display your unique thoughts, then the professionally designed Companys Performance Comparison Before And After Strategy Implementation Professional PDF is the one for you. You can use it as a Google Slides template or a PowerPoint template. Incorporate impressive visuals, symbols, images, and other charts. Modify or reorganize the text boxes as you desire. Experiment with shade schemes and font pairings. Alter, share or cooperate with other people on your work. Download Companys Performance Comparison Before And After Strategy Implementation Professional PDF and find out how to give a successful presentation. Present a perfect display to your team and make your presentation unforgettable.

Companys Performance Comparison Before And After Strategy Implementation Slides PDF
This slide shows the comparison of companys performance before and after the product marketing strategy implementation. It shows the comparison based on parameters such as number of product sold, total sale, lead conversion rate, customer retention rate, per customer acquisition cost etc.Create an editable Companys Performance Comparison Before And After Strategy Implementation Slides PDF that communicates your idea and engages your audience. Whether you are presenting a business or an educational presentation, pre-designed presentation templates help save time. Companys Performance Comparison Before And After Strategy Implementation Slides PDF is highly customizable and very easy to edit, covering many different styles from creative to business presentations. Slidegeeks has creative team members who have crafted amazing templates. So, go and get them without any delay.
Sales Performance Comparison Graph Of Top Customer Icons PDF
This slide shows the customer sales comparison graph along with the units of product purchased by the clients. Showcasing this set of slides titled Sales Performance Comparison Graph Of Top Customer Icons PDF. The topics addressed in these templates are Highest Units, Customer, Product. All the content presented in this PPT design is completely editable. Download it and make adjustments in color, background, font etc. as per your unique business setting.
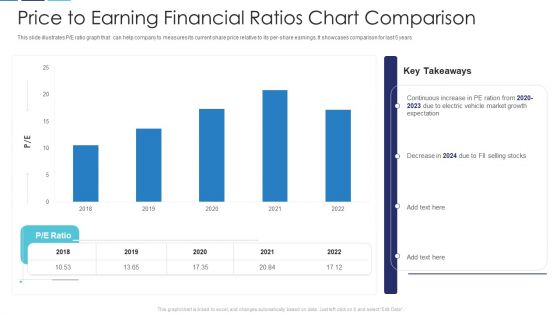
Price To Earning Financial Ratios Chart Comparison Slides PDF
This slide illustrates P or E ratio graph that can help company to measures its current share price relative to its per-share earnings. It showcases comparison for last 5 years Showcasing this set of slides titled price to earning financial ratios chart comparison slides pdf. The topics addressed in these templates are price to earning financial ratios chart comparison. All the content presented in this PPT design is completely editable. Download it and make adjustments in color, background, font etc. as per your unique business setting.

Ppt Comparison Diagram Of 4 Colorful State PowerPoint Templates
PPT comparison diagram of 4 colorful state PowerPoint Templates-This Detailed Flow Diagram displays the activities you may need to execute to achieve successful implementation and in-service management of your services program. You can show various processes with these linear designed Circular pieces. This image has been conceived to enable you to emphatically communicate your ideas in your Comparing 4 quantities PPT presentation.-PPT comparison diagram of 4 colorful state PowerPoint Templates-3d, Abstract, Backgrounds, Ball, Business, Choice, Comparison, Concept, Descriptive, Equilibrium, Grow, Illustrations, Instrument, Measurement, Metallic, Part, Partnership, Pattern, Progress, Reflections, Scales, Several, Sphere, Strategy, Success
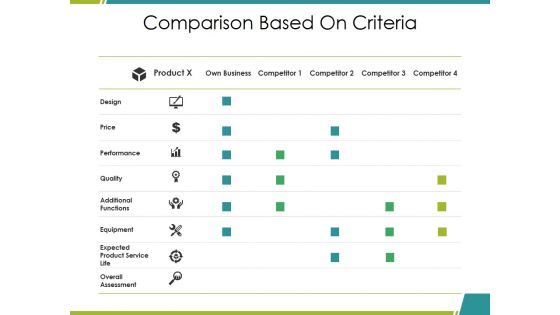
Comparison Based On Criteria Ppt PowerPoint Presentation Infographics Elements
This is a comparison based on criteria ppt powerpoint presentation infographics elements. This is a four stage process. The stages in this process are design, price, performance, product, competitor.
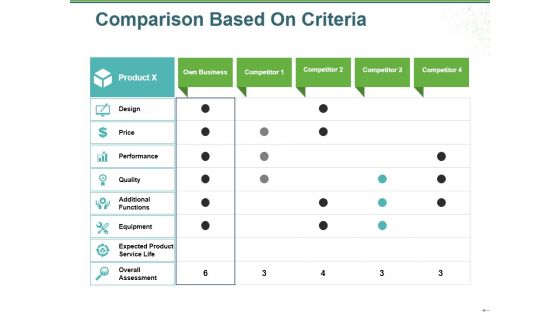
Comparison Based On Criteria Ppt PowerPoint Presentation Summary Good
This is a comparison based on criteria ppt powerpoint presentation summary good. This is a four stage process. The stages in this process are product, design, price, performance, quality.
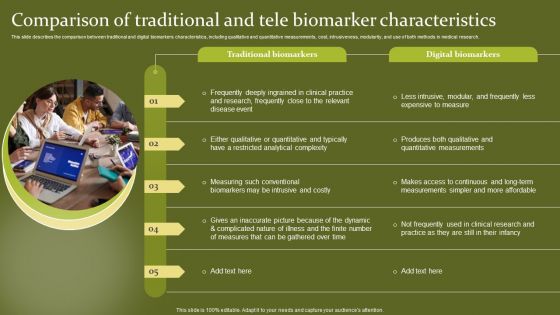
Telehealth Comparison Of Traditional And Tele Biomarker Characteristics Pictures PDF
This slide describes the comparison between traditional and digital biomarkers characteristics, including qualitative and quantitative measurements, cost, intrusiveness, modularity, and use of both methods in medical research. Presenting this PowerPoint presentation, titled Telehealth Comparison Of Traditional And Tele Biomarker Characteristics Pictures PDF, with topics curated by our researchers after extensive research. This editable presentation is available for immediate download and provides attractive features when used. Download now and captivate your audience. Presenting this Telehealth Comparison Of Traditional And Tele Biomarker Characteristics Pictures PDF. Our researchers have carefully researched and created these slides with all aspects taken into consideration. This is a completely customizable Telehealth Comparison Of Traditional And Tele Biomarker Characteristics Pictures PDF that is available for immediate downloading. Download now and make an impact on your audience. Highlight the attractive features available with our PPTs.
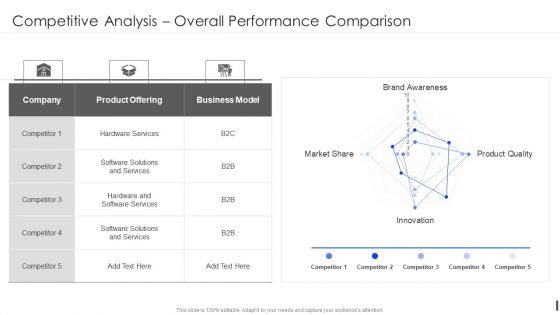
Product Marketing Playbook Competitive Analysis Overall Performance Comparison Background PDF
Deliver and pitch your topic in the best possible manner with this Product Marketing Playbook Competitive Analysis Overall Performance Comparison Background PDF Use them to share invaluable insights on Product Offering, Business Model, Software Solutions and impress your audience. This template can be altered and modified as per your expectations. So, grab it now.
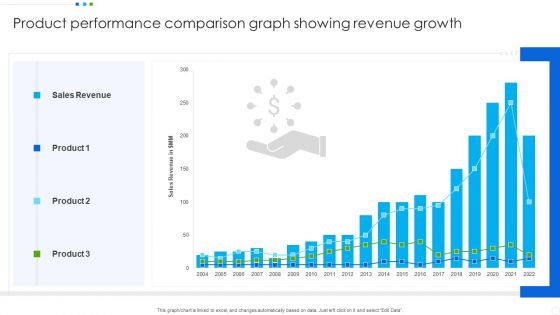
Product Performance Comparison Graph Showing Revenue Growth Portrait PDF
Showcasing this set of slides titled Product Performance Comparison Graph Showing Revenue Growth Portrait PDF. The topics addressed in these templates are Sales Revenue, Product. All the content presented in this PPT design is completely editable. Download it and make adjustments in color, background, font etc. as per your unique business setting.

Marketing Performance Measurement Comparison Ppt Pictures Slides PDF
Presenting this set of slides with name marketing performance measurement comparison ppt pictures slides pdf. The topics discussed in these slides are you tube, whatsapp, face book. This is a completely editable PowerPoint presentation and is available for immediate download. Download now and impress your audience.

Commodity Unique Selling Proposition Product Feature Comparison Mockup PDF
Compare and Contrast your product from the competitors product in this slide. Deliver and pitch your topic in the best possible manner with this commodity unique selling proposition product feature comparison mockup pdf. Use them to share invaluable insights on processor, product, performance and impress your audience. This template can be altered and modified as per your expectations. So, grab it now.
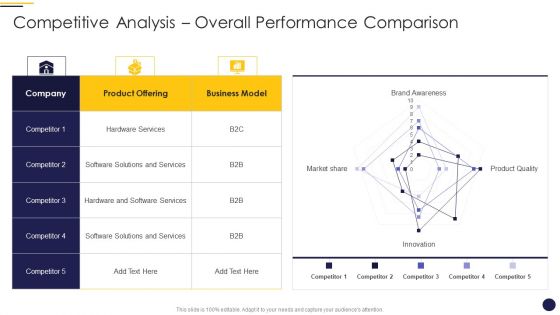
Internet Marketing Playbook Competitive Analysis Overall Performance Comparison Themes PDF
Deliver an awe inspiring pitch with this creative Internet Marketing Playbook Competitive Analysis Overall Performance Comparison Themes PDF bundle. Topics like Product Offering Business, Model Hardware Services, Software Solutions Services can be discussed with this completely editable template. It is available for immediate download depending on the needs and requirements of the user.
Workforce Performance Comparison Report With Feedback Ppt Icon Objects PDF
Pitch your topic with ease and precision using this workforce performance comparison report with feedback ppt icon objects pdf. This layout presents information on finance, sales, research, production. It is also available for immediate download and adjustment. So, changes can be made in the color, design, graphics or any other component to create a unique layout.
IOT Industry Assessment Touchpoint Performance Comparison Ppt Icon Maker PDF
Following slide shows the performance of companys touchpoint compared to its competitor. Performance measurement is based on the feelings about touchpoint vs impact on likelihood of purchase. Presenting iot industry assessment touchpoint performance comparison ppt icon maker pdf to provide visual cues and insights. Share and navigate important information on two stages that need your due attention. This template can be used to pitch topics like touchpoint performance comparison. In addtion, this PPT design contains high resolution images, graphics, etc, that are easily editable and available for immediate download.
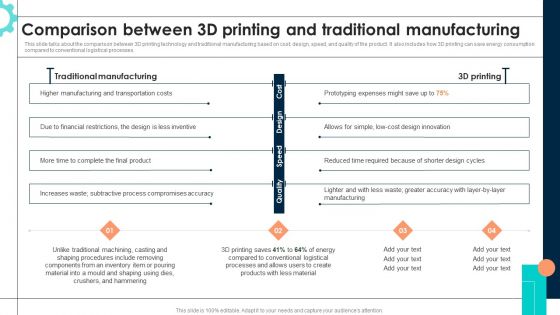
Intelligent Manufacturing Comparison Between 3D Printing And Traditional Introduction PDF
This slide talks about the comparison between 3D printing technology and traditional manufacturing based on cost, design, speed, and quality of the product. It also includes how 3D printing can save energy consumption compared to conventional logistical processes. From laying roadmaps to briefing everything in detail, our templates are perfect for you. You can set the stage with your presentation slides. All you have to do is download these easy to edit and customizable templates. Intelligent Manufacturing Comparison Between 3D Printing And Traditional Introduction PDF will help you deliver an outstanding performance that everyone would remember and praise you for. Do download this presentation today.
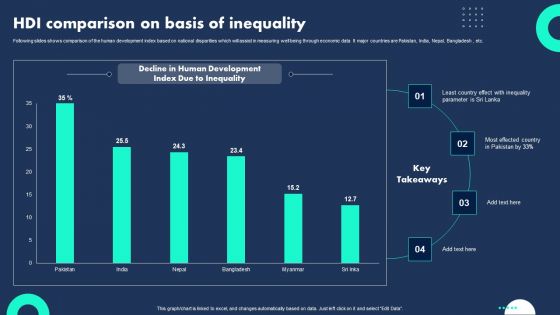
HDI Comparison On Basis Of Inequality Infographics PDF
Following slides shows comparison of the human development index based on national disparities which will assist in measuring well being through economic data It major countries are Pakistan, India, Nepal, Bangladesh , etc. Showcasing this set of slides titled HDI Comparison On Basis Of Inequality Infographics PDF. The topics addressed in these templates are Country Effect, Most Effected Country, Human Development. All the content presented in this PPT design is completely editable. Download it and make adjustments in color, background, font etc. as per your unique business setting.
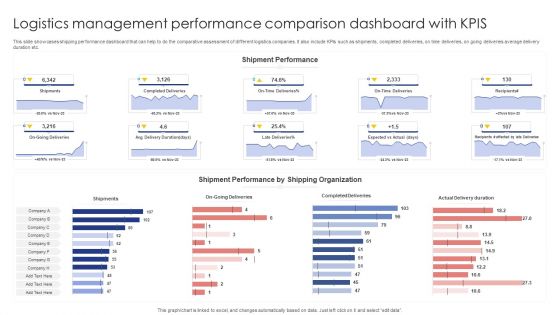
Logistics Management Performance Comparison Dashboard With Kpis Sample PDF
This slide showcases shipping performance dashboard that can help to do the comparative assessment of different logistics companies. It also include KPIs such as shipments, completed deliveries, on time deliveries, on going deliveries average delivery duration etc. Pitch your topic with ease and precision using this Logistics Management Performance Comparison Dashboard With Kpis Sample PDF. This layout presents information on Shipments, Completed Deliveries, Actual Delivery Duration. It is also available for immediate download and adjustment. So, changes can be made in the color, design, graphics or any other component to create a unique layout.

State Wise Customer Sales Performance Comparison Graph Introduction PDF
This slide shows the sales graph of 3 products of a company in various states. It includes five states which are New York, Texas, California, Washington and New Jersey. Showcasing this set of slides titled State Wise Customer Sales Performance Comparison Graph Introduction PDF. The topics addressed in these templates are Lowest Sales, Decrease Demand. All the content presented in this PPT design is completely editable. Download it and make adjustments in color, background, font etc. as per your unique business setting.

CRM Software Dashboard For Sales Comparison Mockup PDF
This slide represents the sales dashboard of CRM software. It includes KPIs such as profit, number of sales and expenses incurred. Pitch your topic with ease and precision using this CRM Software Dashboard For Sales Comparison Mockup PDF. This layout presents information on Profit, Sales Dashboard, Expenses Incurred. It is also available for immediate download and adjustment. So, changes can be made in the color, design, graphics or any other component to create a unique layout.

Program Six Months Comparison Roadmap With Team Review Summary
Presenting our innovatively structured program six months comparison roadmap with team review summary Template. Showcase your roadmap process in different formats like PDF, PNG, and JPG by clicking the download button below. This PPT design is available in both Standard Screen and Widescreen aspect ratios. It can also be easily personalized and presented with modified font size, font type, color, and shapes to measure your progress in a clear way.
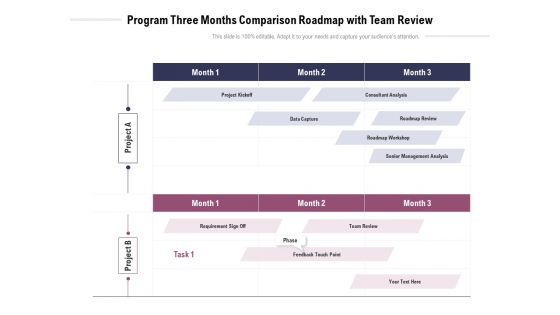
Program Three Months Comparison Roadmap With Team Review Download
Introducing our program three months comparison roadmap with team review download. This PPT presentation is Google Slides compatible, therefore, you can share it easily with the collaborators for measuring the progress. Also, the presentation is available in both standard screen and widescreen aspect ratios. So edit the template design by modifying the font size, font type, color, and shapes as per your requirements. As this PPT design is fully editable it can be presented in PDF, JPG and PNG formats.

Quarterly IT Products Comparison Roadmap Based On Compatibility Mode Download
Presenting our innovatively structured quarterly it products comparison roadmap based on compatibility mode download Template. Showcase your roadmap process in different formats like PDF, PNG, and JPG by clicking the download button below. This PPT design is available in both Standard Screen and Widescreen aspect ratios. It can also be easily personalized and presented with modified font size, font type, color, and shapes to measure your progress in a clear way.

Arrows Stages Comparison Process Flow PowerPoint Templates Backgrounds For Slides
We present our arrows stages comparison process flow PowerPoint templates backgrounds for slides.Use our Flow Charts PowerPoint Templates because You can Inspire your team with our PowerPoint Templates and Slides. Let the force of your ideas flow into their minds. Download our Process and Flows PowerPoint Templates because You are working at that stage with an air of royalty. Let our PowerPoint Templates and Slides be the jewels in your crown. Use our Marketing PowerPoint Templates because You can Zap them with our PowerPoint Templates and Slides. See them reel under the impact. Use our Business PowerPoint Templates because You can Be the puppeteer with our PowerPoint Templates and Slides as your strings. Lead your team through the steps of your script. Present our Shapes PowerPoint Templates because Our PowerPoint Templates and Slides will Activate the energies of your audience. Get their creative juices flowing with your words.Use these PowerPoint slides for presentations relating to Accounting, arrow, bar, blue, business, chart, collection, company, diagram, directive, finance, forecast, future, growth, icon, illustration, market, measure, profit, progress, statistic, stock, success. The prominent colors used in the PowerPoint template are Blue, Gray, White. People tell us our arrows stages comparison process flow PowerPoint templates backgrounds for slides will make you look like a winner. Presenters tell us our company PowerPoint templates and PPT Slides have awesome images to get your point across. Customers tell us our arrows stages comparison process flow PowerPoint templates backgrounds for slides will help them to explain complicated concepts. Customers tell us our bar PowerPoint templates and PPT Slides will save the presenter time. Professionals tell us our arrows stages comparison process flow PowerPoint templates backgrounds for slides will make the presenter look like a pro even if they are not computer savvy. Use our company PowerPoint templates and PPT Slides will save the presenter time.
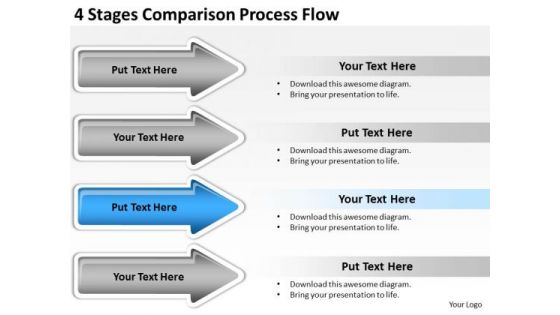
Arrows PowerPoint 4 Stages Comparison Process Flow Slides
We present our arrows powerpoint 4 stages comparison process flow Slides.Use our Business PowerPoint Templates because Our PowerPoint Templates and Slides are created with admirable insight. Use them and give your group a sense of your logical mind. Present our Process and Flows PowerPoint Templates because Our PowerPoint Templates and Slides are created by a hardworking bunch of busybees. Always flitting around with solutions gauranteed to please. Download our Shapes PowerPoint Templates because They will bring a lot to the table. Their alluring flavours will make your audience salivate. Download our Steps PowerPoint Templates because You have a driving passion to excel in your field. Our PowerPoint Templates and Slides will prove ideal vehicles for your ideas. Present our Flow Charts PowerPoint Templates because Our PowerPoint Templates and Slides are effectively colour coded to prioritise your plans They automatically highlight the sequence of events you desire.Use these PowerPoint slides for presentations relating to Accounting, arrow, bar, blue, business, chart, collection, company, diagram, directive, finance, forecast, future, growth, icon, illustration, market, measure, profit, progress, statistic, stock, success. The prominent colors used in the PowerPoint template are Blue, Gray, White. People tell us our arrows powerpoint 4 stages comparison process flow Slides are designed to make your presentations professional. Presenters tell us our company PowerPoint templates and PPT Slides are effectively colour coded to prioritise your plans They automatically highlight the sequence of events you desire. Customers tell us our arrows powerpoint 4 stages comparison process flow Slides are visually appealing. Customers tell us our blue PowerPoint templates and PPT Slides will get their audience's attention. Professionals tell us our arrows powerpoint 4 stages comparison process flow Slides effectively help you save your valuable time. Use our chart PowerPoint templates and PPT Slides are aesthetically designed to attract attention. We guarantee that they will grab all the eyeballs you need.
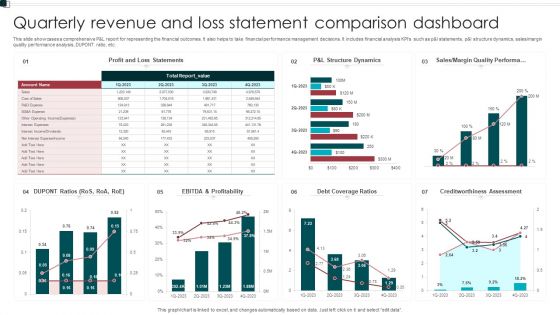
Quarterly Revenue And Loss Statement Comparison Dashboard Portrait PDF
This slide showcases a comprehensive P and L report for representing the financial outcomes. It also helps to take financial performance management decisions. It includes financial analysis KPIs such as p and l statements, p and l structure dynamics, sales or margin quality performance analysis, DUPONT ratio, etc. Showcasing this set of slides titled Quarterly Revenue And Loss Statement Comparison Dashboard Portrait PDF. The topics addressed in these templates are Profitability, Debt Coverage Ratios, Margin Quality Performa. All the content presented in this PPT design is completely editable. Download it and make adjustments in color, background, font etc. as per your unique business setting.

Merchant Performance Comparison With Business Parameters Ideas PDF
The purpose of this slide is to illustrate the performance of two different vendors on certain parameters in order to measure the reliability of vendors. The attributes include points, weighting, and total of vendor A and B. Presenting Merchant Performance Comparison With Business Parameters Ideas PDF to dispense important information. This template comprises one stages. It also presents valuable insights into the topics including Price, Functional Requirement, Business Parameters. This is a completely customizable PowerPoint theme that can be put to use immediately. So, download it and address the topic impactfully.
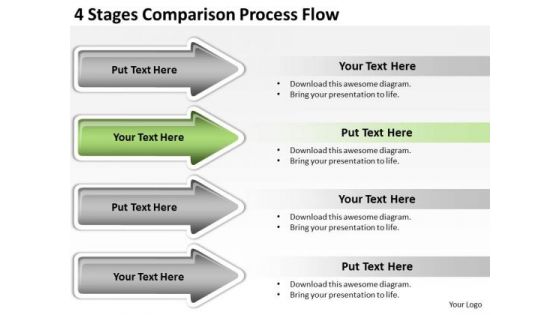
Advantages Of Parallel Processing 4 Stages Comparison Flow PowerPoint Templates
We present our advantages of parallel processing 4 stages comparison flow PowerPoint templates.Download and present our Arrows PowerPoint Templates because you can Add colour to your speech with our PowerPoint Templates and Slides. Your presentation will leave your audience speechless. Use our Business PowerPoint Templates because Our PowerPoint Templates and Slides will Embellish your thoughts. They will help you illustrate the brilliance of your ideas. Use our Steps PowerPoint Templates because Our PowerPoint Templates and Slides will help you be quick off the draw. Just enter your specific text and see your points hit home. Present our Process and Flows PowerPoint Templates because It will Strengthen your hand with your thoughts. They have all the aces you need to win the day. Download our Flow Charts PowerPoint Templates because Our PowerPoint Templates and Slides help you meet the demand of the Market. Just browse and pick the slides that appeal to your intuitive senses.Use these PowerPoint slides for presentations relating to Accounting, arrow, art, bar, blue, business, calculation, chart, collection,company, elements, diagram, directive, expense, finance, firm, forecast,future, gain, graph, grow, growth, icon, illustration, income, line, market, measure,objects, office, profit, progress, rate, set, statistic, stock, success, two, up, . The prominent colors used in the PowerPoint template are Green lime , White, Gray. The feedback we get is that our advantages of parallel processing 4 stages comparison flow PowerPoint templates are readymade to fit into any presentation structure. Professionals tell us our blue PowerPoint templates and PPT Slides will make you look like a winner. Use our advantages of parallel processing 4 stages comparison flow PowerPoint templates are the best it can get when it comes to presenting. Presenters tell us our bar PowerPoint templates and PPT Slides will impress their bosses and teams. You can be sure our advantages of parallel processing 4 stages comparison flow PowerPoint templates are effectively colour coded to prioritise your plans They automatically highlight the sequence of events you desire. PowerPoint presentation experts tell us our chart PowerPoint templates and PPT Slides will impress their bosses and teams.
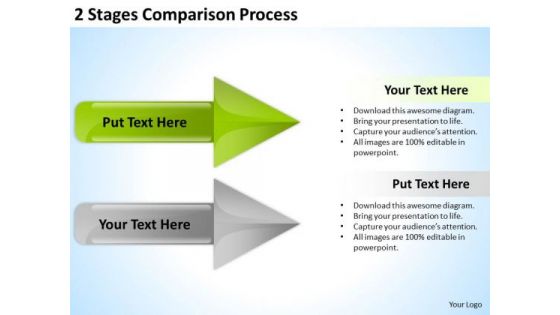
PowerPoint Arrow Shapes Comparison Process Ppt Templates Backgrounds For Slides
3d, accounting, arrow, art, bar, blue, business, calculation, chart, collection, company, design elements, diagram, directive, expense, finance, firm, forecast, future, gain, graph, grow, growth, icon, illustration, income, line, market, measure, objects, office, profit, progress, rate, set, statistic, stock, success, two, up, vector, yellow

Metrics Depicting Business Operations Metrics Diagrams PDF
Pitch your topic with ease and precision using this Metrics Depicting Business Operations Metrics Diagrams PDF. This layout presents information on Metrics Depicting, Business, Operations Metrics. It is also available for immediate download and adjustment. So, changes can be made in the color, design, graphics or any other component to create a unique layout.
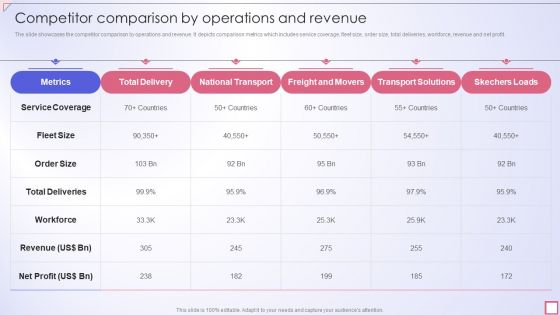
Freight Shipping Company Profile Competitor Comparison By Operations And Revenue Template PDF
The slide showcases the competitor comparison by operations and revenue. It depicts comparison metrics which includes service coverage, fleet size, order size, total deliveries, workforce, revenue and net profit.Deliver an awe inspiring pitch with this creative Freight Shipping Company Profile Competitor Comparison By Operations And Revenue Template PDF bundle. Topics like Service Coverage, Total Deliveries, National Transport can be discussed with this completely editable template. It is available for immediate download depending on the needs and requirements of the user.
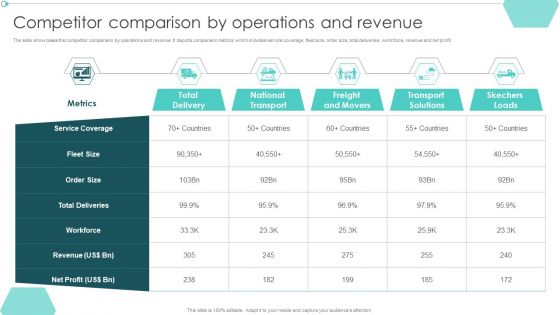
Transportation Company Profile Competitor Comparison By Operations And Revenue Ppt PowerPoint Presentation Model Inspiration PDF
The slide showcases the competitor comparison by operations and revenue. It depicts comparison metrics which includes service coverage, fleet size, order size, total deliveries, workforce, revenue and net profit.Deliver an awe inspiring pitch with this creative Transportation Company Profile Competitor Comparison By Operations And Revenue Ppt PowerPoint Presentation Model Inspiration PDF bundle. Topics like National Transport, Freight Movers, Transport Solutions can be discussed with this completely editable template. It is available for immediate download depending on the needs and requirements of the user.
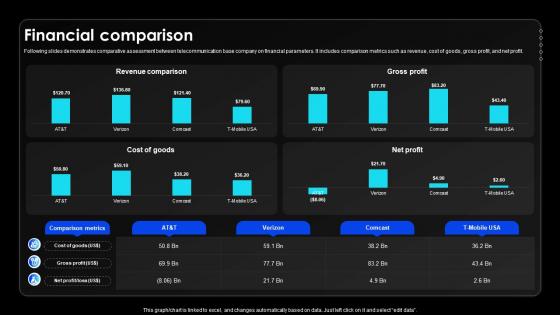
Financial Comparison Wireless Communication Services Provider Company Profile CP SS V
Following slides demonstrates comparative assessment between telecommunication base company on financial parameters. It includes comparison metrics such as revenue, cost of goods, gross profit, and net profit.If your project calls for a presentation, then Slidegeeks is your go-to partner because we have professionally designed, easy-to-edit templates that are perfect for any presentation. After downloading, you can easily edit Financial Comparison Wireless Communication Services Provider Company Profile CP SS V and make the changes accordingly. You can rearrange slides or fill them with different images. Check out all the handy templates

Transportation And Logistics Services Company Profile Competitor Comparison By Operations Inspiration PDF
The slide showcases the competitor comparison by operations and revenue. It depicts comparison metrics which includes service coverage, fleet size, order size, total deliveries, workforce, revenue and net profit. Deliver and pitch your topic in the best possible manner with this Transportation And Logistics Services Company Profile Competitor Comparison By Operations Inspiration PDF. Use them to share invaluable insights on Service Coverage, Fleet Size, Workforce, Order Size, Revenue and impress your audience. This template can be altered and modified as per your expectations. So, grab it now.
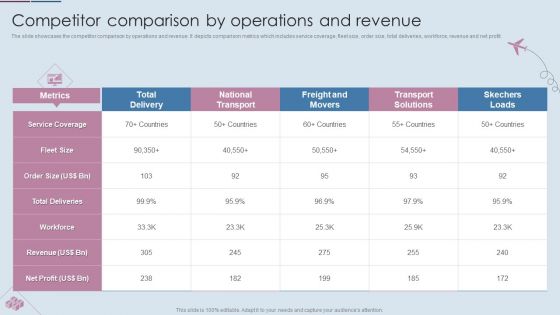
Logistics Shipment Company Profile Competitor Comparison By Operations And Revenue Brochure PDF
The slide showcases the competitor comparison by operations and revenue. It depicts comparison metrics which includes service coverage, fleet size, order size, total deliveries, workforce, revenue and net profit. Deliver and pitch your topic in the best possible manner with this Logistics Shipment Company Profile Competitor Comparison By Operations And Revenue Brochure PDF. Use them to share invaluable insights on Service Coverage, Order Size, Total Deliveries and impress your audience. This template can be altered and modified as per your expectations. So, grab it now.
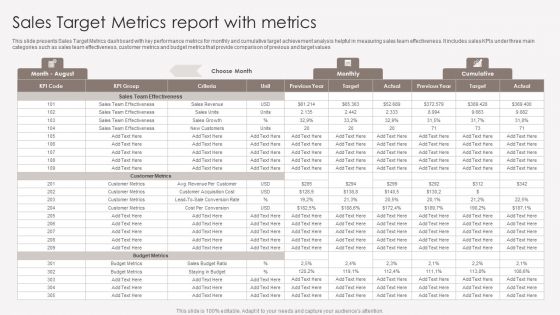
Sales Target Metrics Report With Metrics Introduction PDF
This slide presents Sales Target Metrics dashboard with key performance metrics for monthly and cumulative target achievement analysis helpful in measuring sales team effectiveness. It includes sales KPIs under three main categories such as sales team effectiveness, customer metrics and budget metrics that provide comparison of previous and target values. Pitch your topic with ease and precision using this Sales Target Metrics Report With Metrics Introduction PDF. This layout presents information on Sales Team Effectiveness, Customer Metrics, Budget Metrics. It is also available for immediate download and adjustment. So, changes can be made in the color, design, graphics or any other component to create a unique layout.

Customer Service Metric Benchmarks With Ratings Ppt PowerPoint Presentation Visuals PDF
Pitch your topic with ease and precision using this customer service metric benchmarks with ratings ppt powerpoint presentation visuals pdf. This layout presents information on customer service metric benchmarks with ratings. It is also available for immediate download and adjustment. So, changes can be made in the color, design, graphics or any other component to create a unique layout.
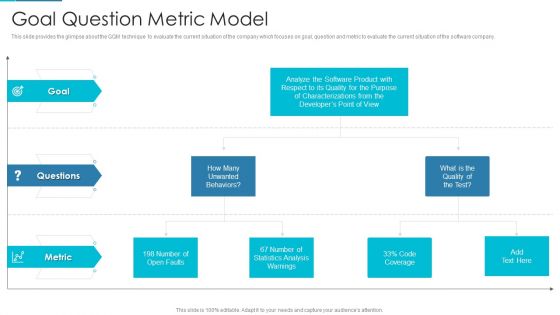
Project Management Outline For Schedule Performance Index Goal Question Metric Model Topics PDF
This slide provides the glimpse about the GQM technique to evaluate the current situation of the company which focuses on goal, question and metric to evaluate the current situation of the software company. Deliver an awe inspiring pitch with this creative project management outline for schedule performance index goal question metric model topics pdf bundle. Topics like goal, metric, developers, analysis can be discussed with this completely editable template. It is available for immediate download depending on the needs and requirements of the user.
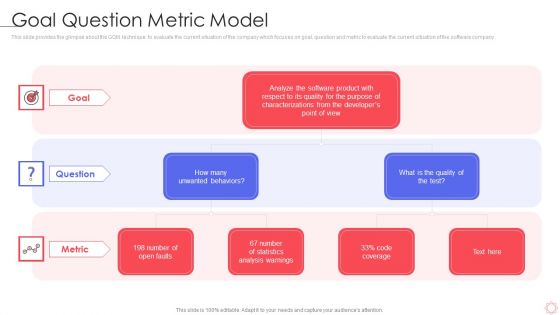
SPI Methodology Goal Question Metric Model Ppt PowerPoint Presentation Gallery Visual Aids PDF
This slide provides the glimpse about the GQM technique to evaluate the current situation of the company which focuses on goal, question and metric to evaluate the current situation of the software company. This is a spi methodology goal question metric model ppt powerpoint presentation gallery visual aids pdf template with various stages. Focus and dispense information on two stages using this creative set, that comes with editable features. It contains large content boxes to add your information on topics like goal, question, metric. You can also showcase facts, figures, and other relevant content using this PPT layout. Grab it now.
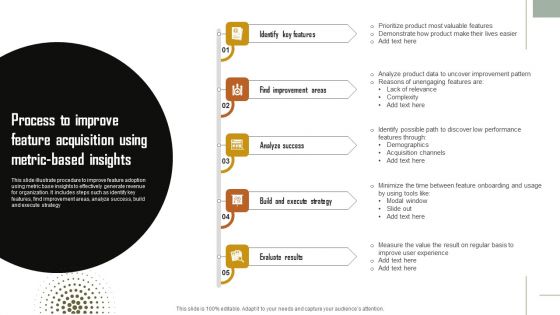
Process To Improve Feature Acquisition Using Metric Based Insights Topics PDF
This slide illustrate procedure to improve feature adoption using metric base insights to effectively generate revenue for organization. It includes steps such as identify key features, find improvement areas, analyze success, build and execute strategy. Persuade your audience using this Process To Improve Feature Acquisition Using Metric Based Insights Topics PDF. This PPT design covers five stages, thus making it a great tool to use. It also caters to a variety of topics including Analyze Success, Build And Execute Strategy, Evaluate Results. Download this PPT design now to present a convincing pitch that not only emphasizes the topic but also showcases your presentation skills.
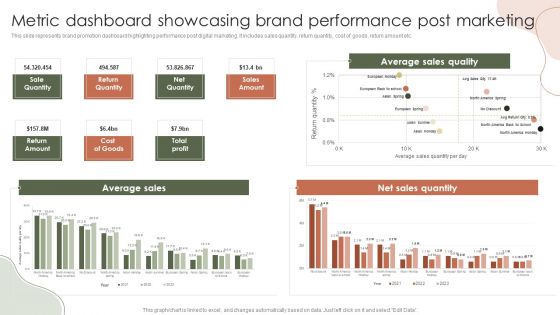
Digital Marketing Approach For Brand Awareness Metric Dashboard Showcasing Brand Performance Post Marketing Mockup PDF
Presenting this PowerPoint presentation, titled Digital Marketing Approach For Brand Awareness Metric Dashboard Showcasing Brand Performance Post Marketing Mockup This slide represents brand promotion dashboard highlighting performance post digital marketing. It includes sales quantity, return quantity, cost of goods, return amount etc. PDF, with topics curated by our researchers after extensive research. This editable presentation is available for immediate download and provides attractive features when used. Download now and captivate your audience. Presenting this Digital Marketing Approach For Brand Awareness Metric Dashboard Showcasing Brand Performance Post Marketing Mockup PDF. Our researchers have carefully researched and created these slides with all aspects taken into consideration. This is a completely customizable Digital Marketing Approach For Brand Awareness Metric Dashboard Showcasing Brand Performance Post Marketing Mockup PDF that is available for immediate downloading. Download now and make an impact on your audience. Highlight the attractive features available with our PPTs.

Metric Dashboard Showcasing Measurement Of Gender Diversity Pay Gap Sample PDF
This slide represents KPI dashboard showcasing metrics to measure gender pay gap. It provides information regarding salary pay gap, bonus pay gap, women promoted, recruited, and total women in each department. Pitch your topic with ease and precision using this Metric Dashboard Showcasing Measurement Of Gender Diversity Pay Gap Sample PDF. This layout presents information on Marketing, Screened, Delivery. It is also available for immediate download and adjustment. So, changes can be made in the color, design, graphics or any other component to create a unique layout.

Customer Data Quality Kpis And Record Uniqueness Metric Scorecard Background PDF
Pitch your topic with ease and precision using this Customer Data Quality Kpis And Record Uniqueness Metric Scorecard Background PDF. This layout presents information on Average Spurious, Records Per Duplicate. It is also available for immediate download and adjustment. So, changes can be made in the color, design, graphics or any other component to create a unique layout.

Customer Service Metric With Satisfaction Levels Ppt PowerPoint Presentation Styles Graphic Images PDF
Pitch your topic with ease and precision using this customer service metric with satisfaction levels ppt powerpoint presentation styles graphic images pdf. This layout presents information on product, knowledge, service. It is also available for immediate download and adjustment. So, changes can be made in the color, design, graphics or any other component to create a unique layout.

Customer NPS Metric With Revenue Growth Impact Ppt Show Portrait PDF
This slide illustrates net promoter score with revenue growth impact. It provides information about market average NPS, respondents, promoter, detractor, passive, etc. Pitch your topic with ease and precision using this Customer NPS Metric With Revenue Growth Impact Ppt Show Portrait PDF. This layout presents information on Promoter, Detractor, Passive. It is also available for immediate download and adjustment. So, changes can be made in the color, design, graphics or any other component to create a unique layout.

Diversity And Inclusion Strategy With Metric To Improve Business Performance Information PDF
This slide showcases diversity and inclusion strategy with KPIs which help businesses understand causality, find success factors and study potential outcomes. It provides information regarding diversity, recruitment , innovation and expectations of internal and external customers. Pitch your topic with ease and precision using this Diversity And Inclusion Strategy With Metric To Improve Business Performance Information PDF. This layout presents information on Stakeholders, Customer, Business Processes. It is also available for immediate download and adjustment. So, changes can be made in the color, design, graphics or any other component to create a unique layout.

Customer NPS Metric Dashboard For Call Centers Ppt Inspiration Smartart PDF
This slide shows net promoter score dashboard for call centers which contains occupancy rate, tickets unassigned, opened tickets, completed tickets and raised tickets. It also has details on resolution rate on first call, enquiries, etc. Pitch your topic with ease and precision using this Customer NPS Metric Dashboard For Call Centers Ppt Inspiration Smartart PDF. This layout presents information on Occupancy Rate, Resolution Rate, Net Promoter Score. It is also available for immediate download and adjustment. So, changes can be made in the color, design, graphics or any other component to create a unique layout.
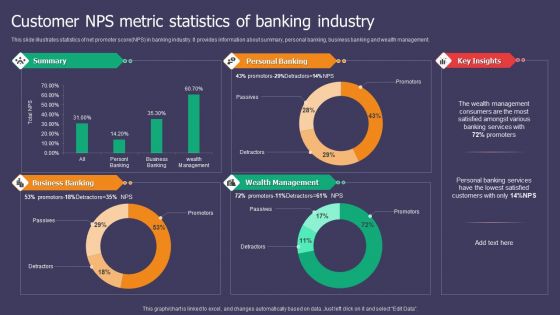
Customer NPS Metric Statistics Of Banking Industry Ppt Styles Microsoft PDF
This slide illustrates statistics of net promoter score NPS in banking industry. It provides information about summary, personal banking, business banking and wealth management. Pitch your topic with ease and precision using this Customer NPS Metric Statistics Of Banking Industry Ppt Styles Microsoft PDF. This layout presents information on Summary, Personal Banking, Business Banking, Wealth Management. It is also available for immediate download and adjustment. So, changes can be made in the color, design, graphics or any other component to create a unique layout.

Ecommerce Customer Survey With Customer NPS Metric Rating Scale Ppt Inspiration Visual Aids PDF
This slide shows net promoter score rating scale with ecommerce customer survey. It includes information about price fairness, customer support experience, order checkout, product quality, passives, promoters, detractors, etc. Pitch your topic with ease and precision using this Ecommerce Customer Survey With Customer NPS Metric Rating Scale Ppt Inspiration Visual Aids PDF. This layout presents information on Net Promoter Score, Price Fairness, Product Purchased. It is also available for immediate download and adjustment. So, changes can be made in the color, design, graphics or any other component to create a unique layout.
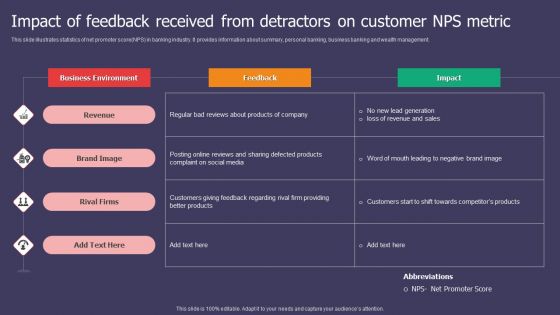
Impact Of Feedback Received From Detractors On Customer NPS Metric Ppt Inspiration Visuals PDF
This slide illustrates statistics of net promoter score NPS in banking industry. It provides information about summary, personal banking, business banking and wealth management. Pitch your topic with ease and precision using this Impact Of Feedback Received From Detractors On Customer NPS Metric Ppt Inspiration Visuals PDF. This layout presents information on Business Environment, Feedback, Revenue. It is also available for immediate download and adjustment. So, changes can be made in the color, design, graphics or any other component to create a unique layout.

Strategic Plan For Organization Diversity And Inclusion With Metric Diagrams PDF
This slide showcases strategic action plan for organization to develop a diversity and inclusion program which helps in business sustainability. It provides information regarding engaging stakeholders and developing Pitch your topic with ease and precision using this Strategic Plan For Organization Diversity And Inclusion With Metric Diagrams PDF. This layout presents information on Objectives, Actionable Points, Strategies. It is also available for immediate download and adjustment. So, changes can be made in the color, design, graphics or any other component to create a unique layout.

Financial Comparison Enterprise Software Solution Providing Company Profile CP SS V
Following slide provides information about software solutions offering company financial comparison. It includes financial metrics such as revenue, cost of goods sold, gross profit and net profit.Welcome to our selection of the Financial Comparison Enterprise Software Solution Providing Company Profile CP SS V. These are designed to help you showcase your creativity and bring your sphere to life. Planning and Innovation are essential for any business that is just starting out. This collection contains the designs that you need for your everyday presentations. All of our PowerPoints are 100 percent editable, so you can customize them to suit your needs. This multi-purpose template can be used in various situations. Grab these presentation templates today.
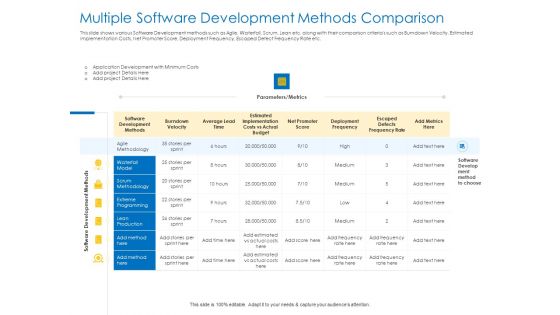
Agile Best Practices For Effective Team Multiple Software Development Methods Comparison Formats PDF
Deliver an awe inspiring pitch with this creative agile best practices for effective team multiple software development methods comparison formats pdf bundle. Topics like development, implementation, costs, metrics, deployment can be discussed with this completely editable template. It is available for immediate download depending on the needs and requirements of the user.
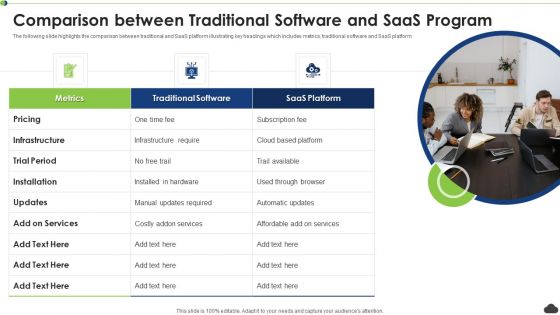
Comparison Between Traditional Software And Saas Program Ppt PowerPoint Presentation File Show PDF
The following slide highlights the comparison between traditional and SaaS platform illustrating key headings which includes metrics, traditional software and SaaS platform. Persuade your audience using this comparison between traditional software and saas program ppt powerpoint presentation file show pdf. This PPT design covers three stages, thus making it a great tool to use. It also caters to a variety of topics including pricing, metrics, traditional software, saas platform. Download this PPT design now to present a convincing pitch that not only emphasizes the topic but also showcases your presentation skills.
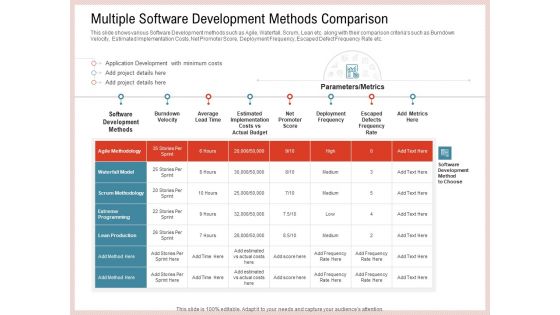
Agile Model Improve Task Team Performance Multiple Software Development Methods Comparison Elements PDF
This slide shows various Software Development methods such as Agile, Waterfall, Scrum, Lean etc. along with their comparison criterias such as Burndown Velocity, Estimated Implementation Costs, Net Promoter Score, Deployment Frequency, Escaped Defect Frequency Rate etc. Deliver an awe inspiring pitch with this creative aagile model improve task team performance multiple software development methods comparison elements pdf bundle. Topics like development, implementation, costs, metrics, deployment can be discussed with this completely editable template. It is available for immediate download depending on the needs and requirements of the user.
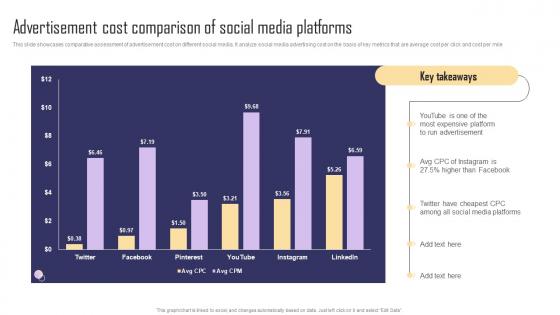
Advertisement Cost Comparison Of Social Media Paid Internet Marketing Strategy Information Pdf
This slide showcases comparative assessment of advertisement cost on different social media. It analyze social media advertising cost on the basis of key metrics that are average cost per click and cost per mile. Boost your pitch with our creative Advertisement Cost Comparison Of Social Media Paid Internet Marketing Strategy Information Pdf. Deliver an awe-inspiring pitch that will mesmerize everyone. Using these presentation templates you will surely catch everyones attention. You can browse the ppts collection on our website. We have researchers who are experts at creating the right content for the templates. So you do not have to invest time in any additional work. Just grab the template now and use them.

Marketing Analytics And Performance Tools Comparison Comprehensive Guide For Marketing Technology
Mentioned slide demonstrates comparative assessment between marketing analytics and performance tracking software solution. It includes key metrics such as data integration, ease of use, data visualization, analytics features, cost, scalability, etc.Get a simple yet stunning designed Marketing Analytics And Performance Tools Comparison Comprehensive Guide For Marketing Technology. It is the best one to establish the tone in your meetings. It is an excellent way to make your presentations highly effective. So, download this PPT today from Slidegeeks and see the positive impacts. Our easy-to-edit Marketing Analytics And Performance Tools Comparison Comprehensive Guide For Marketing Technology can be your go-to option for all upcoming conferences and meetings. So, what are you waiting for Grab this template today.

Computer Mediated Reality Investor Funding Elevator Comparing Our Product Values In Comparison To Competitors Template PDF
Purpose of the following slide is to compare our organization to our competitors as it highlights the key metrics on which we can compare such as Ease to use, space requirements etc. Deliver an awe inspiring pitch with this creative computer mediated reality investor funding elevator comparing our product values in comparison to competitors template pdf bundle. Topics like comparing our product values in comparison to competitors can be discussed with this completely editable template. It is available for immediate download depending on the needs and requirements of the user.

Cyberspace Simulation Platform Fundraising Elevator Comparing Our Product Values In Comparison Summary PDF
Purpose of the following slide is to compare our organization to our competitors as it highlights the key metrics on which we can compare such as Ease to use, space requirements etc. Deliver and pitch your topic in the best possible manner with this cyberspace simulation platform fundraising elevator comparing our product values in comparison summary pdf. Use them to share invaluable insights on comparing our product values in comparison to competitors and impress your audience. This template can be altered and modified as per your expectations. So, grab it now.
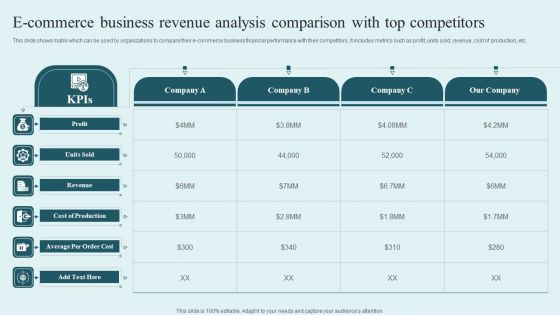
E Commerce Business Revenue Analysis Comparison With Top Competitors Rules PDF
This slide shows matrix which can be used by organizations to compare their e-commerce business financial performance with their competitors. It includes metrics such as profit, units sold, revenue, cost of production, etc. Showcasing this set of slides titled E Commerce Business Revenue Analysis Comparison With Top Competitors Rules PDF. The topics addressed in these templates are Profit, Revenue, Average Per, Order Cost . All the content presented in this PPT design is completely editable. Download it and make adjustments in color, background, font etc. as per your unique business setting.
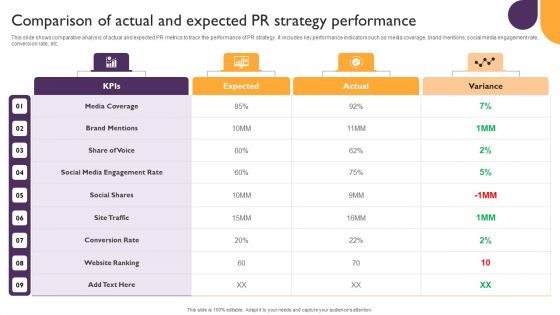
Public Relations Guide To Enhance Brand Credibility Comparison Of Actual And Expected PR Strategy Clipart PDF
This slide shows comparative analysis of actual and expected PR metrics to track the performance of PR strategy. It includes key performance indicators such as media coverage, brand mentions, social media engagement rate, conversion rate, etc. Whether you have daily or monthly meetings, a brilliant presentation is necessary. Public Relations Guide To Enhance Brand Credibility Comparison Of Actual And Expected PR Strategy Clipart PDF can be your best option for delivering a presentation. Represent everything in detail using Public Relations Guide To Enhance Brand Credibility Comparison Of Actual And Expected PR Strategy Clipart PDF and make yourself stand out in meetings. The template is versatile and follows a structure that will cater to your requirements. All the templates prepared by Slidegeeks are easy to download and edit. Our research experts have taken care of the corporate themes as well. So, give it a try and see the results.
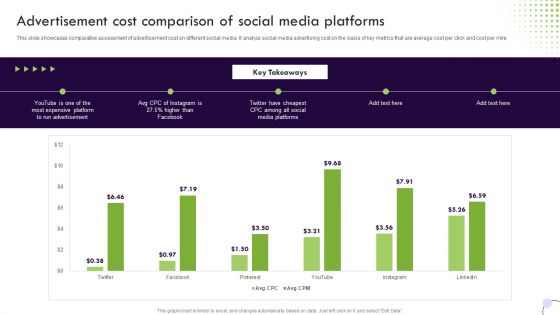
Performance Based Marketing Advertisement Cost Comparison Of Social Media Platforms Formats PDF
This slide showcases comparative assessment of advertisement cost on different social media. It analyze social media advertising cost on the basis of key metrics that are average cost per click and cost per mile. Slidegeeks is one of the best resources for PowerPoint templates. You can download easily and regulate Performance Based Marketing Advertisement Cost Comparison Of Social Media Platforms Formats PDF for your personal presentations from our wonderful collection. A few clicks is all it takes to discover and get the most relevant and appropriate templates. Use our Templates to add a unique zing and appeal to your presentation and meetings. All the slides are easy to edit and you can use them even for advertisement purposes.
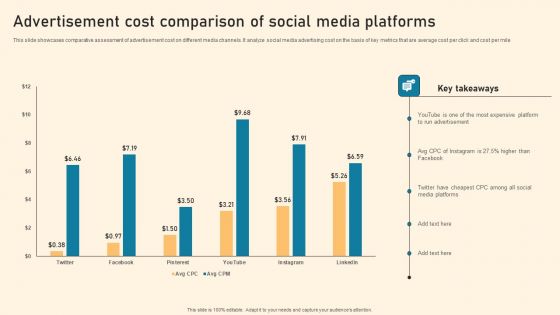
Advertisement Cost Comparison Of Social Media Platforms Ppt PowerPoint Presentation File Example File PDF
This slide showcases comparative assessment of advertisement cost on different media channels. It analyze social media advertising cost on the basis of key metrics that are average cost per click and cost per mile Boost your pitch with our creative Advertisement Cost Comparison Of Social Media Platforms Ppt PowerPoint Presentation File Example File PDF. Deliver an awe-inspiring pitch that will mesmerize everyone. Using these presentation templates you will surely catch everyones attention. You can browse the ppts collection on our website. We have researchers who are experts at creating the right content for the templates. So you do not have to invest time in any additional work. Just grab the template now and use them.
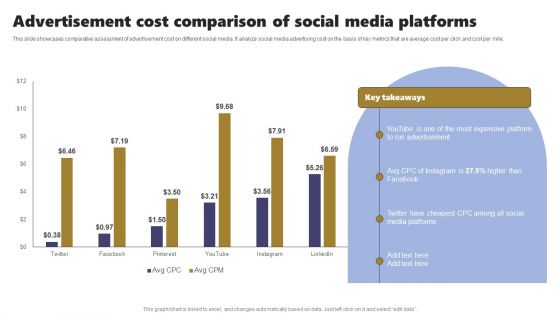
Acquiring Clients Through Search Engine And Native Ads Advertisement Cost Comparison Social Media Formats PDF
This slide showcases comparative assessment of advertisement cost on different social media. It analyze social media advertising cost on the basis of key metrics that are average cost per click and cost per mile. Boost your pitch with our creative Acquiring Clients Through Search Engine And Native Ads Advertisement Cost Comparison Social Media Formats PDF. Deliver an awe-inspiring pitch that will mesmerize everyone. Using these presentation templates you will surely catch everyones attention. You can browse the ppts collection on our website. We have researchers who are experts at creating the right content for the templates. So you do not have to invest time in any additional work. Just grab the template now and use them.

Online Marketing Strategy For Lead Generation Advertisement Cost Comparison Of Social Media Platforms Clipart PDF
This slide showcases comparative assessment of advertisement cost on different social media. It analyze social media advertising cost on the basis of key metrics that are average cost per click and cost per mile Welcome to our selection of the Online Marketing Strategy For Lead Generation Advertisement Cost Comparison Of Social Media Platforms Clipart PDF. These are designed to help you showcase your creativity and bring your sphere to life. Planning and Innovation are essential for any business that is just starting out. This collection contains the designs that you need for your everyday presentations. All of our PowerPoints are 100 percent editable, so you can customize them to suit your needs. This multi-purpose template can be used in various situations. Grab these presentation templates today

Advertisement Cost Comparison Of Social Media Platforms Ppt PowerPoint Presentation Diagram PDF
This slide showcases comparative assessment of advertisement cost on different social media. It analyze social media advertising cost on the basis of key metrics that are average cost per click and cost per mile Slidegeeks is here to make your presentations a breeze with Advertisement Cost Comparison Of Social Media Platforms Ppt PowerPoint Presentation Diagram PDF With our easy to use and customizable templates, you can focus on delivering your ideas rather than worrying about formatting. With a variety of designs to choose from, you are sure to find one that suits your needs. And with animations and unique photos, illustrations, and fonts, you can make your presentation pop. So whether you are giving a sales pitch or presenting to the board, make sure to check out Slidegeeks first.

Strategic Performance Marketing Campaign Advertisement Cost Comparison Of Social Brochure Pdf
This slide showcases comparative assessment of advertisement cost on different social media. It analyze social media advertising cost on the basis of key metrics that are average cost per click and cost per mile. Present like a pro with Strategic Performance Marketing Campaign Advertisement Cost Comparison Of Social Brochure Pdf Create beautiful presentations together with your team, using our easy-to-use presentation slides. Share your ideas in real-time and make changes on the fly by downloading our templates. So whether you are in the office, on the go, or in a remote location, you can stay in sync with your team and present your ideas with confidence. With Slidegeeks presentation got a whole lot easier. Grab these presentations today.
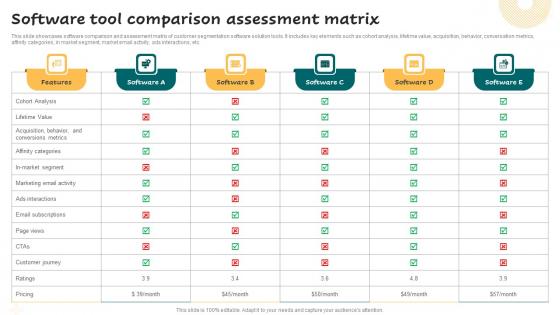
Software Tool Comparison Assessment Matrix Successful Guide For Market Segmentation Topics Pdf
This slide showcases software comparison and assessment matrix of customer segmentation software solution tools. It includes key elements such as cohort analysis, lifetime value, acquisition, behavior, conversation metrics, affinity categories, in market segment, market email activity, ads interactions, etc. Find a pre-designed and impeccable Software Tool Comparison Assessment Matrix Successful Guide For Market Segmentation Topics Pdf. The templates can ace your presentation without additional effort. You can download these easy-to-edit presentation templates to make your presentation stand out from others. So, what are you waiting for Download the template from Slidegeeks today and give a unique touch to your presentation.

Software Tool Comparison Assessment Matrix Guide For Segmenting And Formulating Guidelines Pdf
This slide showcases software comparison and assessment matrix of customer segmentation software solution tools. It includes key elements such as cohort analysis, lifetime value, acquisition, behavior, conversation metrics, affinity categories, in market segment, market email activity, ads interactions, etc. Crafting an eye catching presentation has never been more straightforward. Let your presentation shine with this tasteful yet straightforward Software Tool Comparison Assessment Matrix Guide For Segmenting And Formulating Guidelines Pdf template. It offers a minimalistic and classy look that is great for making a statement. The colors have been employed intelligently to add a bit of playfulness while still remaining professional. Construct the ideal Software Tool Comparison Assessment Matrix Guide For Segmenting And Formulating Guidelines Pdf that effortlessly grabs the attention of your audience. Begin now and be certain to wow your customers.
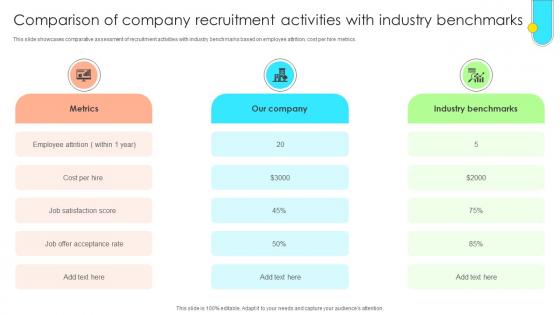
Data Driven Approach To Optimise Comparison Of Company Recruitment Activities CRP SS V
This slide showcases comparative assessment of recruitment activities with industry benchmarks based on employee attrition, cost per hire metrics. If your project calls for a presentation, then Slidegeeks is your go-to partner because we have professionally designed, easy-to-edit templates that are perfect for any presentation. After downloading, you can easily edit Data Driven Approach To Optimise Comparison Of Company Recruitment Activities CRP SS V and make the changes accordingly. You can rearrange slides or fill them with different images. Check out all the handy templates
Comparison Of Traditional Digital Biomarkers For Personalized Health Insights Icons Pdf
This slide describes the comparison between traditional and digital biomarkers characteristics, including qualitative and quantitative measurements, cost, intrusiveness, modularity, and use of both methods in medical research. Create an editable Comparison Of Traditional Digital Biomarkers For Personalized Health Insights Icons Pdf that communicates your idea and engages your audience. Whether you are presenting a business or an educational presentation, pre designed presentation templates help save time. Comparison Of Traditional Digital Biomarkers For Personalized Health Insights Icons Pdf is highly customizable and very easy to edit, covering many different styles from creative to business presentations. Slidegeeks has creative team members who have crafted amazing templates. So, go and get them without any delay.
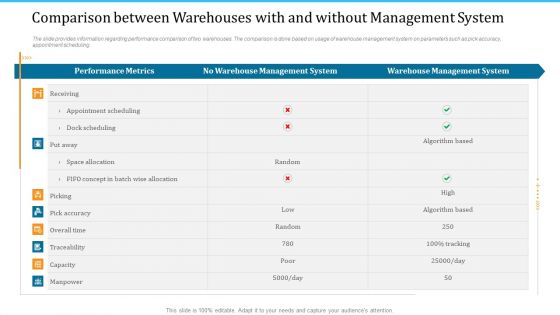
WMS Implementation Comparison Between Warehouses With And Without Management System Elements PDF
The slide provides information regarding performance comparison of two warehouses. The comparison is done based on usage of warehouse management system on parameters such as pick accuracy, appointment scheduling. Deliver an awe-inspiring pitch with this creative wms implementation comparison between warehouses with and without management system elements pdf bundle. Topics like performance metrics, warehouse management system can be discussed with this completely editable template. It is available for immediate download depending on the needs and requirements of the user.

Transforming Recruitment Process Comparison Of Company Recruitment Activities CRP DK SS
This slide showcases comparative assessment of recruitment activities with industry benchmarks based on employee attrition, cost per hire metrics. If you are looking for a format to display your unique thoughts, then the professionally designed Transforming Recruitment Process Comparison Of Company Recruitment Activities CRP DK SS is the one for you. You can use it as a Google Slides template or a PowerPoint template. Incorporate impressive visuals, symbols, images, and other charts. Modify or reorganize the text boxes as you desire. Experiment with shade schemes and font pairings. Alter, share or cooperate with other people on your work. Download Transforming Recruitment Process Comparison Of Company Recruitment Activities CRP DK SS and find out how to give a successful presentation. Present a perfect display to your team and make your presentation unforgettable.
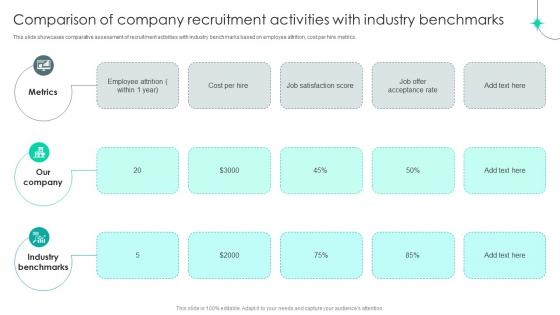
Strategic Staffing Using Data Comparison Of Company Recruitment Activities CRP DK SS V
This slide showcases comparative assessment of recruitment activities with industry benchmarks based on employee attrition, cost per hire metrics. If you are looking for a format to display your unique thoughts, then the professionally designed Strategic Staffing Using Data Comparison Of Company Recruitment Activities CRP DK SS V is the one for you. You can use it as a Google Slides template or a PowerPoint template. Incorporate impressive visuals, symbols, images, and other charts. Modify or reorganize the text boxes as you desire. Experiment with shade schemes and font pairings. Alter, share or cooperate with other people on your work. Download Strategic Staffing Using Data Comparison Of Company Recruitment Activities CRP DK SS V and find out how to give a successful presentation. Present a perfect display to your team and make your presentation unforgettable.
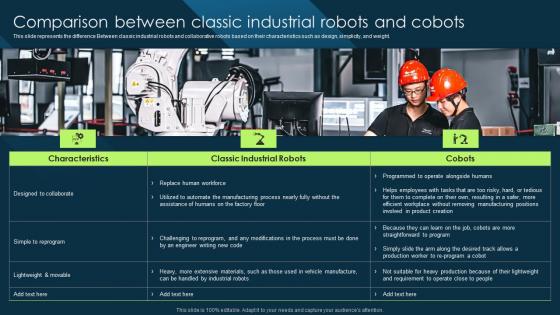
Comparison Between Classic Industrial Robots And Cobots Cobot Safety Measures And Risk Formats PDF
This slide represents the difference Between classic industrial robots and collaborative robots based on their characteristics such as design, simplicity, and weight. If you are looking for a format to display your unique thoughts, then the professionally designed Comparison Between Classic Industrial Robots And Cobots Cobot Safety Measures And Risk Formats PDF is the one for you. You can use it as a Google Slides template or a PowerPoint template. Incorporate impressive visuals, symbols, images, and other charts. Modify or reorganize the text boxes as you desire. Experiment with shade schemes and font pairings. Alter, share or cooperate with other people on your work. Download Comparison Between Classic Industrial Robots And Cobots Cobot Safety Measures And Risk Formats PDF and find out how to give a successful presentation. Present a perfect display to your team and make your presentation unforgettable.

Inventory Stock Control Comparison Between Warehouses With And Without Management System Ppt Show Format Ideas PDF
The slide provides information regarding performance comparison of two warehouses. The comparison is done based on usage of warehouse management system on parameters such as pick accuracy, appointment scheduling. Deliver an awe inspiring pitch with this creative inventory stock control comparison between warehouses with and without management system ppt show format ideas pdf bundle. Topics like performance metrics, warehouse management system, no warehouse management system can be discussed with this completely editable template. It is available for immediate download depending on the needs and requirements of the user.
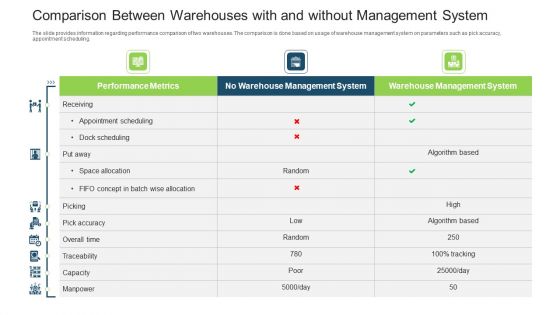
Stock Control System Comparison Between Warehouses With And Without Management System Ppt Portfolio Portrait PDF
The slide provides information regarding performance comparison of two warehouses. The comparison is done based on usage of warehouse management system on parameters such as pick accuracy, appointment scheduling. Deliver an awe inspiring pitch with this creative stock control system comparison between warehouses with and without management system ppt portfolio portrait pdf bundle. Topics like performance metrics, warehouse management system, no warehouse management system can be discussed with this completely editable template. It is available for immediate download depending on the needs and requirements of the user.
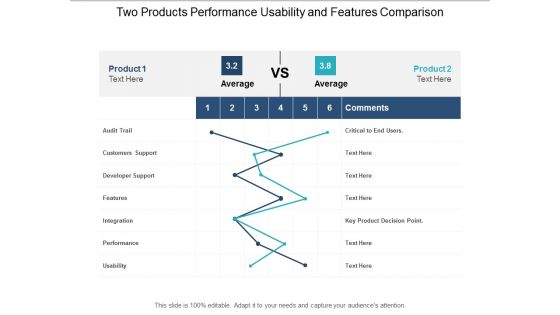
Two Products Performance Usability And Features Comparison Ppt Powerpoint Presentation Infographic Template Portrait
This is a two products performance usability and features comparison ppt powerpoint presentation infographic template portrait. This is a two stage process. The stages in this process are product differentiation, product comparison, brand differentiation.
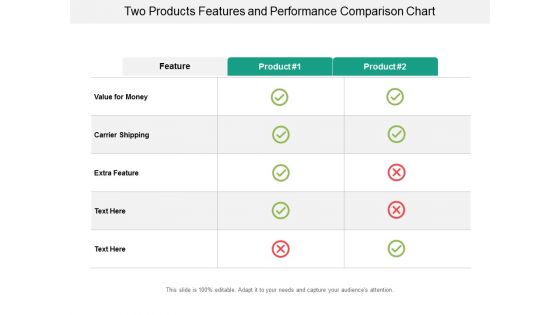
Two Products Features And Performance Comparison Chart Ppt Powerpoint Presentation Ideas Layout Ideas
This is a two products features and performance comparison chart ppt powerpoint presentation ideas layout ideas. This is a two stage process. The stages in this process are product differentiation, product comparison, brand differentiation.
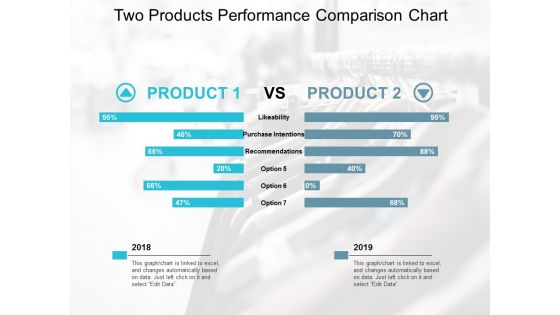
Two Products Performance Comparison Chart Ppt Powerpoint Presentation Outline Design Inspiration
This is a two products performance comparison chart ppt powerpoint presentation outline design inspiration. The topics discussed in this diagram are product differentiation, product comparison, brand differentiation. This is a completely editable PowerPoint presentation, and is available for immediate download.
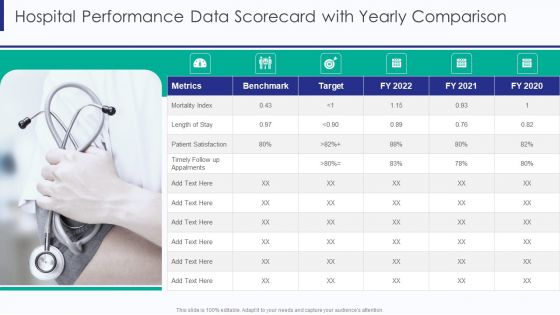
Healthcare Hospital Performance Data Scorecard With Yearly Comparison Ppt Model Templates PDF
Deliver and pitch your topic in the best possible manner with this Healthcare Hospital Performance Data Scorecard With Yearly Comparison Ppt Model Templates PDF. Use them to share invaluable insights on Mortality Index Metrics, Patient Satisfaction Target, Length Of Stay and impress your audience. This template can be altered and modified as per your expectations. So, grab it now.
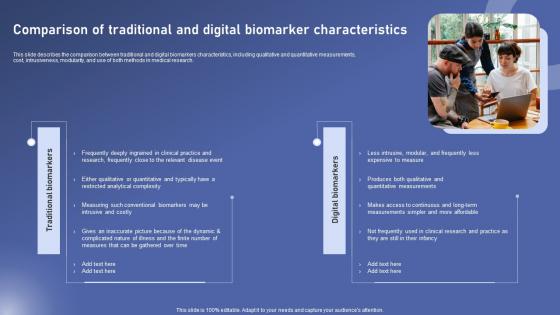
Comparison Of Traditional Digital Biomedical Data Science And Health Informatics Guidelines Pdf
This slide describes the comparison between traditional and digital biomarkers characteristics, including qualitative and quantitative measurements, cost, intrusiveness, modularity, and use of both methods in medical research. Are you in need of a template that can accommodate all of your creative concepts This one is crafted professionally and can be altered to fit any style. Use it with Google Slides or PowerPoint. Include striking photographs, symbols, depictions, and other visuals. Fill, move around, or remove text boxes as desired. Test out color palettes and font mixtures. Edit and save your work, or work with colleagues. Download Comparison Of Traditional Digital Biomedical Data Science And Health Informatics Guidelines Pdf and observe how to make your presentation outstanding. Give an impeccable presentation to your group and make your presentation unforgettable.

Comparison Of Inside And Outside Sales Strategy PPT Template Strategy SS V
This slide showcases comparative assessment of inside and outside sales done by organization to convert leads. It compares both strategies on the basis of role, sales cycle, nature of product, industry and deal size. From laying roadmaps to briefing everything in detail, our templates are perfect for you. You can set the stage with your presentation slides. All you have to do is download these easy-to-edit and customizable templates. Comparison Of Inside And Outside Sales Strategy PPT Template Strategy SS V will help you deliver an outstanding performance that everyone would remember and praise you for. Do download this presentation today.

Remote Sales Plan For Comparison Of Inside And Outside Sales Strategy SS V
This slide showcases comparative assessment of inside and outside sales done by organization to convert leads. It compares both strategies on the basis of role, sales cycle, nature of product, industry and deal size. From laying roadmaps to briefing everything in detail, our templates are perfect for you. You can set the stage with your presentation slides. All you have to do is download these easy-to-edit and customizable templates. Remote Sales Plan For Comparison Of Inside And Outside Sales Strategy SS V will help you deliver an outstanding performance that everyone would remember and praise you for. Do download this presentation today.
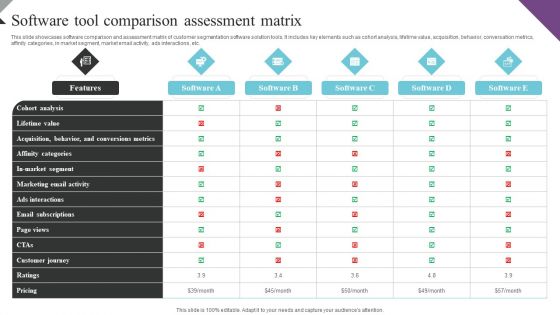
Customer Segmentation And Behavioral Analysis Software Tool Comparison Assessment Graphics PDF
This slide showcases software comparison and assessment matrix of customer segmentation software solution tools. It includes key elements such as cohort analysis, lifetime value, acquisition, behavior, conversation metrics, affinity categories, in market segment, market email activity, ads interactions, etc. The best PPT templates are a great way to save time, energy, and resources. Slidegeeks have 100 percent editable powerpoint slides making them incredibly versatile. With these quality presentation templates, you can create a captivating and memorable presentation by combining visually appealing slides and effectively communicating your message. Download Customer Segmentation And Behavioral Analysis Software Tool Comparison Assessment Graphics PDF from Slidegeeks and deliver a wonderful presentation.

Quarterly Sales Performance Of Business Dashboard With Region And Product Wise Comparison Guidelines PDF
This slide displays sales analysis for different products and regions in each quarter. t also includes inter year comparisons. Pitch your topic with ease and precision using this Quarterly Sales Performance Of Business Dashboard With Region And Product Wise Comparison Guidelines PDF. This layout presents information on Product Wise Quarterly Sales, Comparison. It is also available for immediate download and adjustment. So, changes can be made in the color, design, graphics or any other component to create a unique layout.

Comparison Of Cyber Risk Security Vendors With Pricing And Use Case Formats PDF
Mentioned slide highlights the cyber threat security vendors with uses cases, metrics, intelligence , cyber security and pricing. Pitch your topic with ease and precision using this comparison of cyber risk security vendors with pricing and use case formats pdf. This layout presents information on financial services, cyber security, intelligence. It is also available for immediate download and adjustment. So, changes can be made in the color, design, graphics or any other component to create a unique layout.
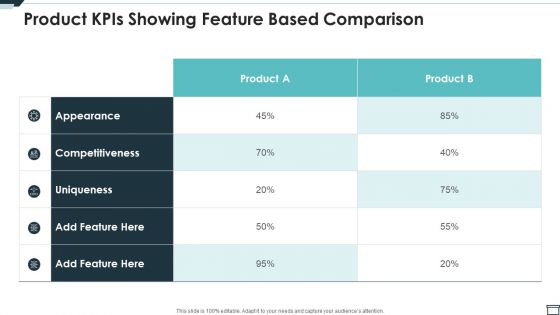
Product Kpis Showing Feature Based Comparison Ppt PowerPoint Presentation Gallery Layouts PDF
Pitch your topic with ease and precision using this product kpis showing feature based comparison ppt powerpoint presentation gallery layouts pdf. This layout presents information on product kpis showing feature based comparison. It is also available for immediate download and adjustment. So, changes can be made in the color, design, graphics or any other component to create a unique layout.
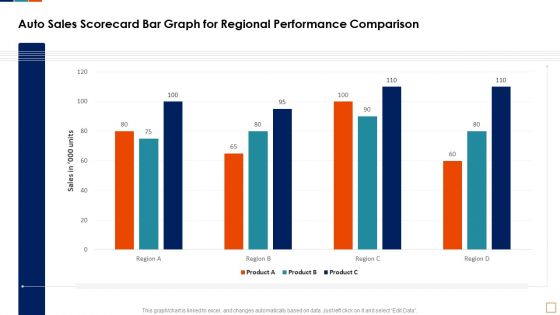
Auto Sales Scorecard Bar Graph For Regional Performance Comparison Infographics PDF
This graph or chart is linked to excel, and changes automatically based on data. Just left click on it and select Edit Data. Deliver an awe inspiring pitch with this creative Auto Sales Scorecard Bar Graph For Regional Performance Comparison Infographics PDF bundle. Topics like Auto Sales Scorecard, Bar Graph Regional, Performance Comparison Product can be discussed with this completely editable template. It is available for immediate download depending on the needs and requirements of the user.

Two Business Products Performance Comparison Ppt PowerPoint Presentation Gallery Slide Portrait PDF
Presenting two business products performance comparison ppt powerpoint presentation gallery slide portrait pdf to dispense important information. This template comprises two stages. It also presents valuable insights into the topics including two business products performance comparison. This is a completely customizable PowerPoint theme that can be put to use immediately. So, download it and address the topic impactfully.
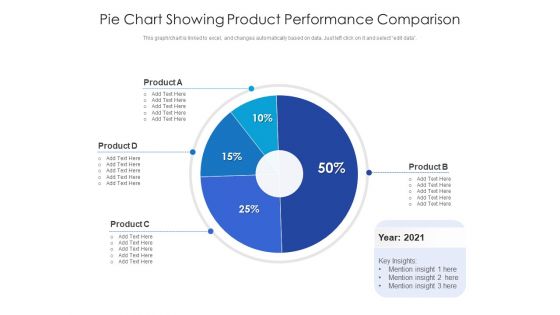
Pie Chart Showing Product Performance Comparison Ppt PowerPoint Presentation Professional Background Designs PDF
Showcasing this set of slides titled pie chart showing product performance comparison ppt powerpoint presentation professional background designs pdf. The topics addressed in these templates are pie chart showing product performance comparison. All the content presented in this PPT design is completely editable. Download it and make adjustments in color, background, font etc. as per your unique business setting.
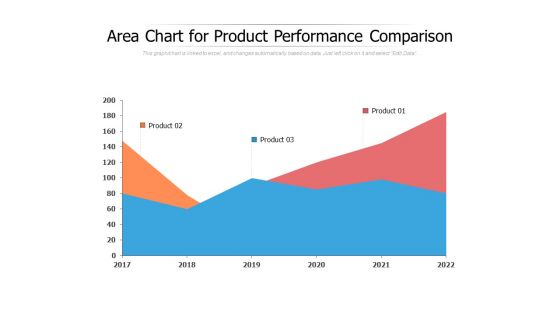
Area Chart For Product Performance Comparison Ppt PowerPoint Presentation Outline Slide Portrait
Presenting this set of slides with name area chart for product performance comparison ppt powerpoint presentation outline slide portrait. The topics discussed in these slide is area chart for product performance comparison. This is a completely editable PowerPoint presentation and is available for immediate download. Download now and impress your audience.
Product Performance Comparison Report Vector Icon Ppt PowerPoint Presentation Infographics Graphic Images PDF
Presenting this set of slides with name product performance comparison report vector icon ppt powerpoint presentation infographics graphic images pdf. The topics discussed in these slide is product performance comparison report vector icon. This is a completely editable PowerPoint presentation and is available for immediate download. Download now and impress your audience.

Covid 19 Risk Mitigation Measures On Live Sports Comparison Download PDF
This is a covid 19 risk mitigation measures on live sports comparison download pdf template with various stages. Focus and dispense information on two stages using this creative set, that comes with editable features. It contains large content boxes to add your information on topics like comparison. You can also showcase facts, figures, and other relevant content using this PPT layout. Grab it now.

Software Tool Comparison Assessment Matrix Ppt PowerPoint Presentation File Model PDF
This slide showcases software comparison and assessment matrix of customer segmentation software solution tools. It includes key elements such as cohort analysis, lifetime value, acquisition, behavior, conversation metrics, affinity categories, in market segment, market email activity, ads interactions, etc. Do you know about Slidesgeeks Software Tool Comparison Assessment Matrix Ppt PowerPoint Presentation File Model PDF These are perfect for delivering any kind od presentation. Using it, create PowerPoint presentations that communicate your ideas and engage audiences. Save time and effort by using our pre designed presentation templates that are perfect for a wide range of topic. Our vast selection of designs covers a range of styles, from creative to business, and are all highly customizable and easy to edit. Download as a PowerPoint template or use them as Google Slides themes.
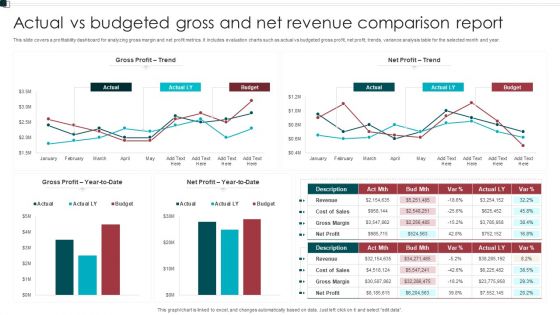
Actual Vs Budgeted Gross And Net Revenue Comparison Report Sample PDF
This slide covers a profitability dashboard for analyzing gross margin and net profit metrics. It includes evaluation charts such as actual vs budgeted gross profit, net profit, trends, variance analysis table for the selected month and year. Pitch your topic with ease and precision using this Actual Vs Budgeted Gross And Net Revenue Comparison Report Sample PDF. This layout presents information on Gross Profit, Net Profit, Budget. It is also available for immediate download and adjustment. So, changes can be made in the color, design, graphics or any other component to create a unique layout.
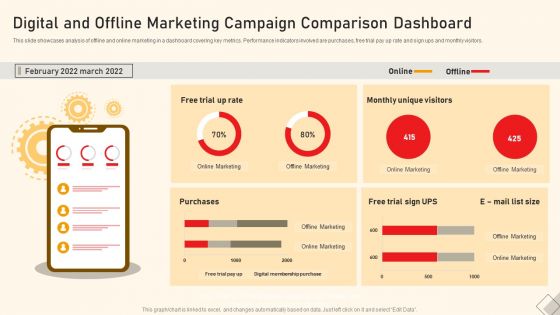
Digital And Offline Marketing Campaign Comparison Dashboard Ppt Inspiration Microsoft PDF
This slide showcases analysis of offline and online marketing in a dashboard covering key metrics. Performance indicators involved are purchases, free trial pay up rate and sign ups and monthly visitors. Pitch your topic with ease and precision using this Digital And Offline Marketing Campaign Comparison Dashboard Ppt Inspiration Microsoft PDF. This layout presents information on Online Marketing, Offline Marketing, Free Trial Sign, UPS. It is also available for immediate download and adjustment. So, changes can be made in the color, design, graphics or any other component to create a unique layout.

Five Years Timeline For Product Performance Comparison Ppt PowerPoint Presentation Pictures Introduction PDF
This is a five years timeline for product performance comparison ppt powerpoint presentation pictures introduction pdf template with various stages. Focus and dispense information on six stages using this creative set, that comes with editable features. It contains large content boxes to add your information on topics like five years timeline for product performance comparison 2016 to 2020. You can also showcase facts, figures, and other relevant content using this PPT layout. Grab it now.

KPI Dashboard Of Customer And Product Sales Performance Comparison Information PDF
This slide shows the KPI dashboard of client and product sales comparison. It also includes sales by location and total sales. Pitch your topic with ease and precision using this KPI Dashboard Of Customer And Product Sales Performance Comparison Information PDF. This layout presents information on Product Sales, Client Sales, Tim Santana. It is also available for immediate download and adjustment. So, changes can be made in the color, design, graphics or any other component to create a unique layout.
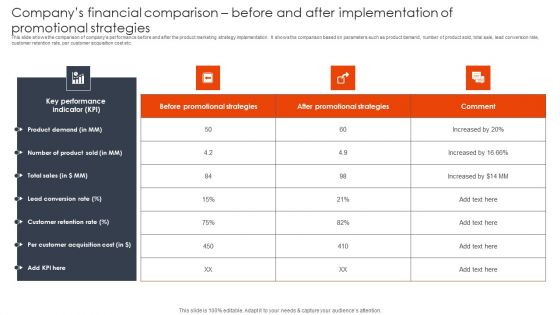
Companys Financial Comparison Before And After Client Acquisition Techniques To Boost Sales Slides PDF
This slide shows the comparison of companys performance before and after the product marketing strategy implementation. It shows the comparison based on parameters such as product demand, number of product sold, total sale, lead conversion rate, customer retention rate, per customer acquisition cost etc. Find a pre-designed and impeccable Companys Financial Comparison Before And After Client Acquisition Techniques To Boost Sales Slides PDF. The templates can ace your presentation without additional effort. You can download these easy-to-edit presentation templates to make your presentation stand out from others. So, what are you waiting for Download the template from Slidegeeks today and give a unique touch to your presentation.
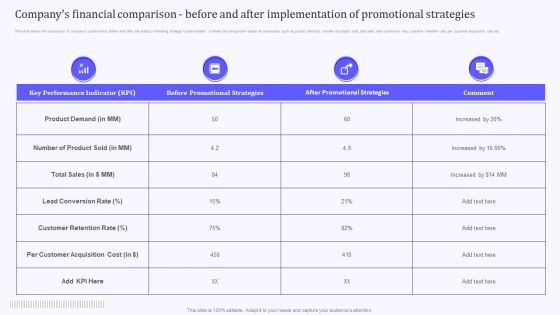
Product Marketing And Awareness Programs Companys Financial Comparison Before And After Rules PDF
This slide shows the comparison of companys performance before and after the product marketing strategy implementation. It shows the comparison based on parameters such as product demand, number of product sold, total sale, lead conversion rate, customer retention rate, per customer acquisition cost etc. Do you have an important presentation coming up Are you looking for something that will make your presentation stand out from the rest Look no further than Product Marketing And Awareness Programs Companys Financial Comparison Before And After Rules PDF. With our professional designs, you can trust that your presentation will pop and make delivering it a smooth process. And with Slidegeeks, you can trust that your presentation will be unique and memorable. So why wait Grab Product Marketing And Awareness Programs Companys Financial Comparison Before And After Rules PDF today and make your presentation stand out from the rest.

Managed Funds Performance Comparison Ppt PowerPoint Presentation Ideas Graphic Tips Cpb Pdf
Presenting this set of slides with name managed funds performance comparison ppt powerpoint presentation ideas graphic tips cpb pdf. This is an editable Powerpoint five stages graphic that deals with topics like managed funds performance comparison to help convey your message better graphically. This product is a premium product available for immediate download and is 100 percent editable in Powerpoint. Download this now and use it in your presentations to impress your audience.
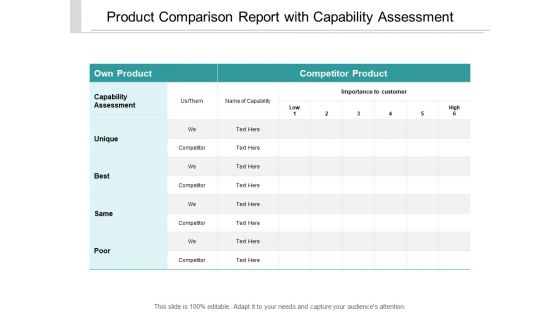
Product Comparison Report With Capability Assessment Ppt PowerPoint Presentation Infographic Template Graphics Template
Presenting this set of slides with name product comparison report with capability assessment ppt powerpoint presentation infographic template graphics template. The topics discussed in these slides are competition scorecard, competitors performance, competitors analysis. This is a completely editable PowerPoint presentation and is available for immediate download. Download now and impress your audience.

Product Comparison Report Market Awareness And Customer Experience Ppt PowerPoint Presentation Summary Design Ideas
Presenting this set of slides with name product comparison report market awareness and customer experience ppt powerpoint presentation summary design ideas. The topics discussed in these slides are competition scorecard, competitors performance, competitors analysis. This is a completely editable PowerPoint presentation and is available for immediate download. Download now and impress your audience.
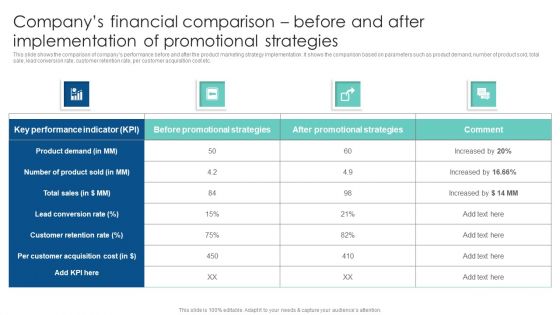
Companys Financial Comparison Before And After Implementation Customer Acquisition Through Advertising Elements PDF
This slide shows the comparison of companys performance before and after the product marketing strategy implementation. It shows the comparison based on parameters such as product demand, number of product sold, total sale, lead conversion rate, customer retention rate, per customer acquisition cost etc. Here you can discover an assortment of the finest PowerPoint and Google Slides templates. With these templates, you can create presentations for a variety of purposes while simultaneously providing your audience with an eye-catching visual experience. Download Companys Financial Comparison Before And After Implementation Customer Acquisition Through Advertising Elements PDF to deliver an impeccable presentation. These templates will make your job of preparing presentations much quicker, yet still, maintain a high level of quality. Slidegeeks has experienced researchers who prepare these templates and write high-quality content for you. Later on, you can personalize the content by editing the Companys Financial Comparison Before And After Implementation Customer Acquisition Through Advertising Elements PDF.
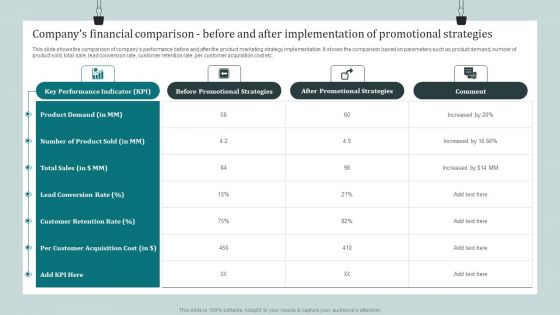
Companys Financial Comparison Before And After Implementation Of Promotional Strategies Introduction PDF
This slide shows the comparison of companys performance before and after the product marketing strategy implementation. It shows the comparison based on parameters such as product demand, number of product sold, total sale, lead conversion rate, customer retention rate, per customer acquisition cost etc. If you are looking for a format to display your unique thoughts, then the professionally designed Companys Financial Comparison Before And After Implementation Of Promotional Strategies Introduction PDF is the one for you. You can use it as a Google Slides template or a PowerPoint template. Incorporate impressive visuals, symbols, images, and other charts. Modify or reorganize the text boxes as you desire. Experiment with shade schemes and font pairings. Alter, share or cooperate with other people on your work. Download Companys Financial Comparison Before And After Implementation Of Promotional Strategies Introduction PDF and find out how to give a successful presentation. Present a perfect display to your team and make your presentation unforgettable.

Companys Financial Comparison Before And After Implementation Of Promotional Strategies Infographics PDF
This slide shows the comparison of companys performance before and after the product marketing strategy implementation. It shows the comparison based on parameters such as product demand, number of product sold, total sale, lead conversion rate, customer retention rate, per customer acquisition cost etc. If you are looking for a format to display your unique thoughts, then the professionally designed Companys Financial Comparison Before And After Implementation Of Promotional Strategies Infographics PDF is the one for you. You can use it as a Google Slides template or a PowerPoint template. Incorporate impressive visuals, symbols, images, and other charts. Modify or reorganize the text boxes as you desire. Experiment with shade schemes and font pairings. Alter, share or cooperate with other people on your work. Download Companys Financial Comparison Before And After Implementation Of Promotional Strategies Infographics PDF and find out how to give a successful presentation. Present a perfect display to your team and make your presentation unforgettable.
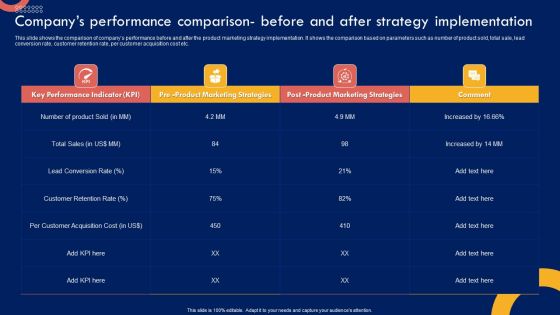
Product Marketing Leadership Companys Performance Comparison Before And After Graphics PDF
This slide shows the comparison of companys performance before and after the product marketing strategy implementation. It shows the comparison based on parameters such as number of product sold, total sale, lead conversion rate, customer retention rate, per customer acquisition cost etc. Slidegeeks is one of the best resources for PowerPoint templates. You can download easily and regulate Product Marketing Leadership Companys Performance Comparison Before And After Graphics PDF for your personal presentations from our wonderful collection. A few clicks is all it takes to discover and get the most relevant and appropriate templates. Use our Templates to add a unique zing and appeal to your presentation and meetings. All the slides are easy to edit and you can use them even for advertisement purposes.

Efficient Product Marketing Techniques Companys Performance Comparison Before And After Strategy Formats PDF
This slide shows the comparison of companys performance before and after the product marketing strategy implementation. It shows the comparison based on parameters such as number of product sold, total sale, lead conversion rate, customer retention rate, per customer acquisition cost etc. Boost your pitch with our creative Efficient Product Marketing Techniques Companys Performance Comparison Before And After Strategy Formats PDF. Deliver an awe inspiring pitch that will mesmerize everyone. Using these presentation templates you will surely catch everyones attention. You can browse the ppts collection on our website. We have researchers who are experts at creating the right content for the templates. So you don not have to invest time in any additional work. Just grab the template now and use them.
Catering Business Advertisement Plan KPI Dashboard With Revenue Comparison Icons PDF
This slide shows the KPI dashboard of the catering industry to evaluate the actual and potential targets. It includes KPIs such as expenditure, sales revenue, beverage, etc. Showcasing this set of slides titled Catering Business Advertisement Plan KPI Dashboard With Revenue Comparison Icons PDF. The topics addressed in these templates are Expenditure, Revenue Comparison, Department. All the content presented in this PPT design is completely editable. Download it and make adjustments in color, background, font etc. as per your unique business setting.
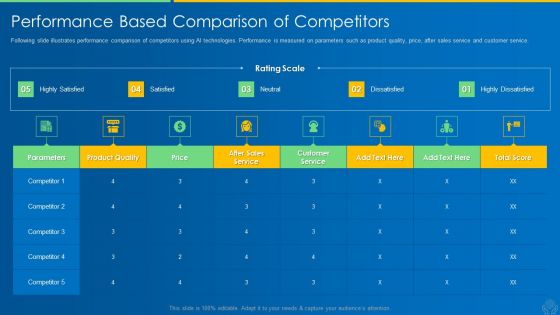
AI And ML Driving Monetary Value For Organization Performance Based Comparison Of Competitors Infographics PDF
Following slide illustrates performance comparison of competitors using AI technologies. Performance is measured on parameters such as product quality, price, after sales service and customer service. Deliver an awe inspiring pitch with this creative ai and ml driving monetary value for organization performance based comparison of competitors infographics pdf bundle. Topics like parameters, product quality, price, after sales service, customer service can be discussed with this completely editable template. It is available for immediate download depending on the needs and requirements of the user.

Companys Performance Comparison Before And After Strategy Ppt PowerPoint Presentation File Ideas PDF
This slide shows the comparison of companys performance before and after the product marketing strategy implementation. It shows the comparison based on parameters such as number of product sold, total sale, lead conversion rate, customer retention rate, per customer acquisition cost etc. Boost your pitch with our creative Companys Performance Comparison Before And After Strategy Ppt PowerPoint Presentation File Ideas PDF. Deliver an awe inspiring pitch that will mesmerize everyone. Using these presentation templates you will surely catch everyones attention. You can browse the ppts collection on our website. We have researchers who are experts at creating the right content for the templates. So you do not have to invest time in any additional work. Just grab the template now and use them.
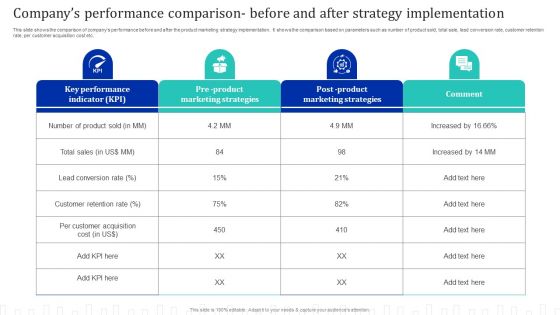
Approach Optimization For Brand Promotion Strategy Companys Performance Comparison Before Mockup PDF
This slide shows the comparison of companys performance before and after the product marketing strategy implementation. It shows the comparison based on parameters such as number of product sold, total sale, lead conversion rate, customer retention rate, per customer acquisition cost etc.Boost your pitch with our creative Approach Optimization For Brand Promotion Strategy Companys Performance Comparison Before Mockup PDF. Deliver an awe-inspiring pitch that will mesmerize everyone. Using these presentation templates you will surely catch everyones attention. You can browse the ppts collection on our website. We have researchers who are experts at creating the right content for the templates. So you do not have to invest time in any additional work. Just grab the template now and use them.

Brand Awareness Plan Companys Performance Comparison Before And After Introduction PDF
This slide shows the comparison of companys performance before and after the product marketing strategy implementation. It shows the comparison based on parameters such as number of product sold, total sale, lead conversion rate, customer retention rate, per customer acquisition cost etc. Welcome to our selection of the Brand Awareness Plan Companys Performance Comparison Before And After Introduction PDF. These are designed to help you showcase your creativity and bring your sphere to life. Planning and Innovation are essential for any business that is just starting out. This collection contains the designs that you need for your everyday presentations. All of our PowerPoints are 100 percent editable, so you can customize them to suit your needs. This multi-purpose template can be used in various situations. Grab these presentation templates today.

Competitors Product KPI Comparison Scorecard Matrix With Attributes And Rating Topics PDF
This slide covers products compared on basis of different attributes for various competitors products. It includes market awareness, product quality, design, price, etc. Showcasing this set of slides titled Competitors Product KPI Comparison Scorecard Matrix With Attributes And Rating Topics PDF. The topics addressed in these templates are Product Quality, Product Design, Price. All the content presented in this PPT design is completely editable. Download it and make adjustments in color, background, font etc. as per your unique business setting.

Product And Services Promotion Companys Financial Comparison Before And After Guidelines PDF
This slide shows the comparison of companys performance before and after the product marketing strategy implementation. It shows the comparison based on parameters such as product demand, number of product sold, total sale, lead conversion rate, customer retention rate, per customer acquisition cost etc. Are you in need of a template that can accommodate all of your creative concepts This one is crafted professionally and can be altered to fit any style. Use it with Google Slides or PowerPoint. Include striking photographs, symbols, depictions, and other visuals. Fill, move around, or remove text boxes as desired. Test out color palettes and font mixtures. Edit and save your work, or work with colleagues. Download Product And Services Promotion Companys Financial Comparison Before And After Guidelines PDF and observe how to make your presentation outstanding. Give an impeccable presentation to your group and make your presentation unforgettable.

Comparison Of Retail Store Inventory Management Software Retail Outlet Performance Assessment Mockup PDF
This slide compares the multiple inventory management system software on parameters such as the number of products supported, the number of users supported, free time period, upgrade cost, etc.This is a Comparison Of Retail Store Inventory Management Software Retail Outlet Performance Assessment Mockup PDF template with various stages. Focus and dispense information on one stage using this creative set, that comes with editable features. It contains large content boxes to add your information on topics like Comparison Parameters, Products Supported, Management Software. You can also showcase facts, figures, and other relevant content using this PPT layout. Grab it now.
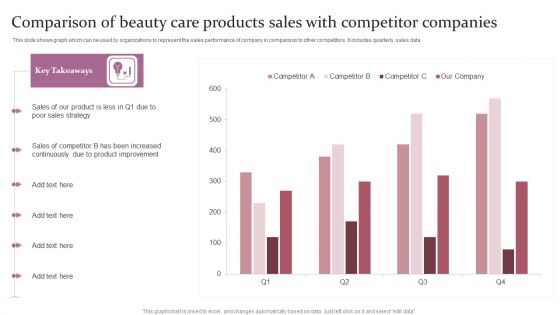
Comparison Of Beauty Care Products Sales With Competitor Companies Ppt Slides Samples PDF
This slide shows graph which can be used by organizations to represent the sales performance of company in comparison to other competitors. It includes quarterly sales data Showcasing this set of slides titled Comparison Of Beauty Care Products Sales With Competitor Companies Ppt Slides Samples PDF. The topics addressed in these templates are Our Product, Poor Sales Strategy, Product Improvement. All the content presented in this PPT design is completely editable. Download it and make adjustments in color, background, font etc. as per your unique business setting.
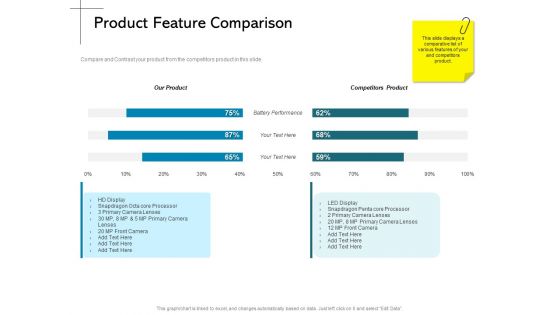
New Product Introduction In The Market Product Feature Comparison Ppt PowerPoint Presentation Summary Background Image PDF
Presenting this set of slides with name new product introduction in the market product feature comparison ppt powerpoint presentation summary background image pdf. The topics discussed in these slides are our product, competitors product, battery performance. This is a completely editable PowerPoint presentation and is available for immediate download. Download now and impress your audience.

 Home
Home