Methodology

Transforming Manufacturing With Automation Managing Cyber Security 90 Days Plan Diagrams PDF
This slide depicts the next 90 days of managing cyber security in the manufacturing operations plan. It includes metric names, items to be measured, measurement method, time, and teams who are responsible and details. This Transforming Manufacturing With Automation Managing Cyber Security 90 Days Plan Diagrams PDF is perfect for any presentation, be it in front of clients or colleagues. It is a versatile and stylish solution for organizing your meetings. The Transforming Manufacturing With Automation Managing Cyber Security 90 Days Plan Diagrams PDF features a modern design for your presentation meetings. The adjustable and customizable slides provide unlimited possibilities for acing up your presentation. Slidegeeks has done all the homework before launching the product for you. So, do not wait, grab the presentation templates today
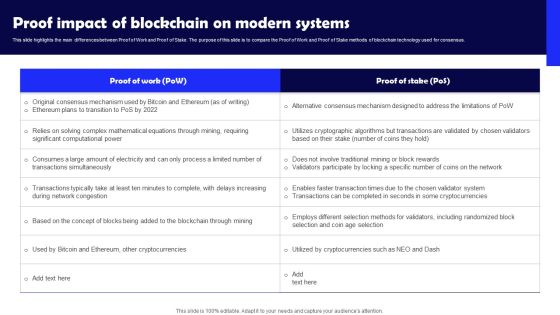
Proof Impact Of Blockchain On Modern Systems Background PDF
This slide highlights the main differences between Proof of Work and Proof of Stake. The purpose of this slide is to compare the Proof of Work and Proof of Stake methods of blockchain technology used for consensus. Do you have an important presentation coming up Are you looking for something that will make your presentation stand out from the rest Look no further than Proof Impact Of Blockchain On Modern Systems Background PDF. With our professional designs, you can trust that your presentation will pop and make delivering it a smooth process. And with Slidegeeks, you can trust that your presentation will be unique and memorable. So why wait Grab Proof Impact Of Blockchain On Modern Systems Background PDF today and make your presentation stand out from the rest

Implementation Cost For Operating Alibaba Cloud Software Download PDF
This slide showcases implement cost of Alibaba clouds. This includes billing method, billable item, instance type, unit prize and remarks. This shows unit price for Chinese and region and USA regions. Presenting this PowerPoint presentation, titled Implementation Cost For Operating Alibaba Cloud Software Download PDF, with topics curated by our researchers after extensive research. This editable presentation is available for immediate download and provides attractive features when used. Download now and captivate your audience. Presenting this Implementation Cost For Operating Alibaba Cloud Software Download PDF. Our researchers have carefully researched and created these slides with all aspects taken into consideration. This is a completely customizable Implementation Cost For Operating Alibaba Cloud Software Download PDF that is available for immediate downloading. Download now and make an impact on your audience. Highlight the attractive features available with our PPTs.

Differences Between Conventional Bank And Islamic Bank Leasing Rules PDF
This slide covers the details related to the differences between Islamic and conventional banking based on financial instruments. It includes information related to leasing or ijarah, which is a method of paying for the use of an asset over a specified period. The Differences Between Conventional Bank And Islamic Bank Leasing Rules PDF is a compilation of the most recent design trends as a series of slides. It is suitable for any subject or industry presentation, containing attractive visuals and photo spots for businesses to clearly express their messages. This template contains a variety of slides for the user to input data, such as structures to contrast two elements, bullet points, and slides for written information. Slidegeeks is prepared to create an impression.

Bar Graph For Business Growth Powerpoint Templates
This PowerPoint slide contains graphics bar chart. This slide helps to exhibit business growth analysis. Sparkling thoughts are swirling around in your head. Filter them through with this diagram slide.

PowerPoint Design Global Slides Business Value Chain Ppt Presentation
PowerPoint Design Global Slides Business Value Chain PPT Presentation- By using this value chain diagram you can visualize events and the analysis of risks and uncertainties can be significantly explained. -PowerPoint Design Global Slides Business Value Chain PPT Presentation
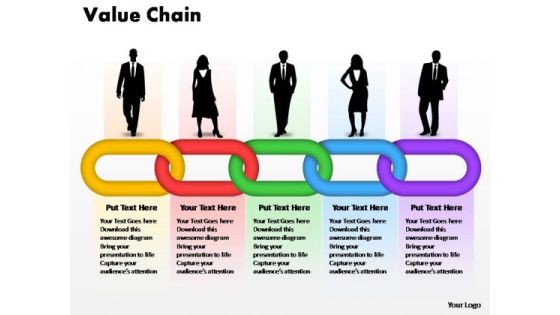
PowerPoint Layouts Global Business Value Chain Ppt Backgrounds
PowerPoint Layouts Global Business Value Chain PPT Backgrounds- By using this value chain diagram you can visualize events and the analysis of risks and uncertainties can be significantly explained. -PowerPoint Layouts Global Business Value Chain PPT Backgrounds
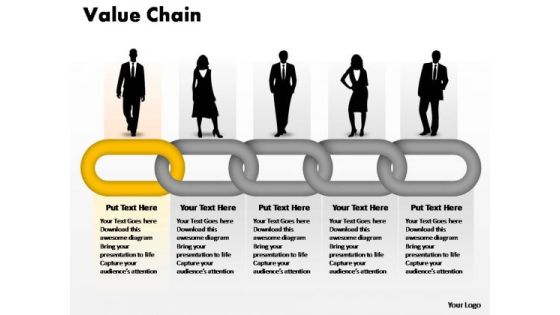
PowerPoint Presentation Chart Designs Business Value Chain Ppt Slide
PowerPoint Presentation Chart Designs Business Value Chain PPT Slide- By using this value chain diagram you can visualize events and the analysis of risks and uncertainties can be significantly explained. -PowerPoint Presentation Chart Designs Business Value Chain PPT Slide

Show Your Skills For Success PowerPoint Templates Ppt Backgrounds For Slides 0613
Light The Fuse With Our Gear wheels Powerpoint Templates. Blast The Audience With The Force Of Your Ideas. In Depth Analysis Of Situations Is Your Forte. Use Our People Powerpoint Templates To Acquaint Your Listeners With Your Results.

Take The Right Pills For Disease PowerPoint Templates Ppt Backgrounds For Slides 0613
Light The Fuse With Our Medical Powerpoint Templates. Blast The Audience With The Force Of Your Ideas. In Depth Analysis Of Situations Is Your Forte. Use Our Business Powerpoint Templates To Acquaint Your Listeners With Your Results.

Stock Photo Black Brown Pie Chart For Business Result PowerPoint Slide
This high quality image is designed with pie chart. Use this image to make business reports. Use this outstanding image in presentations relating to data analysis and reports. Go ahead and add charm to your presentations.
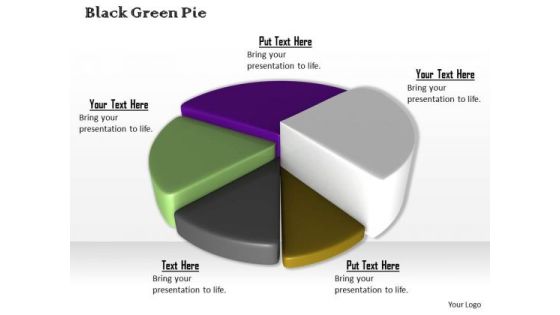
Stock Photo Colorful 3d Pie Chart For Business Result PowerPoint Slide
This high quality image is designed with pie chart. Use this image to make business reports. Use this outstanding image in presentations relating to data analysis and reports. Go ahead and add charm to your presentations.

Business Diagram Percentage Pie Chart On Computer Tablet Presentation Slide Template
This business diagram power point template has been designed with graphic of pie chart. This pie chart contains the various percentage values for business result analysis. Use this pie chart for your business result display related presentations.
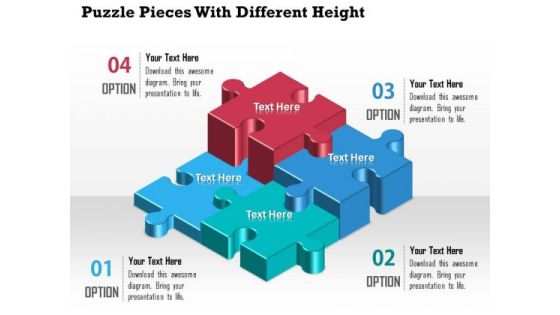
Business Diagram Puzzle Pieces With Different Height Presentation Template
A professional bar graph has been crafted with graphic of puzzles. All these puzzles are in different heights which shows the various levels of any data result representations. Use this diagram for your business result and data analysis related topics.
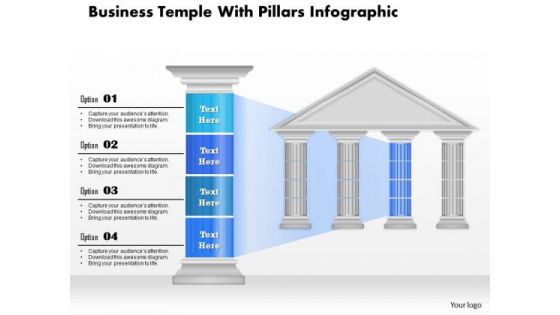
Business Diagram Business Temple With Pillars Infographic Presentation Template
This business power point template has been designed with business temple graphic. This image slide contains the concept of marketing strategies and business plan analysis. Highlight your business plans in any presentations with this exclusive temple design.

Business Diagram Business Temple With Text Blue Pillar Presentation Template
This business plan power point template has been designed with business temple graphic. This image slide contains the concept of marketing strategies and business plan analysis. Highlight your plans in any business presentations with this unique design.
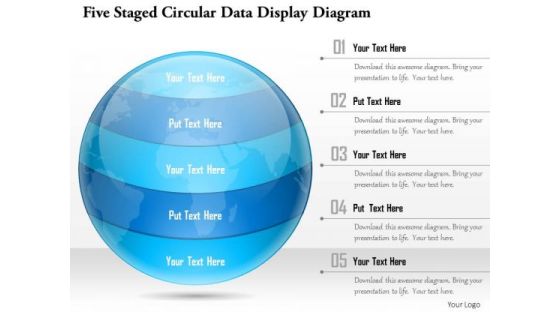
Business Diagram Five Staged Circular Data Display Diagram Presentation Template
This Power Point template slide has been crafted with graphic of five staged circular diagram. This PPT slide contains the concept of data analysis and representation. This PPT slide can be used for business data presentations.
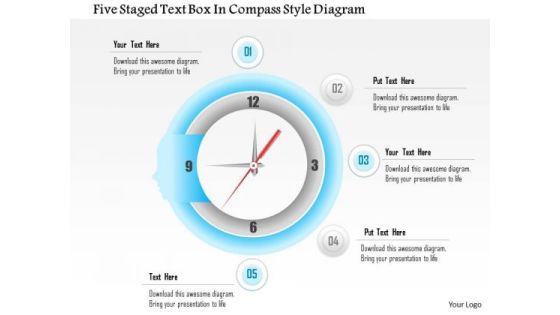
Business Diagram Five Staged Text Box In Compass Style Diagram Presentation Template
This Power Point template slide has been designed with graphic of five staged text boxes. This PPT slide contains the compass style diagram. This PPT slide can display data analysis. Use this PPT slide for your business presentations.

Business Diagram Four Staged Business Text Boxes For Data Representation Presentation Template
Four staged business text boxes are used to design this Power Point template slide. This PPT slide contains the concept of data representation. Use this PPT slide for your business and sales data analysis related topics in any presentation.
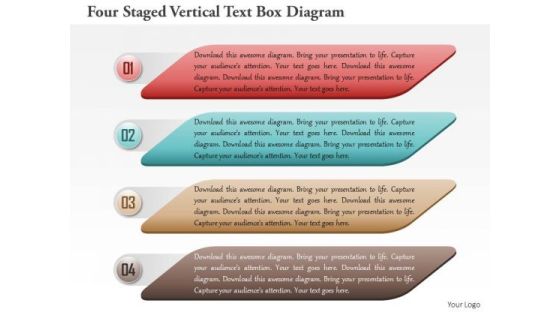
Business Diagram Four Staged Vertical Text Box Diagram Presentation Template
This PPT slide contains the concept of business data analysis. This Power Point template slide has been designed with graphic of four staged vertical text boxes diagram. Use this PPT slide and build an innovative presentation for your viewers.
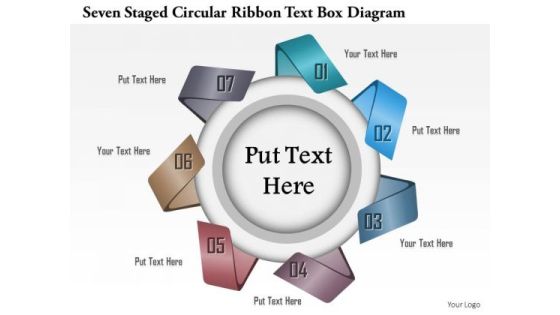
Business Diagram Seven Staged Circular Ribbon Text Box Diagram Presentation Template
This Power Point template slide has been used to display the concept of business data analysis. This PPT slide contains the graphic of seven staged circular ribbon style text boxes. Use this PPT slide for your business presentations.

Business Diagram Six Pie Charts For Result Representation And Percentage Presentation Template
Display the concept of result analysis in your business presentation. This PPT slide contains the graphic of six pie charts. Use this PPT slide for your business and marketing data related presentations.
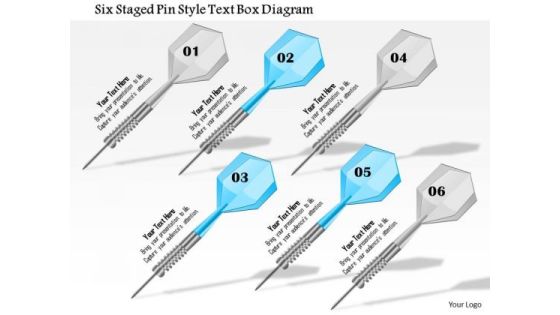
Business Diagram Six Staged Pin Style Text Box Diagram Presentation Template
This Power Point template slide has been crafted with graphic of six staged pin style text boxes. This PPT slide contain the concept of sales data analysis. Use this PPT slide for your business and sales related presentations.
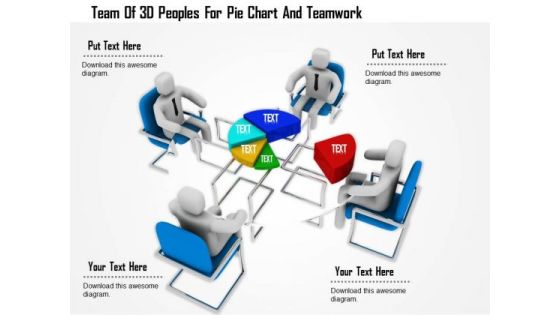
Team Of 3d Peoples For Pie Chart And Teamwork
This Power Point template has been designed with graphic of 3d team forming a pie chart. In this slide team is displaying data analysis. Use this editable slide to build innovative presentation for your viewers.

Team With Bar Graph And Teamwork
This Power Point template has been designed with graphic of 3d team forming a pie chart. In this slide team is displaying data analysis and comparison. Use this editable slide to build innovative presentation for your viewers.

Stock Photo Golden Dollar Symbol With Pie Graph PowerPoint Slide
This Power Point template has been crafted with graphic of golden dollar symbol and pie chart on a tablet. Display the concept of financial data analysis with this image. Use this image to present financial reports in business presentations.

Business Diagram Eight Staged Circular Puzzle Bar Graph Presentation Template
This Power Point template has been crafted with graphic of eight staged circular puzzle and bar graph. This PPT contains the financial result analysis related concept. Use this PPT for your business and success related presentations.
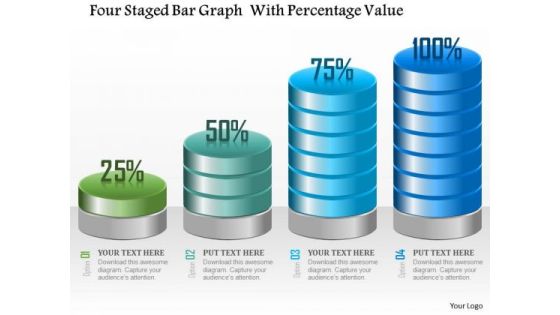
Business Diagram Four Staged Bar Graph With Percentage Value Presentation Template
Four staged bar graph with percentage value has been used to craft this power point template. This PPT contains the concept of making financial timeline and result analysis. This PPT can be used for business and finance related presentations.

Stock Photo Bar Graph With Cubes For Financial Data PowerPoint Slide
Graphic of bar graph and cubes are used to decorate this image template. This PPT contains the concept of financial data analysis. Use this PPT for finance and business related presentations.

Business Diagram 3d Venn Diagram For Global Business Project Presentation Template
This business diagram displays 3d Venn diagram. This editable slide is suitable to present business reports. Use this diagram for business and finance related topics and display complete data analysis in your presentation.
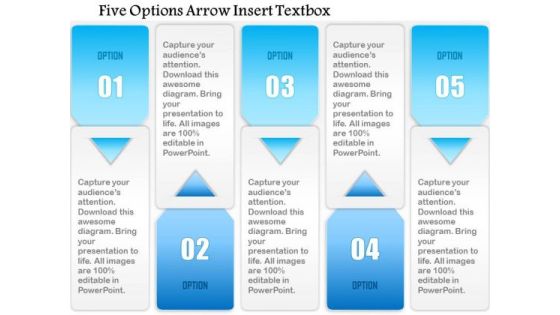
Business Diagram Five Options Arrow Insert Textbox Presentation Template
This PowerPoint template displays textbox diagram. This business diagram contains five points textboxes. Use this diagram, in your presentations to display timeline, strategy, icons and business analysis. Create professional presentations using this professional slide.

Business Diagram Big Data Big Insight From Data Feeds To Explain The Benefits Ppt Slide
Explain the benefits of big data analysis and data feeds with this technology diagram. This slide contains the graphic of scale with big data and big insight. Use this slide your data information and measurement related presentations.
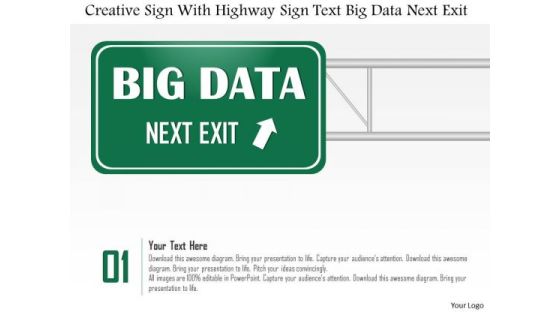
Business Diagram Creative Sign With Highway Sign Text Big Data Next Exit Ppt Slide
This diagram has been designed with graphic of magnifier and text boxes. These boxes are used to display creative sign and highway sign for big data analysis. This diagram can be used for data related topics in any presentation.

Business Diagram Data Warehouse Model With Analytics And Business Intelligence Ppt Slide
This technology diagram has been designed with graphic of data warehouse model. This model depicts concept of business intelligence and analysis. Download this editable slide build an exclusive presentation.

Business Diagram Exponentially Growing Big Data With Icons Surrounding Cloud Ppt Slide
This slide contains the graphic of clouds and icons. This diagram has been designed with concept of big data growth. This diagram displays the exponential growth of data analysis. Use this diagram slide for your data technology related presentations.
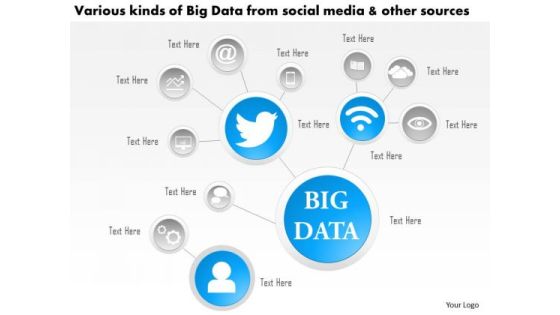
Business Diagram Various Kinds Of Big Data From Social Media And Other Sources Ppt Slide
This technology diagram contains the concept of big data analysis. This slide depicts various kinds of social media and other sources. Use this diagram for mobile and communication related presentations.

3d Man On The Top Of Puzzle Bar Graph
This PPT has been designed with graphic of 3d man and puzzle are graph. This PPT displays the concept of result analysis and financial growth. Use this PPT for your business and finance related presentations.
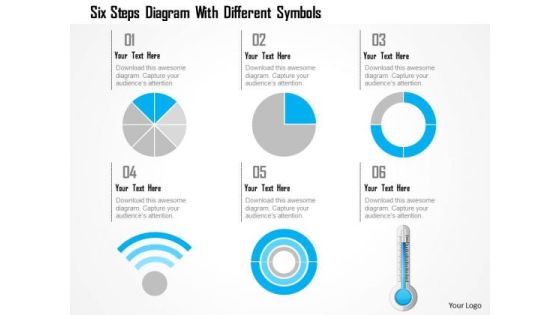
Business Diagram Six Steps Diagram With Different Symbols Presentation Template
This power point template has been crafted with graphic of 3d pie charts with Wi-Fi symbol and thermometer. This PPT contains the concept of calculation and result analysis. Use this PPT for your business and science related presentations.

Business Diagram Global Data Globe With Educational Components Presentation Template
This business diagram has been designed with graphic of globe with icons. Use our diagram slide to organize data and to display data analysis. This diagram is suitable for global business and marketing related presentations.
Business Diagram Globe With Colorful Arrows And Icons Presentation Template
This business diagram has been designed with graphic of globe with arrow and icons. Use our diagram slide to organize data and to display data analysis. This diagram is suitable for global business and marketing related presentations.
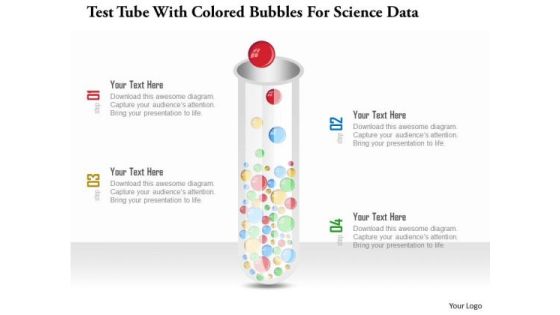
Business Diagram Test Tube With Colored Bubbles For Science Data Presentation Template
Test tubes with colored bubbles are used to design this power point template slide. This PPt slide contains the concept of science data analysis. Use this PPT slide for your business and science related presentations.
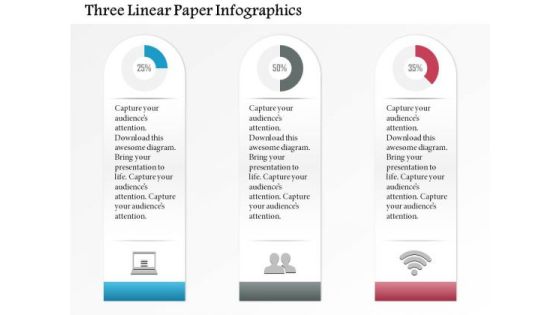
Business Diagram Three Linear Paper Infographics Presentation Template
Three linear paper info graphics has been used to design this power point template slide. This PPT slide contains the concept of data analysis and business data flow. Use this PPT slide for your business and marketing related presentations.

Business Diagram Circular Diagram For Company Vision Presentation Template
This power point template diagram has been crafted with three staged Venn diagram. This PPT contains the concept of future vision and analysis. Use this PPT for your business presentations.

Business Diagram Thermometer Graphics Indicating Progress Presentation Template
This power point template diagram has been designed with graphic of thermometer and bar graph. This PPT contains the concept of growth analysis. Use this PPT for business and marketing related presentations.

Business Diagram Colorful Infographics For Data Representation Presentation Template
This power point template diagram has been crafted with graphic of colorful info graphics. This PPT diagram contains the concept of analysis and data representations. Use this PPT for marketing and business related presentations.

Business Diagram Globe Bar Graph And Bulb For International Business Diagram Presentation Template
Graphic of globe and bar graph with bulb has been used to craft this power point template diagram. This PPT diagram contains the concept of international business growth analysis. Use this PPT for global business and sales related presentations.

Business Diagram Thumb In Vertical Order With App Graphics Presentation Template
This power point template diagram has been crafted with graphic of thumb in vertical order and apps. This PPT diagram contains the concept of application analysis. Use this PPT for business presentation and get good remarks.

Business Diagram Business People Over Bar Chart PowerPoint Template
This Power Point template has been designed with graphic of business people and bar chart. This PPT contains the concept of result analysis and business data display. Use this PPT slide for your business and marketing related presentations.

Business Diagram Footprints For Marketing Positioning Presentation Template
Our above business slide displays graphics of foot prints. Download this diagram to exhibit marketing steps plan and analysis. Grab the attention of your listeners with this professional slide.
Business Diagram Six Icons For Communication Presentation Template
Our above business diagram has been designed with six business icons. You may present market analysis using this diagram. Pressure cooks your views with this diagram. You will hear whistles of appreciation.
Business Diagram Business Man With Puzzles Icon Presentation Template
Graphic of business man with puzzles icons has been used to design this power point template. This diagram slide helps to portray concept like business strategy and analysis. Use this diagram to organize your thoughts and ideas.

Business Diagram Line Graph For Dollar Growth Presentation Template
Graphic of dollar symbol and growth arrow has been used to design this power point template. This diagram contains the concept of financial result analysis. Use this business diagram for finance related presentations

Business Diagram Paper Clips Circular Chart Presentation Template
This power point template has been designed with graphic of circular chart made with paper clips. These business icons are used to display the concept of business result analysis and meeting. Use this diagram for business and marketing presentations.

Business Diagram Creative Graph For Business Reports Presentation Template
Download this diagram to display planning and analysis concepts. This business diagram contains the graphic of creative graph for business reports. Use this template to highlight the key issues of your presentation.
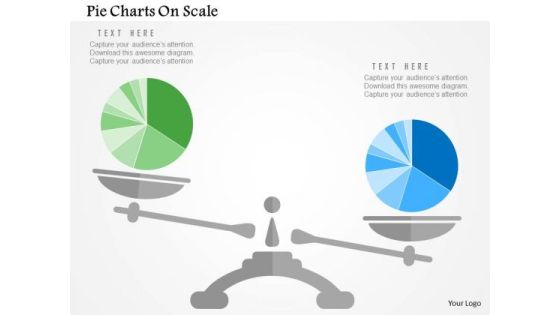
Business Diagram Pie Charts On Scale Presentation Template
Our above slide display graphics of pie chart on a scale. Download this diagram slide to display competitive analysis of business. Adjust the above diagram in your business presentations to visually support your content.

3d Happy Person With Dollars PowerPoint Templates
Concept of financial growth analysis with happiness has been defined in this PowerPoint template. This diagram slide contains the graphic of 3d man standing over the currency. Use this image for business and finance related topics in any presentation.

3d People On Pie Chart PowerPoint Templates
This power point diagram has been crafted with graphic of 3d team members on pie chart. This 3d diagram contains the concept of team management and result analysis. Use this diagram to create an impact on your viewers.
Business Diagram Icons And Charts For Business Growth Presentation Template
Our above slide contains graphics of business charts and icons. It helps to display business reports and analysis. Use this diagram to impart more clarity to data and to create more sound impact on viewers.
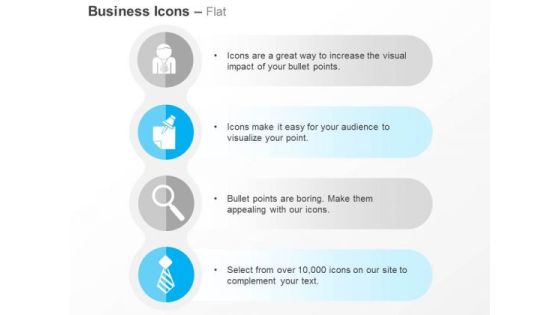
Business Man Post It Notes Magnifier Tie Ppt Slides Graphics
This PPT slide displays icons of business man, post it notes and magnifier. This PPT helps to depict search and analysis of business information. This icon slide is innovatively designed to highlight your worthy views

Time Management Target Goal Bar Graph Ppt Slides Graphics
This power point template has been crafted with icons of time management, target, goal and bar graph. This icon slide can be used for business analysis and time planning. Build an innovative presentation with all these professional icons.

Three Graphs For Business PowerPoint Template
Adjust the above image into your Presentations to visually support your content. This slide has been professionally designed to exhibit business analysis. This template offers an excellent background to build impressive presentation.
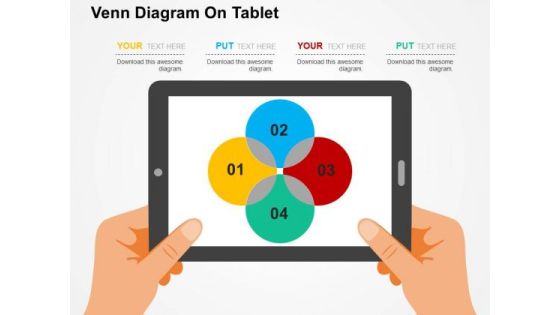
Venn Diagram On Tablet PowerPoint Template
Adjust the above image into your Presentations to visually support your content. This slide has been professionally designed with Venn diagram. This template offers an excellent background to display financial analysis.

Step By Step Planning Infographics PowerPoint Templates
The above slide displays five text boxes with icons. This template has been designed to present market plan and analysis. Imprint your concepts with this PPT slide in your presentations.

Money Bags With Euro Growth Arrow PowerPoint Templates
The above PPT slide contains graphics of money bag with Euro growth graph. This professionally designed slide may be used to depict financial growth analysis. This slide will help your viewers automatically empathize with your thoughts
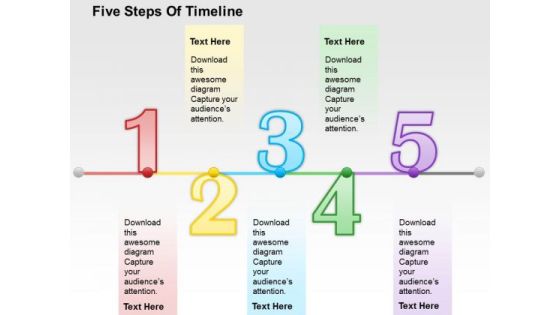
Five Steps Of Timeline PowerPoint Template
This business slide has been designed with graphics of business timeline. You may download this diagram to display timeline, planning and business analysis. Download this diagram slide to make impressive presentations.
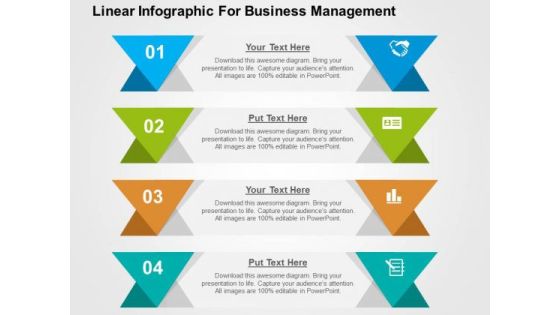
Linear Infographic For Business Management PowerPoint Template
Graphic of tags in linear flow has been used to design this business diagram. This diagram slide may be used to depict business steps in linear flow. Download this diagram for business research and analysis.
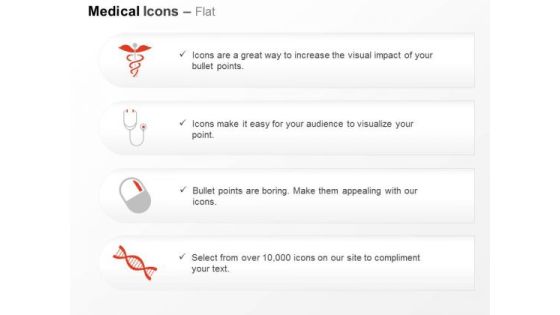
Medical Symbol Stethoscope Pill Dna Design Ppt Slides Graphics
Icons of medical symbol, stethoscope and pill with DNA have been displayed in this power point template. This icon slide relates to the concept of medical analysis and treatment. This slide is suitable for medical students and doctors.

Battery Icons For Business Growth Levels Powerpoint Template
Levels of business growth can be displayed with this diagram. This PowerPoint template contains graphics of seven battery icons. You can use this design for data analysis in business presentations
Five Options Bar Graph With Icons Powerpoint Template
This PowerPoint slide has been designed with five options bar graph and icons. This slide of bar graph is suitable for statistical analysis. This professional slide helps in making an instant impact on viewers.

Dashboard To Impact The Performance Powerpoint Slides
This PowerPoint template graphics of meter chart. Download this PPT chart for business performance analysis. This PowerPoint slide is of great help in the business sector to make realistic presentations and provides effective way of presenting your newer thoughts.
Thumbs Up Text Tags With Finance Icons Powerpoint Template
Emphatically define your message with our above template containing thumbs up text tags with icons. This slide signifies business planning and analysis. Adjust the above diagram into your Presentations to visually support your contents.

Chart Of Four Business Steps Powerpoint Templates
This business diagram displays flow of four business steps. This editable slide is suitable to present growth management. Use this diagram for business and finance related topics and display complete data analysis in your presentation.

Circles With Percentage Values Powerpoint Templates
This PowerPoint template displays circles with percentage values. This business diagram is suitable for financial data analysis. Use this business diagram slide to highlight the key issues of your presentation.
Five Circular Steps With Business Icons Powerpoint Templates
This business diagram has been designed with circular graphics with business icons. This slide suitable for business analysis and strategy presentation. Use this diagram to present your views in a wonderful manner.

Pie Chart Infographic Diagram Powerpoint Templates
This Power Point template has been designed with pie chart infographic. This business slide is useful to present financial ratio analysis. Use this diagram to make business presentation. Illustrate these thoughts with this slide.

Flower Diagram For Educational Training Powerpoint Template
Colorful flowers have been used to design this PowerPoint diagram. This colorful PPT slide may be used for educational training. You can use this design for data analysis in business presentations

Illustration Of Pencil Infographic Powerpoint Templates
The above PowerPoint template displays a pencil Infographic diagram. This PPT slide may be used to display target planning and analysis. Grab center stage with this slide and capture the attention of your audience.

Puzzle Pie Circular Infographic Diagram Powerpoint Templates
Our above PPT slide display puzzle pie circular Infographic. Download this diagram slide to display strategy and analysis. Adjust the above diagram in your business presentations to visually support your content.

Circular Arrows Flow Diagram Powerpoint Template
This power point template has been designed with graphics of circular arrow flow diagram. This PPT diagram may be used to display marketing analysis. Use this PPT diagram for business presentations.

Circular Infographics Puzzle Diagram With Icons Powerpoint Template
This power point template has been designed with circular infographic puzzle diagram. This PPT diagram may be used to display marketing analysis. Use this PPT diagram for business presentations.
Rocket With Three Staged Icons Powerpoint Template
Growth analysis for business can be defined with this business diagram. This slide depicts rocket with three staged icons. Present your views using this innovative slide and be assured of leaving a lasting impression
Three Staged Square Step Diagram And Icons Powerpoint Template
Graphic square step with icons has been used to design this business diagram. This diagram slide may be used to depict order of business steps. Download this diagram for business research and analysis.

Pie Chart With Global Team Powerpoint Template
This PowerPoint template has been designed with graphics of pie chart with global team. This diagram can be used to display team performance and analysis. Capture the attention of your audience with this slide.

Semicircle With Five Circles Of Percentage Values Powerpoint Template
This PowerPoint template has been designed with graphics of semicircle with five percentage values. This business design can be used for financial ratio analysis. Capture the attention of your audience with this slide.
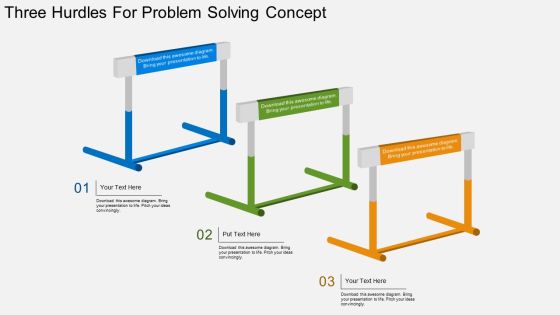
Three Hurdles For Problem Solving Concept Powerpoint Template
This PowerPoint template has been designed with graphics of three hurdles. This PPT slide is best to describe business strategy analysis. You can provide a fantastic explanation of the topic with this slide.
Three Sections In Cube With Icons Powerpoint Template
Our above PowerPoint template has been designed with graphics of cube with icons. This PPT slide is designed for business strategy analysis. Add this diagram in your presentations to visually support your content.
Four Staged Text Box And Icons Powerpoint Template
Our above PPT slide displays graphics of four text boxes with icons. This diagram may be used for concepts like business planning and analysis. Download this template to leave permanent impression on your audience.
Five Hexagons With Business Icons Powerpoint Templates
This PowerPoint template contains graphics of hexagons with business icons. This layout helps you to portray concepts teamwork, idea sharing and business analysis. Streamline the flow of information across the board using this diagram.

Circular Arrows Infographic For Marketing Research Powerpoint Template
This PPT slide has been designed with circular arrows infographic diagram. This business diagram is suitable for marketing research and analysis. This professional slide helps in making an instant impact on viewers.
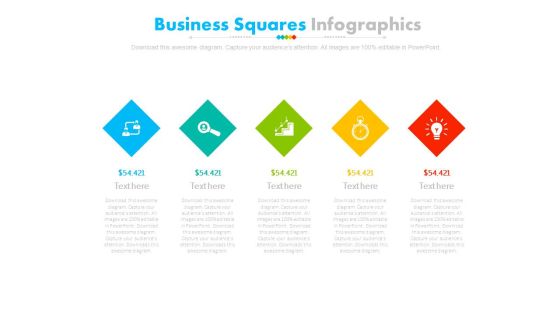
Five Steps Diamond Infographic Diagram Powerpoint Slides
This PowerPoint template has been designed with alphabet steps with icons. This PPT slide may be used to display financial strategy analysis. Make outstanding business presentation with this template.
Test Tubes With Financial Data In Percentage Ratio Powerpoint Slides
This PowerPoint template contains graphics of test tubes with percentage values. You may download this PPT slide design to display financial ratio analysis. You can easily customize this template to make it more unique as per your need.
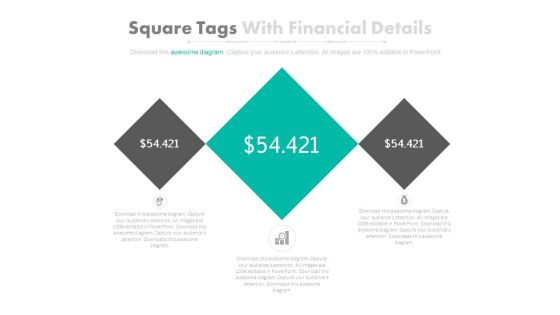
Three Square Tags With Dollars Value Powerpoint Slides
This PowerPoint template contains three square tags with dollar value. You may download this PPT slide design to display financial analysis. You can easily customize this template to make it more unique as per your need.

Tablet With Bar Graph And Pie Chart Powerpoint Templates
This business slide has been designed with business graphs on computer tablet. You may download this PPT slide to display statistical analysis. This slide will help you to sequence your thoughts.

DNA Design Infographics For Research Powerpoint Slides
This business slide contains four DNA infographic structure. This diagram is suitable to present business research and analysis. Visual effect of this diagram helps in maintaining the flow of the discussion and provides more clarity to the subject.

Four Tags With Magnifier For Solution Powerpoint Slides
Visually support your presentation with our above template showing graphics of magnifier with text tags. This PPT slide has been professionally designed to present market research and analysis. This template offers an excellent background to build impressive presentation.

Diagram Of 10 Options Infographic Powerpoint Templates
Flowchart of 10 business options has been displayed in this business slide. This business diagram helps to exhibit concepts of strategy, planning, communication, management and analysis. Use this diagram to build an exclusive presentation.
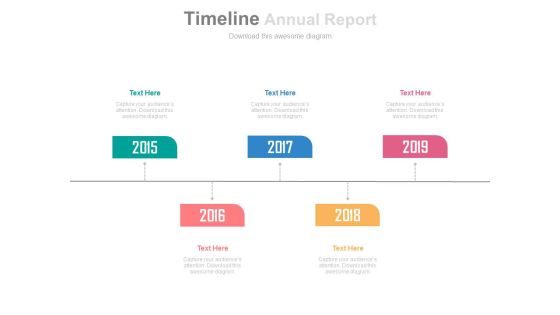
Five Staged Annual Report With Year Based Tags Powerpoint Slides
This PowerPoint timeline slide design can be used to display yearly business report. This timeline template can be used in presentations where you need to display a roadmap or it may be used for business target analysis.
Tablet With Icons And Apps Powerpoint Templates
This power point template has been designed with SWOT analysis infographic. This business diagram can be used to present opportunity, weakness, strength and Threats. Use this diagram to make your presentations more effective.
Three Arrows With Icons Powerpoint Templates
This business diagram displays graphic of three arrows with icons. This power point template contains the concept of business analysis and research. Use this diagram to build unique presentation for your viewers.

Three Options Text Arrow Boxes Powerpoint Templates
This business diagram displays graphic of arrows with icons. This power point template contains the concept of business analysis and research. Use this diagram to build unique presentation for your viewers.
Hexagons With Seven Business Icons Powerpoint Templates
Hexagonal layout with business icons has been displayed in this business slide. This business diagram helps to exhibit concepts of strategy, planning, communication, management and analysis. Use this diagram to build an exclusive presentation.

Six Hexagons For Business Information Display Powerpoint Templates
Hexagonal layout with business icons has been displayed in this business slide. This business diagram helps to exhibit concepts of strategy, planning, communication, management and analysis. Use this diagram to build an exclusive presentation.

Bar Graph For Marketing Research Data Powerpoint Slides
This PowerPoint template has been designed with diagram of bar graph. This PPT slide can be used to prepare presentations for profit growth report and also for financial data analysis. You can download finance PowerPoint template to prepare awesome presentations.

Circle Diagram For Business Marketing Mix Powerpoint Slides
This PowerPoint template has been designed with nine steps circle chart. This PPT slide can be used to prepare presentations for profit growth report and also for financial data analysis. You can download finance PowerPoint template to prepare awesome presentations.
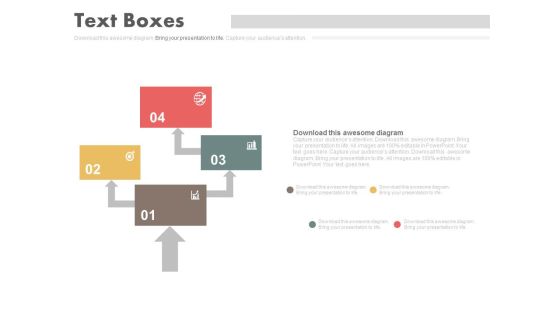
Four Steps Arrow Chart Design Powerpoint Slides
This PowerPoint template has been designed with four steps arrow chart. This PPT slide can be used to prepare presentations for marketing reports and also for financial data analysis. You can download finance PowerPoint template to prepare awesome presentations.

Pyramid For Financial Accounting Information Powerpoint Slides
This PowerPoint template has been designed with graphics of pyramid chart. This PPT slide can be used to prepare presentations for profit growth report and also for financial data analysis. You can download finance PowerPoint template to prepare awesome presentations.

Four Business Option Banner Diagram Powerpoint Template
This business slide contains four option banners with business icons. This PPT diagram is suitable to present concept of profit growth value analysis. Visual effect of this diagram provides more clarity to the subject.

Seven Steps Semicircular Infographic Chart Powerpoint Template
This business slide contains four option banners with business icons. This PPT diagram is suitable to present concept of profit growth value analysis. Visual effect of this diagram provides more clarity to the subject.
Six Circular Arrows With Globe And Icons Powerpoint Template
This power point template contains graphics of six circular arrows with globe and icons. Download this PPT diagram slide to display global business analysis. Make outstanding presentation by using this creative diagram.
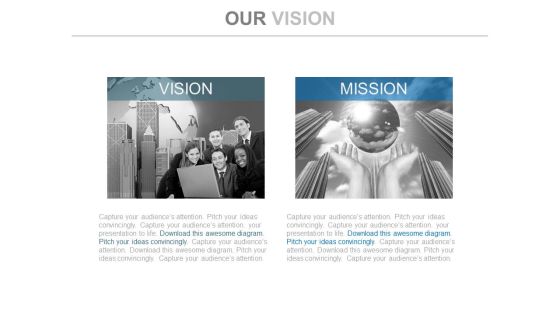
Future Vision And Mission Corporate Layout Powerpoint Slides
This PowerPoint template displays pictures of corporate team member and globe in open sky. You may download this PPT slide to depict corporate vision, mission and strategy analysis. Add this slide to your presentation and impress your superiors.
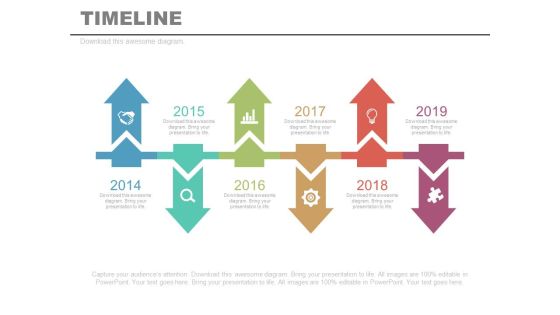
Six Linear Timeline Arrows Year Diagram Powerpoint Slides
This PowerPoint template has been designed with linear timeline steps. This PPT slide may be helpful to display year based business analysis. Download this PowerPoint timeline template to make impressive presentations.

Three Steps Ribbon Diagram For Financial Measurement Powerpoint Slides
This PowerPoint template has been designed with three steps ribbon diagram. This PPT slide may be used to display financial strategy and analysis. Make outstanding business presentation with this template.

Two Table Charts For Business Data Powerpoint Slides
This PowerPoint template contains two tables chart. You may download this PPT slide to display statistical analysis. You can easily customize this template to make it more unique as per your need.
Four Icons Around Target Board For Business Powerpoint Slides
This PPT slide contains graphics of target board with four icons. You may download this PPT slide as tool for marketing target analysis. Impress your audiences by using this PPT slide.

Circular Chart With Icons For Value Chain Powerpoint Template
This PowerPoint template has been designed with circular chart and icons. This professional PPT slide is suitable to present value chain analysis. Capture the attention of your audience using this professional slide.
Pie Chart With Seven Business Icons Powerpoint Templates
Our compelling template consists with a design of pie chart with seven business icons. This slide has been professionally designed to exhibit financial ratio analysis. This template offers an excellent background to build impressive presentation.

Checklist With Financial Planning Icons Powerpoint Slides
This PowerPoint template contains business checklist with icons. Download this diagram slide to display financial planning and analysis. Etch your views in the brains of your audience with this diagram slide.

Cost Comparison Table Chart Powerpoint Slides
Our above PPT slide displays cost comparison table chart. This diagram may be used to display cost comparison and financial analysis. Download this PowerPoint template to leave permanent impression on your audience.

About Company Ceo Skills Profile Powerpoint Slides
This PowerPoint template contains picture of company CEO with performance analysis. You may use this as introduction slide for your presentation. Download this creative template to catch the attention of the people.

About Us With Founder Ceo Photo Powerpoint Slides
This PowerPoint template contains picture of founder CEO with performance analysis. You may use this as introduction slide for your presentation. Download this creative template to catch the attention of the people.

Four Steps Circular Infographic Powerpoint Templates
Our above slide contains diagram of three stage circular infographic. It helps to display global business analysis. Use this diagram to impart more clarity to data and to create more sound impact on viewers.

Hands Demonstrating Profit Value Powerpoint Templates
Our above slide contains diagram of zigzag arrow on monitor. It helps to display growth analysis and management. Use this diagram to impart more clarity to information and to create more sound impact on viewers.

Chart For Employees Performance Measurement Powerpoint Slides
This PowerPoint template has been designed with graphics of compare chart. You may download this diagram slide for analysis of employee performance. Add this slide to your presentation and impress your superiors.

Circle Chart With Man And Woman Ratio Comparison Powerpoint Slides
This PowerPoint template has been designed with graphics of circle chart. You may download this PPT slide to depict man and woman ratio analysis. Add this slide to your presentation and impress your superiors.

Test Tubes With Percentage Data For Comparison Powerpoint Slides
This PowerPoint template has been designed with test tubes and percentage data. You may download this PPT slide to display data comparison and analysis. Add this slide to your presentation and impress your superiors.
Three Text Boxes With Percentage Values And Icons Powerpoint Slides
This PowerPoint template has been designed with text boxes and percentage data. You may download this PPT slide to display data comparison and analysis. Add this slide to your presentation and impress your superiors.
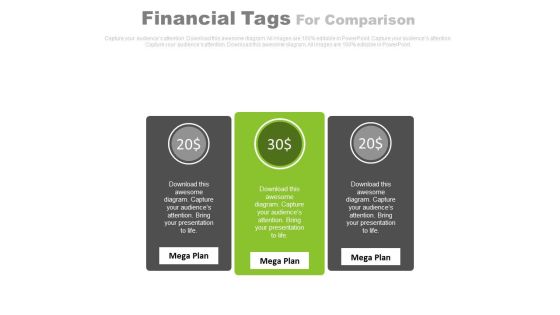
Three Text Tags Compare Chart Powerpoint Slides
This PowerPoint template has been designed with text tags and percentage data. You may download this PPT slide to display data comparison and analysis. Add this slide to your presentation and impress your superiors.
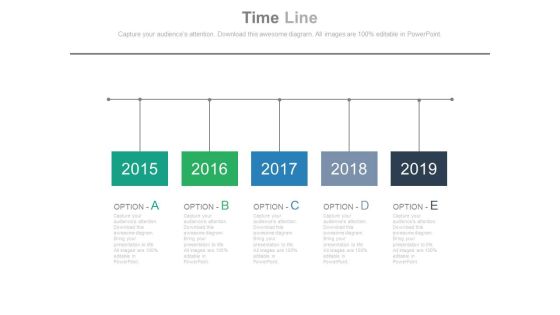
Five Options Timeline Diagram With Years Tags Powerpoint Slides
This PowerPoint template has been designed with five options timeline diagram with years tags. This PPT slide may be helpful to display year based business analysis. Download this PowerPoint timeline template to make impressive presentations.
Five Pointers Timeline Diagram With Icons Powerpoint Slides
This PowerPoint template has been designed with five pointers timeline diagram with icons. This PPT slide may be helpful to display business growth and analysis. Download this PowerPoint timeline template to make impressive presentations.

Five Steps Company Growth Timeline Powerpoint Slides
This PowerPoint timeline slide design can be used to display progress steps. It contains sequential timeline growth steps. This timeline template can be used in presentations where you need to display time planning and analysis.
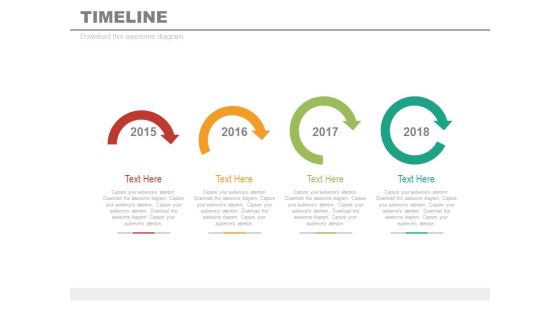
Four Sequential Arrows Timeline Diagram Powerpoint Slides
This PowerPoint timeline template can be used for multiple purposes including vision planning, new milestones and tasks. This PPT slide may be helpful to display timeline steps and year based analysis. Download this PowerPoint timeline template to make impressive presentations.
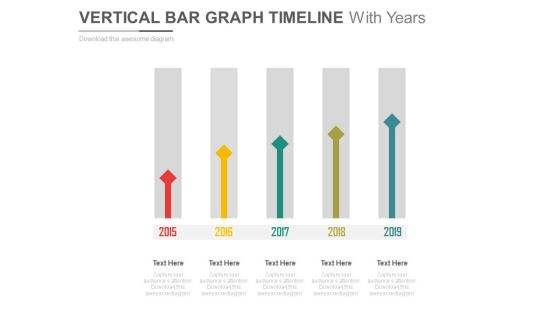
Vertical Arrows Timeline With Years Powerpoint Slides
This PowerPoint template has been designed with sequential arrows timeline diagram. This PPT slide may be helpful to display year based business analysis. Download this PowerPoint timeline template to make impressive presentations.

Year Based Timeline For Sales Planning Powerpoint Slides
This PowerPoint timeline slide design can be used to display progress steps. It contains sequential timeline tags. This timeline template can be used in presentations where you need to display sales planning and analysis.
Year Tags Sequential Timeline With Icons Powerpoint Slides
This PowerPoint timeline slide design can be used to display progress steps. It contains sequential timeline tags. This timeline template can be used in presentations where you need to display sales planning and analysis.
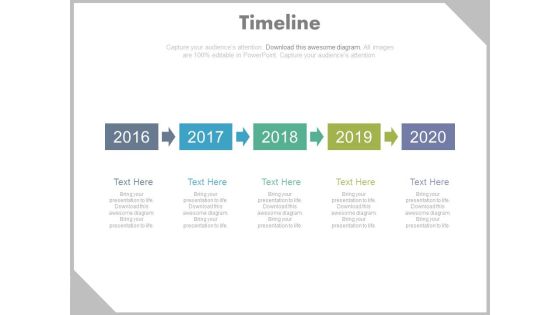
Year Tags Timeline Sequence Diagram Powerpoint Slides
This PowerPoint timeline slide design can be used to display progress steps. It contains sequential timeline tags. This timeline template can be used in presentations where you need to display sales planning and analysis.
Four Circles With Percentage Values And Icons Powerpoint Slides
This PowerPoint template displays info graphic diagram of linear circles. This diagram may be used to exhibit financial growth and analysis. Grab center stage with this slide and capture the attention of your audience.

Percentage Charts For Statistical Comparison Powerpoint Slides
This PowerPoint template has been chart of percentage values. You may download this diagram for statistical comparison and analysis. Add this PPT slide to your presentation and impress your superiors.

Four Options Circle Chart With Percentage Powerpoint Slides
This PowerPoint template has been designed with graphics of four options circle chart. This PowerPoint template may be used to display four steps of financial analysis. Prove the viability of your ideas using this impressive slide.

Four Pyramids With Growth Steps Powerpoint Slides
This business slide has been designed with four pyramids. This PowerPoint template may use to display sales growth and analysis. Prove the viability of your ideas using this impressive slide.
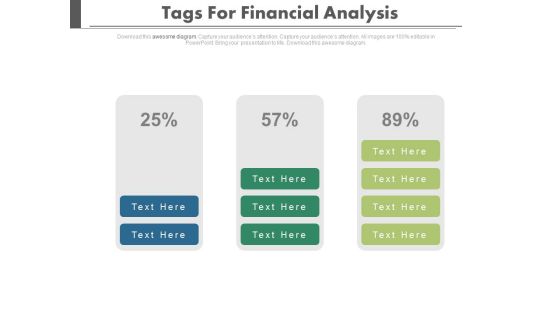
Three Stages Of Financial Growth Powerpoint Slides
Three stages of financial growth have been displayed in this power point template. This diagram helps to portray the concept of financial planning and analysis. Download this template to leave permanent impression on your audience.
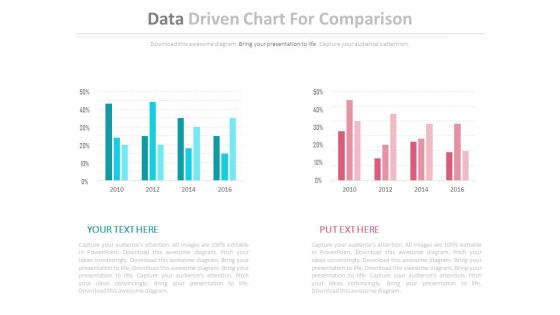
Two Data Driven Comparison Charts Powerpoint Slides
This PowerPoint template contains diagram of two data driven charts. You may use this PPT slide to depict strategic analysis for business. The color coding of this template is specifically designed to highlight you points.
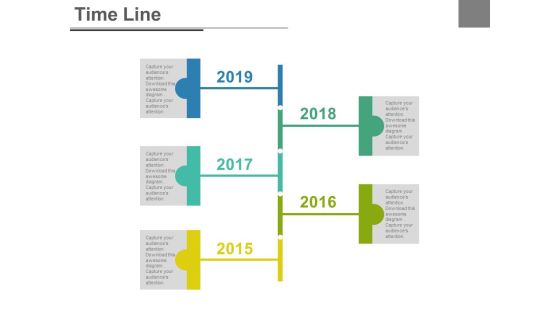
Five Staged Business Timeline Report Powerpoint Slides
This PowerPoint template has been designed with five staged business timeline report diagram. This PPT slide may be helpful to display year based business analysis. Download this PowerPoint timeline template to make impressive presentations.
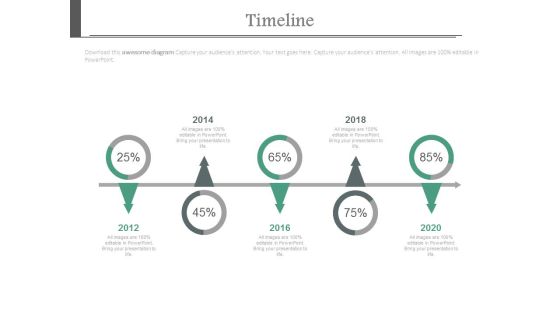
Five Yearly Sequential Timeline With Percentage Values Powerpoint Slides
This PowerPoint timeline slide design can be used to display timeline operations. It contains sequential timeline diagram with percentage values. This timeline template can be used in presentations where you need to display time planning and analysis.
Four Circles With Icons Timeline Design Powerpoint Slides
This PowerPoint timeline template can be used for multiple purposes including vision planning, new milestones and tasks. This PPT slide may be helpful to display timeline steps and year based analysis. Download this PowerPoint timeline template to make impressive presentations.

Three Arrows With Years For Timeline Planning Powerpoint Slides
This PowerPoint template has been designed with three arrows and years. This timeline template may be used to display business planning and analysis. Download this PowerPoint timeline template to make impressive presentations.
Market Trends Chart With Percentage And Icons Powerpoint Slides
This PowerPoint template has been designed with graphics of chart with percentage values and icons. This PowerPoint template may be used to market trends and financial analysis. Prove the viability of your ideas using this impressive slide.

Three Person Tags With Skill Percentage Charts Powerpoint Slides
This PowerPoint template has been designed with three person?s tags with percentage values. This Info graphic diagram may be used to display team skill analysis. Download this impressive diagram to build unique presentations.

Five Years Planning Timeline Chart Powerpoint Slides
This timeline diagram displays five sequential year steps. This PowerPoint template may be used to display when statistical analysis. This timeline design is most useful for showing important milestones and deadlines.

Timeline For Team Business Target Achievement Powerpoint Slides
This PowerPoint template contains circles around business team. It may be used to display analysis of team strategy. Download this PPT slide to demonstrate how you intend to navigate your steps towards the desired corporate goal.
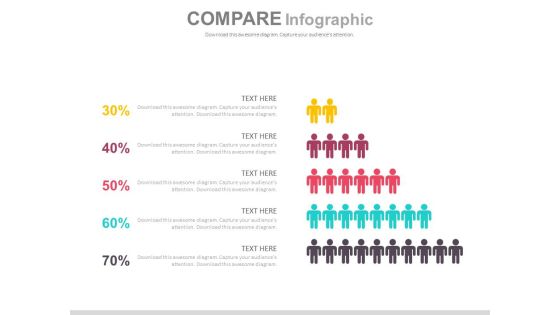
Pyramid Design For Employees Performance Powerpoint Slides
This PPT slide contains graphics of pyramid diagram. Download this PowerPoint template to depict employee?s performance and analysis. Deliver amazing presentations to mesmerize your audience by using this slide design.

Lego Blocks Design For Data Representation Powerpoint Slides
This PowerPoint template has been designed with Lego blocks diagram. You can use this ppt slide for statistical analysis or for data representation. Download this PPT slide to build impressive presentations.
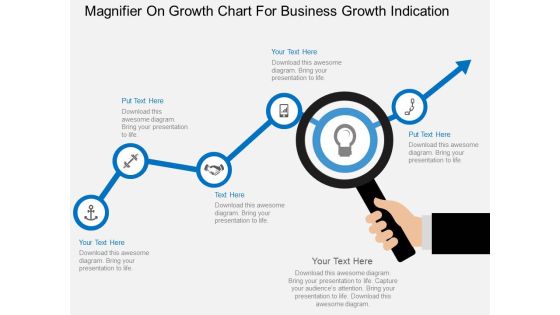
Magnifier On Growth Chart For Business Growth Indication Powerpoint Template
This business slide contains graphics of magnifier on growth chart. This PowerPoint template helps to display business planning and analysis. Use this diagram to impart more clarity to concept and to create more sound impact on viewers.
Four Circles Venn Diagram With Icons Powerpoint Slides
Four circles Venn diagram has been used to design this power point template. This PPT helps to portray the concept of business data analysis. Use this PPT for your business and marketing related presentations.

Four Layered Venn Design For Business Powerpoint Slides
This power point template has been designed with graphic of four layered Venn diagram. Use this Venn diagram for business strategy and analysis. Illustrate your ideas and imprint them in the minds of your team with this template.
Three Overlapping Circles With Business Icons Powerpoint Slides
This power point template has been designed with three overlapping circles and business icons. Use this Venn diagram for business planning and strategy analysis. Illustrate your ideas and imprint them in the minds of your team with this template.
Three Steps Venn Diagram With Icons Powerpoint Slides
This power point template has been designed with graphic of Venn diagram. Use this Venn diagram for business result analysis. Illustrate your ideas and imprint them in the minds of your team with this template.
Two Circles Venn Diagram With Icons Powerpoint Slides
Venn diagram of two circles has been used to design this power point template. This PPT helps to portray the concept of business data analysis. Use this PPT for your business and marketing related presentations.
Two Layered Venn Diagram With Icons Powerpoint Slides
This power point template has been designed with graphic of two layered Venn diagram. Use this Venn diagram for business strategy and analysis. Illustrate your ideas and imprint them in the minds of your team with this template.
Magnifying Glass With Team And Icons Powerpoint Slides
This PPT slide contains graphics of magnifying glass with team and icons. You may use this PowerPoint template team strategy and analysis. Download this team slide design to deliver amazing presentations.

Curve Line Diagram With Icons Powerpoint Template
Our above slide contains diagram of curve line infographic. This infographic slide helps to exhibit business analysis. Use this diagram to impart more clarity to data and to create more sound impact on viewers.
Six Text Boxes With Icons Powerpoint Template
This business slide contains pie chart infographic layout. This diagram is suitable to present business deal and analysis This diagram provides schematic representation of any information and provides more clarity to the subject.

Combo Chart Finance Ppt PowerPoint Presentation Infographic Template Model
This is a combo chart finance ppt powerpoint presentation infographic template model. The topics discussed in this diagram are finance, marketing, management, investment, analysis. This is a completely editable PowerPoint presentation, and is available for immediate download.

Experience Curves Template Business Ppt PowerPoint Presentation Professional Grid
This is a experience curves template business ppt powerpoint presentation professional grid. The topics discussed in this diagram are finance, marketing, management, investment, analysis. This is a completely editable PowerPoint presentation, and is available for immediate download.

Experience Curves Template Management Ppt PowerPoint Presentation Inspiration Clipart
This is a experience curves template management ppt powerpoint presentation inspiration clipart. The topics discussed in this diagram are finance, marketing, management, investment, analysis. This is a completely editable PowerPoint presentation, and is available for immediate download.
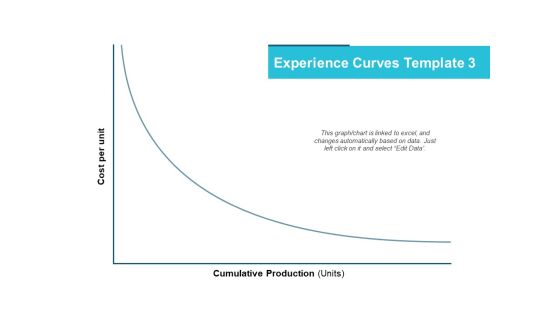
Experience Curves Template Marketing Ppt PowerPoint Presentation Styles Show
This is a experience curves template marketing ppt powerpoint presentation styles show. The topics discussed in this diagram are finance, marketing, management, investment, analysis. This is a completely editable PowerPoint presentation, and is available for immediate download.

Experience Curves Template Planning Business Ppt PowerPoint Presentation Ideas Show
This is a experience curves template planning business ppt powerpoint presentation ideas show. The topics discussed in this diagram are finance, marketing, management, investment, analysis. This is a completely editable PowerPoint presentation, and is available for immediate download.

Experience Curves Template Planning Ppt PowerPoint Presentation File Sample
This is a experience curves template planning ppt powerpoint presentation file sample. The topics discussed in this diagram are finance, marketing, management, investment, analysis. This is a completely editable PowerPoint presentation, and is available for immediate download.

Experience Curves Template Strategy Ppt PowerPoint Presentation Template
This is a experience curves template strategy ppt powerpoint presentation template. The topics discussed in this diagram are finance, marketing, management, investment, analysis. This is a completely editable PowerPoint presentation, and is available for immediate download.

Clustered Column Finance Ppt Powerpoint Presentation Model Objects
This is a clustered column finance ppt powerpoint presentation model objects. The topics discussed in this diagram are finance, marketing, management, investment, analysis. This is a completely editable PowerPoint presentation, and is available for immediate download.

Dashboard Marketing Ppt Powerpoint Presentation Professional Mockup
This is a dashboard marketing ppt powerpoint presentation professional mockup. The topics discussed in this diagram are finance, marketing, management, investment, analysis. This is a completely editable PowerPoint presentation, and is available for immediate download.

Bar Chart Finance Marketing Ppt PowerPoint Presentation Portfolio Pictures
This is a bar chart finance marketing ppt powerpoint presentation portfolio pictures. The topics discussed in this diagram are finance, marketing, management, investment, analysis. This is a completely editable PowerPoint presentation, and is available for immediate download.

Budgeting Planned Actual Comparison Ppt PowerPoint Presentation Icon Design Inspiration
This is a budgeting planned actual comparison ppt powerpoint presentation icon design inspiration. The topics discussed in this diagram are finance, marketing, management, investment, analysis. This is a completely editable PowerPoint presentation, and is available for immediate download.

Combo Chart Management Investment Ppt PowerPoint Presentation Inspiration Maker
This is a combo chart management investment ppt powerpoint presentation inspiration maker. The topics discussed in this diagram are finance, marketing, management, investment, analysis. This is a completely editable PowerPoint presentation, and is available for immediate download.

Cost Performance Index Ppt PowerPoint Presentation Styles Vector
This is a cost performance index ppt powerpoint presentation styles vector. The topics discussed in this diagram are finance, marketing, management, investment, analysis. This is a completely editable PowerPoint presentation, and is available for immediate download.
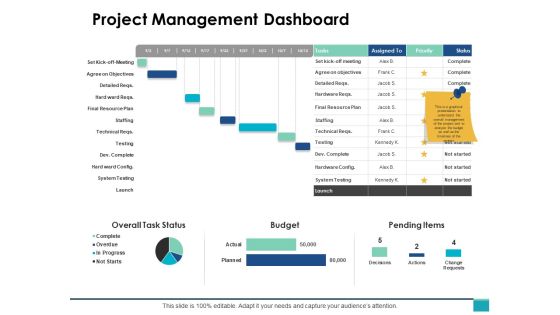
Project Management Dashboard Ppt PowerPoint Presentation Gallery Portrait
This is a project management dashboard ppt powerpoint presentation gallery portrait. The topics discussed in this diagram are finance, marketing, management, investment, analysis. This is a completely editable PowerPoint presentation, and is available for immediate download.
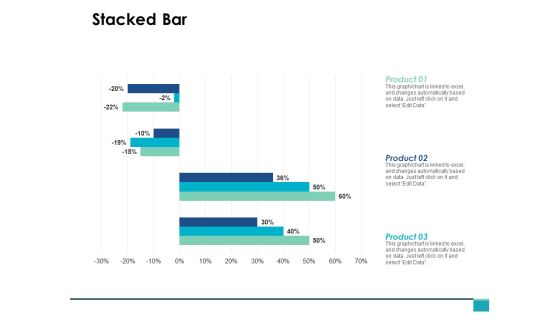
Stacked Bar Management Investment Ppt PowerPoint Presentation Sample
This is a stacked bar management investment ppt powerpoint presentation sample. The topics discussed in this diagram are finance, marketing, management, investment, analysis. This is a completely editable PowerPoint presentation, and is available for immediate download.

Bar Chart Finance Marketing Ppt PowerPoint Presentation Diagram Images
This is a bar chart finance marketing ppt powerpoint presentation diagram images. The topics discussed in this diagram are finance, marketing, management, investment, analysis. This is a completely editable PowerPoint presentation, and is available for immediate download.

Column Chart Investment Ppt PowerPoint Presentation Pictures Inspiration
This is a column chart investment ppt powerpoint presentation pictures inspiration. The topics discussed in this diagram are finance, marketing, management, investment, analysis. This is a completely editable PowerPoint presentation, and is available for immediate download.
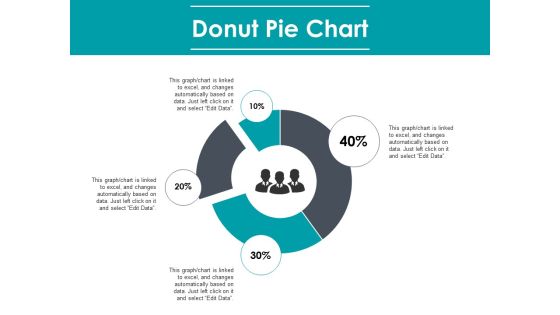
Donut Pie Chart Finance Marketing Ppt PowerPoint Presentation Layouts Ideas
This is a donut pie chart finance marketing ppt powerpoint presentation layouts ideas. The topics discussed in this diagram are finance, marketing, management, investment, analysis. This is a completely editable PowerPoint presentation, and is available for immediate download.
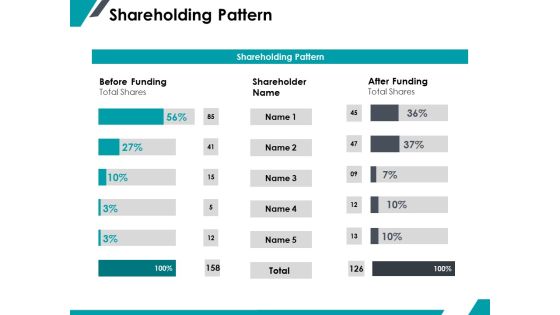
Shareholding Pattern Ppt PowerPoint Presentation Infographic Template Professional
This is a shareholding pattern ppt powerpoint presentation infographic template professional. The topics discussed in this diagram are finance, marketing, management, investment, analysis. This is a completely editable PowerPoint presentation, and is available for immediate download.
 Home
Home