Meter Gauge

Meter Gauge Icon For Energy Consumption Statistics Diagrams PDF
Presenting Meter Gauge Icon For Energy Consumption Statistics Diagrams PDF to dispense important information. This template comprises three stages. It also presents valuable insights into the topics including Meter Gauge, Icon For Energy, Consumption Statistics. This is a completely customizable PowerPoint theme that can be put to use immediately. So, download it and address the topic impactfully.

Meter Gauge Showing Three Levels Of Risk Ppt PowerPoint Presentation Pictures Graphics
This is a meter gauge showing three levels of risk ppt powerpoint presentation pictures graphics. This is a four stage process. The stages in this process are risk meter, risk speedometer, hazard meter.

Business Framework Fuel Gauge Indicator PowerPoint Presentation
This diagram displays framework of fuel gauge indicator. It contains graphic of black meter indicating the fuel gauge. Use this editable diagram for your business and technology related presentations.

Liquid Gauge Symbol Digital Water Digital Reading Control Gauge Ppt PowerPoint Presentation Complete Deck
Presenting this set of slides with name liquid gauge symbol digital water digital reading control gauge ppt powerpoint presentation complete deck. The topics discussed in these slides are digital water, digital reading, control gauge, water meter. This is a completely editable PowerPoint presentation and is available for immediate download. Download now and impress your audience.

Fuel Gauge Industrial PowerPoint Templates And PowerPoint Backgrounds 0311
Microsoft PowerPoint Template and Background with fuel gauge with money amounts
Measurement Gauge Vector Icon Ppt PowerPoint Presentation File Infographics PDF
Presenting this set of slides with name measurement gauge vector icon ppt powerpoint presentation file infographics pdf. This is a three stage process. The stages in this process are measurement gauge vector icon. This is a completely editable PowerPoint presentation and is available for immediate download. Download now and impress your audience.
Sales Team Accomplishment Evaluation With Gauge Icon Introduction PDF
Showcasing this set of slides titled sales team accomplishment evaluation with gauge icon introduction pdf The topics addressed in these templates are sales team accomplishment evaluation with gauge icon All the content presented in this PPT design is completely editable. Download it and make adjustments in color, background, font etc. as per your unique business setting.

Metrics To Gauge The Health Of Sales Pipeline Brochure PDF
This slide shows comparison of sales pipeline metrics Number of deals in sales pipeline, average deal size, win rate etc. of company with the industry average. Deliver and pitch your topic in the best possible manner with this Metrics To Gauge The Health Of Sales Pipeline Brochure PDF. Use them to share invaluable insights on Metrics To Gauge The Health Of Sales Pipeline and impress your audience. This template can be altered and modified as per your expectations. So, grab it now.

Progress Gauge Ppt PowerPoint Presentation Complete Deck With Slides
If designing a presentation takes a lot of your time and resources and you are looking for a better alternative, then this Progress Gauge Ppt PowerPoint Presentation Complete Deck With Slides is the right fit for you. This is a prefabricated set that can help you deliver a great presentation on the topic. All the ten slides included in this sample template can be used to present a birds-eye view of the topic. These slides are also fully editable, giving you enough freedom to add specific details to make this layout more suited to your business setting. Apart from the content, all other elements like color, design, theme are also replaceable and editable. This helps in designing a variety of presentations with a single layout. Not only this, you can use this PPT design in formats like PDF, PNG, and JPG once downloaded. Therefore, without any further ado, download and utilize this sample presentation as per your liking.

Gas Gauge Ppt PowerPoint Presentation Complete With Slides
Boost your confidence and team morale with this well-structured Gas Gauge Ppt PowerPoint Presentation Complete With Slides. This prefabricated set gives a voice to your presentation because of its well-researched content and graphics. Our experts have added all the components very carefully, thus helping you deliver great presentations with a single click. Not only that, it contains a set of eleven slides that are designed using the right visuals, graphics, etc. Various topics can be discussed, and effective brainstorming sessions can be conducted using the wide variety of slides added in this complete deck. Apart from this, our PPT design contains clear instructions to help you restructure your presentations and create multiple variations. The color, format, design anything can be modified as deemed fit by the user. Not only this, it is available for immediate download. So, grab it now.
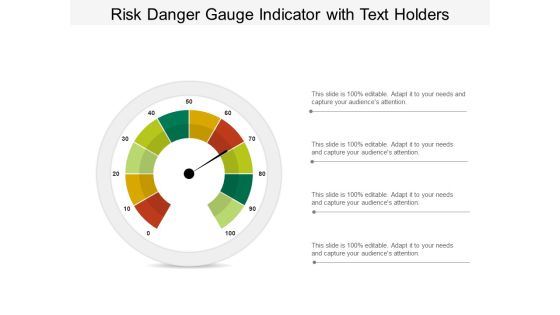
Risk Danger Gauge Indicator With Text Holders Ppt PowerPoint Presentation Outline Good
This is a risk danger gauge indicator with text holders ppt powerpoint presentation outline good. This is a four stage process. The stages in this process are risk meter, risk speedometer, hazard meter.
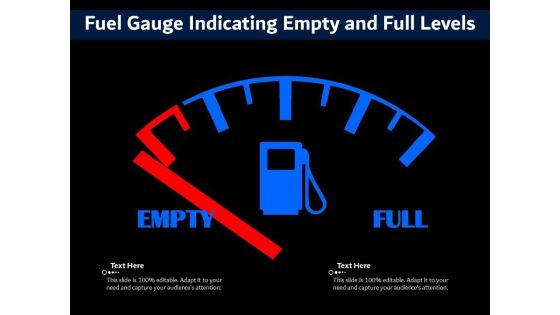
Fuel Gauge Indicating Empty And Full Levels Ppt PowerPoint Presentation Portfolio Clipart PDF
Presenting fuel gauge indicating empty and full levels ppt powerpoint presentation portfolio clipart pdf to dispense important information. This template comprises one stages. It also presents valuable insights into the topics including fuel gauge indicating empty and full levels. This is a completely customizable PowerPoint theme that can be put to use immediately. So, download it and address the topic impactfully.

Automotive Tools With Dial Gauge And Gear Knob Ppt PowerPoint Presentation Gallery Background Image PDF
Presenting this set of slides with name automotive tools with dial gauge and gear knob ppt powerpoint presentation gallery background image pdf. The topics discussed in these slide is automotive tools with dial gauge and gear knob. This is a completely editable PowerPoint presentation and is available for immediate download. Download now and impress your audience.
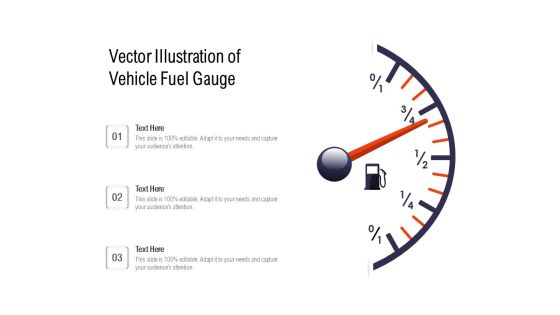
Vector Illustration Of Vehicle Fuel Gauge Ppt PowerPoint Presentation Gallery Introduction PDF
Showcasing this set of slides titled vector illustration of vehicle fuel gauge ppt powerpoint presentation gallery introduction pdf. The topics addressed in these templates are vector illustration of vehicle fuel gauge. All the content presented in this PPT design is completely editable. Download it and make adjustments in color, background, font etc. as per your unique business setting.
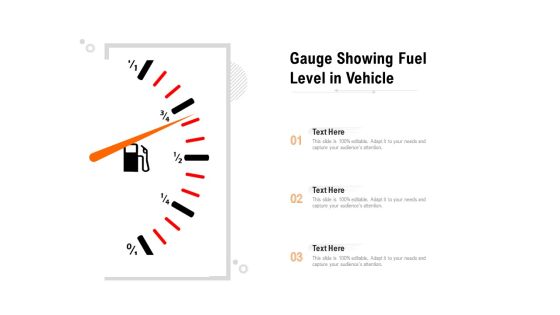
Gauge Showing Fuel Level In Vehicle Ppt PowerPoint Presentation Portfolio Picture PDF
Presenting gauge showing fuel level in vehicle ppt powerpoint presentation portfolio picture pdf to dispense important information. This template comprises three stages. It also presents valuable insights into the topics including gauge showing fuel level in vehicle. This is a completely customizable PowerPoint theme that can be put to use immediately. So, download it and address the topic impactfully.
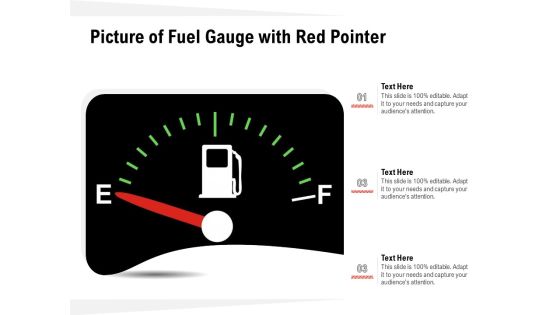
Picture Of Fuel Gauge With Red Pointer Ppt PowerPoint Presentation Show Samples PDF
Presenting picture of fuel gauge with red pointer ppt powerpoint presentation show samples pdf to dispense important information. This template comprises three stages. It also presents valuable insights into the topics including picture of fuel gauge with red pointer. This is a completely customizable PowerPoint theme that can be put to use immediately. So, download it and address the topic impactfully.
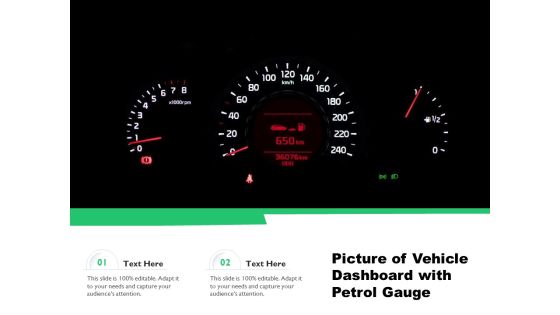
Picture Of Vehicle Dashboard With Petrol Gauge Ppt PowerPoint Presentation Portfolio Ideas PDF
Presenting picture of vehicle dashboard with petrol gauge ppt powerpoint presentation portfolio ideas pdf to dispense important information. This template comprises two stages. It also presents valuable insights into the topics including picture of vehicle dashboard with petrol gauge. This is a completely customizable PowerPoint theme that can be put to use immediately. So, download it and address the topic impactfully.
Vector Illustration Of Fuel Gauge Icon Ppt PowerPoint Presentation Layouts Graphics Design PDF
Presenting vector illustration of fuel gauge icon ppt powerpoint presentation layouts graphics design pdf to dispense important information. This template comprises three stages. It also presents valuable insights into the topics including vector illustration of fuel gauge icon. This is a completely customizable PowerPoint theme that can be put to use immediately. So, download it and address the topic impactfully.

Performance Gauge For Assessing Business Reliability On Technology Ppt PowerPoint Presentation Gallery Pictures PDF
Persuade your audience using this performance gauge for assessing business reliability on technology ppt powerpoint presentation gallery pictures pdf. This PPT design covers three stages, thus making it a great tool to use. It also caters to a variety of topics including performance gauge for assessing business reliability on technology. Download this PPT design now to present a convincing pitch that not only emphasizes the topic but also showcases your presentation skills.
Vector Illustration Of Speedometer Gauge Icon Ppt PowerPoint Presentation File Outline PDF
Persuade your audience using this vector illustration of speedometer gauge icon ppt powerpoint presentation file outline pdf. This PPT design covers three stages, thus making it a great tool to use. It also caters to a variety of topics including vector illustration of speedometer gauge icon. Download this PPT design now to present a convincing pitch that not only emphasizes the topic but also showcases your presentation skills.
Self Performance Assessment Gauge Vector Icon Ppt PowerPoint Presentation Gallery Slide PDF
Persuade your audience using this self performance assessment gauge vector icon ppt powerpoint presentation gallery slide pdf. This PPT design covers three stages, thus making it a great tool to use. It also caters to a variety of topics including self performance assessment gauge vector icon. Download this PPT design now to present a convincing pitch that not only emphasizes the topic but also showcases your presentation skills.

Picture Of Fuel Gauge With Pointing Level Ppt PowerPoint Presentation Infographic Template Graphics PDF
Persuade your audience using this picture of fuel gauge with pointing level ppt powerpoint presentation infographic template graphics pdf. This PPT design covers two stages, thus making it a great tool to use. It also caters to a variety of topics including picture of fuel gauge with pointing level. Download this PPT design now to present a convincing pitch that not only emphasizes the topic but also showcases your presentation skills.
Picture Of Scooter Dashboard With Fuel Gauge Ppt PowerPoint Presentation File Icon PDF
Persuade your audience using this picture of scooter dashboard with fuel gauge ppt powerpoint presentation file icon pdf. This PPT design covers four stages, thus making it a great tool to use. It also caters to a variety of topics including picture of scooter dashboard with fuel gauge. Download this PPT design now to present a convincing pitch that not only emphasizes the topic but also showcases your presentation skills.
Software Integration WBS System Integration Template Gauge Ppt PowerPoint Presentation Icon Clipart PDF
This is a software integration wbs system integration template gauge ppt powerpoint presentation icon clipart pdf template with various stages. Focus and dispense information on five stages using this creative set, that comes with editable features. It contains large content boxes to add your information on topics like gauge your readiness, understand business context, create a governance system, identify supporting applications, identify required infrastructure. You can also showcase facts, figures, and other relevant content using this PPT layout. Grab it now.
Time Gauge For Work In Progress Vector Icon Ppt Professional Graphic Tips PDF
Persuade your audience using this time gauge for work in progress vector icon ppt professional graphic tips pdf. This PPT design covers three stages, thus making it a great tool to use. It also caters to a variety of topics including time gauge for work in progress vector icon. Download this PPT design now to present a convincing pitch that not only emphasizes the topic but also showcases your presentation skills.

Sales Process Management To Boost Business Effectiveness Metrics To Gauge The Health Of Sales Pipeline Formats PDF
This slide shows comparison of sales pipeline metrics Number of deals in sales pipeline, average deal size, win rate etc. of company with the industry average.Deliver an awe inspiring pitch with this creative Sales Process Management To Boost Business Effectiveness Metrics To Gauge The Health Of Sales Pipeline Formats PDF bundle. Topics like Probability To Close, Average Length, Average Deal can be discussed with this completely editable template. It is available for immediate download depending on the needs and requirements of the user.
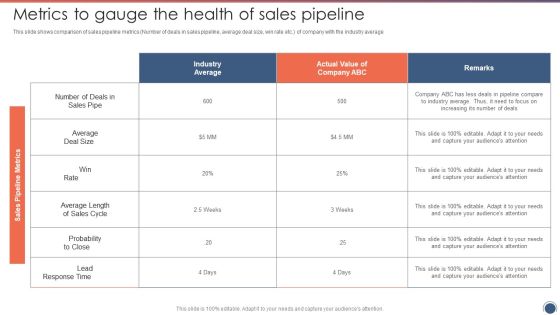
Metrics To Gauge The Health Of Sales Pipeline Sales Funnel Management Strategies To Increase Sales Elements PDF
This slide shows comparison of sales pipeline metrics Number of deals in sales pipeline, average deal size, win rate etc.of company with the industry average.Deliver an awe inspiring pitch with this creative Metrics To Gauge The Health Of Sales Pipeline Sales Funnel Management Strategies To Increase Sales Elements PDF bundle. Topics like Probability Close, Average Length, Average Deal can be discussed with this completely editable template. It is available for immediate download depending on the needs and requirements of the user.

Sales Management Pipeline For Effective Lead Generation Metrics To Gauge The Health Of Sales Pipeline Information PDF
This slide shows comparison of sales pipeline metrics Number of deals in sales pipeline, average deal size, win rate etc. of company with the industry average. Deliver and pitch your topic in the best possible manner with this Sales Management Pipeline For Effective Lead Generation Metrics To Gauge The Health Of Sales Pipeline Information PDF. Use them to share invaluable insights on Average, Probability, Industry Average and impress your audience. This template can be altered and modified as per your expectations. So, grab it now.
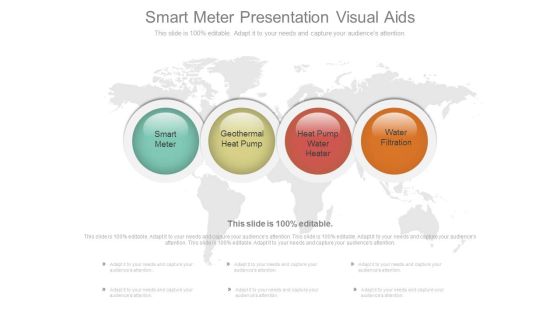
Smart Meter Presentation Visual Aids
This is a smart meter presentation visual aids. This is a four stage process. The stages in this process are smart meter, geothermal heat pump, heat pump water heater, water filtration.

Risk Tolerance Analysis Meter Ppt Slides
This is a risk tolerance analysis meter ppt slides. This is a two stage process. The stages in this process are business, communication, technology.

Product Quality Check Meter Presentation Layouts
This is a product quality check meter presentation layouts. This is a five stage process. The stages in this process are bad, poor, average, good, excellent.
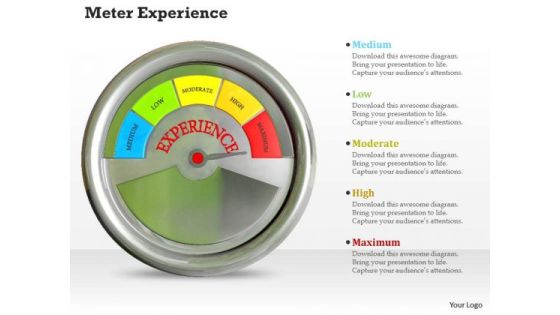
Stock Photo Meter Experience PowerPoint Slide
This image contains graphics of 3d meter indicating maximum level of experience. This image is an excellent tool to give an ideal presentation. Special effects of this image will surely interest the audience.
Stock Photo Meter Power PowerPoint Slide
This image contains graphics of 3d power meter . This image is an excellent tool to give an ideal presentation. Special effects of this image will surely interest the audience.
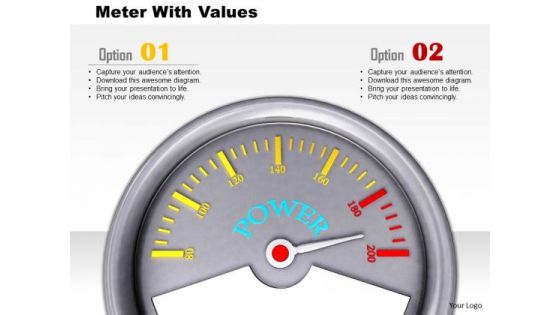
Stock Photo Meter With Values PowerPoint Slide
This image contains graphics of 3d power meter . This image is an excellent tool to give an ideal presentation. Special effects of this image will surely interest the audience.

Meter For Competitive Advantage Presentation Template
This pre-designed diagram of meter signifies the concept of competitive advantage. This template is carefully designed to look interesting and informative. Use this theme to give unified look to your presentations.
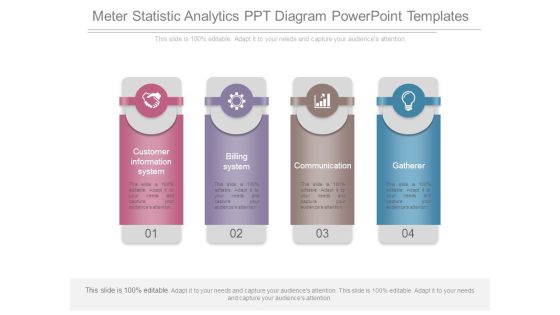
Meter Statistic Analytics Ppt Diagram Powerpoint Templates
This is a meter statistic analytics ppt diagram powerpoint templates. This is a four stage process. The stages in this process are customer information system, billing system, communication, gatherer.

Alarm Clock With Speed Meter Powerpoint Templates
Our above PPT slide contains graphics of alarm clock with speed meter. This PowerPoint template helps to display concept of deadlines and performance. Use this diagram to create more sound impact on viewers.
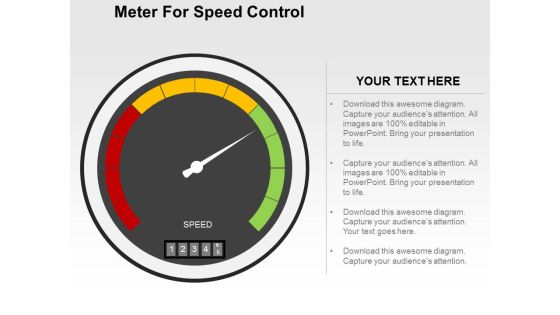
Meter For Speed Control Powerpoint Templates
Our professionally designed business diagram is as an effective tool for communicating business ideas and strategies for corporate planning. It contains graphics of speed control meter. Above slide is suitable to display business options with technology.
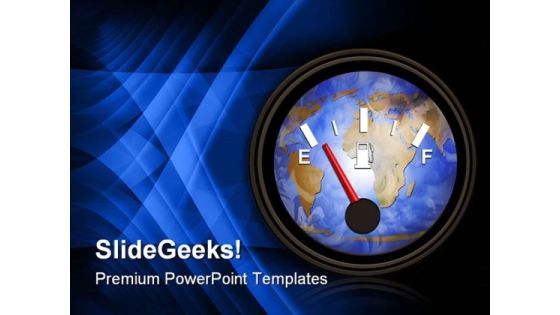
World Gasoline Meter Geographical PowerPoint Template 0810
We are running on empty and encreasing our dependency on oil.
Risk Meter Indicating Extreme Level Ppt PowerPoint Presentation Icon Template
This is a risk meter indicating extreme level ppt powerpoint presentation icon template. This is a five stage process. The stages in this process are risk meter, risk speedometer, hazard meter.

Risk Meter Indicating Medium Risk Ppt PowerPoint Presentation Ideas Graphics
This is a risk meter indicating medium risk ppt powerpoint presentation ideas graphics. This is a three stage process. The stages in this process are risk meter, risk speedometer, hazard meter.

Three Levels Risk Assessment Meter Ppt PowerPoint Presentation Infographics Themes
This is a three levels risk assessment meter ppt powerpoint presentation infographics themes. This is a three stage process. The stages in this process are risk meter, risk speedometer, hazard meter.

Sales Team Performance Meter Ppt PowerPoint Presentation Diagrams
This is a sales team performance meter ppt powerpoint presentation diagrams. This is a five stage process. The stages in this process are business, meter, speed, time, sales.

Glauco Meter Medical PowerPoint Background And Template 1210
Microsoft PowerPoint Template and Background with Digital illustration of glucose meter in color background.

Stock Photo 3d Meter With Maximum Value PowerPoint Slide
This image of 3d meter is very useful for presentations about growth and success. This high quality image has graphics of 3d meter pointing at maximum value. Create eye-catching presentation using this image.
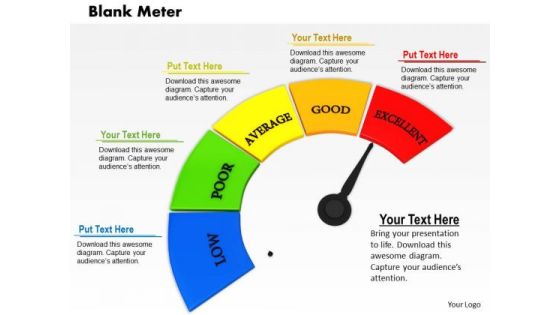
Stock Photo Meter With Red Maximum Value PowerPoint Slide
This image of 3d meter is very useful for presentations about growth and success. This high quality image has graphics of 3d meter pointing at maximum value. Create eye-catching presentation using this image.
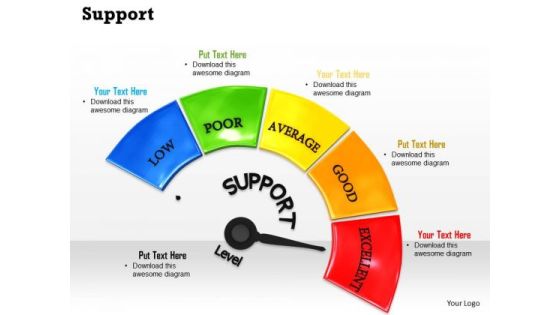
Stock Photo Support Meter With Excellent Level Pwerpoint Slide
This graphic image has been crafted with graphic of meter which have text support. This image shows the excellent level on the meter. Judge the quality of support for any business and display it in your presentation.

Business Diagram Meter Pointing On Poor Word Presentation Template
Graphic of meter has been used to design this power point template. This diagram contains the graphic of meter to display performance levels. Use this business diagram to make attractive presentations.

Strategy Diagram Meter Design For Business Progress Sales Diagram
Our Strategy Diagram Meter Design For Business Progress Sales Diagram Powerpoint Templates Abhor Doodling. They Never Let The Interest Flag.

Consulting Diagram Business Dashboard Progress Meter Business Diagram
Be The Doer With Our Consulting Diagram Business Dashboard Progress Meter Business Diagram Powerpoint Templates. Put Your Thoughts Into Practice.
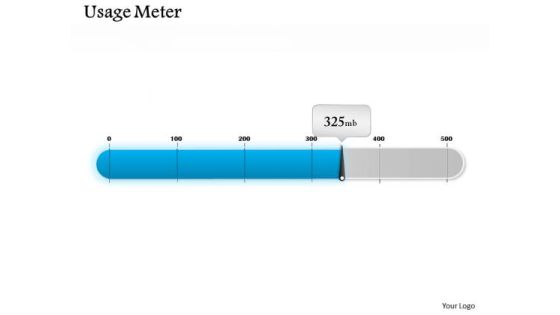
Mba Models And Frameworks Usage Meter Dashboard Design Consulting Diagram
Doll Up Your Thoughts With Our MBA Models And Frameworks Usage Meter Dashboard Design Consulting Diagram Powerpoint Templates. They Will Make A Pretty Picture.

Strategic Management Progress Meter Dashboard Design Marketing Diagram
Be A Donor Of Great Ideas. Display Your Charity On Our Strategic Management Progress Meter Dashboard Design Marketing Diagram Powerpoint Templates.

Business Framework Model Dashboard Business Meter Design Sales Diagram
Our Business Framework Model Dashboard Business Meter Design Sales Diagram Powerpoint Templates Team Are A Dogged Lot. They Keep At It Till They Get It Right.

Sales Diagram Dashboard Meter For Business Information Business Diagram
Our Sales Diagram Dashboard Meter For Business Information Business Diagram Powerpoint Templates Deliver At Your Doorstep. Let Them In For A Wonderful Experience.

Stock Photo Business Meter Displaying Maximum Value PowerPoint Slide
This PowerPoint slide displays business meter displaying maximum value. This image slide has been crafted with graphic of business meter with values. This image depicts business progress. Use this image slide to express views on success and achievements in your presentations. This image slide may also be used to display successful business model. Enhance the quality of your presentations using this image.

Dashboard Meter On Excel Ppt PowerPoint Presentation Icon Slides PDF
Showcasing this set of slides titled dashboard meter on excel ppt powerpoint presentation icon slides pdf. The topics addressed in these templates are dashboard meter on excel. All the content presented in this PPT design is completely editable. Download it and make adjustments in color, background, font etc. as per your unique business setting.
Fuel Meter Vector Icon Ppt PowerPoint Presentation Professional Examples PDF
Persuade your audience using this fuel meter vector icon ppt powerpoint presentation professional examples pdf. This PPT design covers four stages, thus making it a great tool to use. It also caters to a variety of topics including fuel meter vector icon. Download this PPT design now to present a convincing pitch that not only emphasizes the topic but also showcases your presentation skills.

Workforce Performance Measurement Meter Icon Ppt Portfolio Layouts PDF
Presenting Workforce Performance Measurement Meter Icon Ppt Portfolio Layouts PDF to dispense important information. This template comprises one stages. It also presents valuable insights into the topics including Workforce, Performance Measurement, Meter Icon. This is a completely customizable PowerPoint theme that can be put to use immediately. So, download it and address the topic impactfully.
Employee Work Performance Monitoring Meter Icon Background PDF
Showcasing this set of slides titled Employee Work Performance Monitoring Meter Icon Background PDF. The topics addressed in these templates are Monitoring Meter Icon, Employee Work Performance. All the content presented in this PPT design is completely editable. Download it and make adjustments in color, background, font etc. as per your unique business setting.
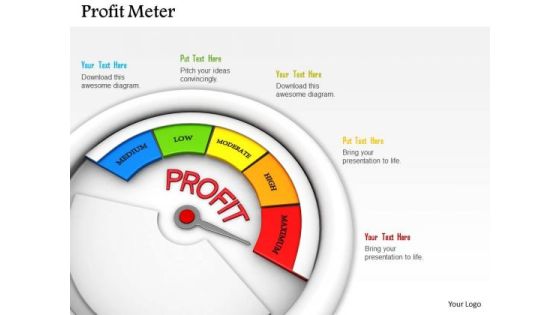
Stock Photo Meter Indicating Maximum Level Of Profit PowerPoint Slide
Display the concept of profit growth with this image. This image has been designed with graphics of meter indicating maximum level of profit. Use this image to make business presentations.

Stock Photo Meter Indicating Maximum Quality Level PowerPoint Slide
This image has been designed with graphics of meter indicating maximum level of quality. Concept of maintaining best quality can be explained with this image. Use this image to make business presentations.
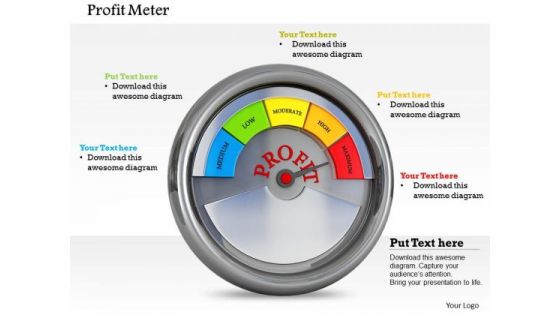
Stock Photo Profit Meter At Maximum Level PowerPoint Slide
Display the concept of profit growth with this image. This image has been designed with graphics of meter indicating maximum level of profit. Use this image to make business presentations.

Business Diagram Meter For Strategy Implementation Process Presentation Template
This business diagram has been designed with graphic of meter displaying YTD growth. Use this slide to exhibit strategy implementation process. Use this slide for your business and marketing related presentations.

Product Quality Assurance Meter Ppt PowerPoint Presentation Slide Download
This is a product quality assurance meter ppt powerpoint presentation slide download. This is a five stage process. The stages in this process are bad, poor, average, good, excellent.

Accelerator Meter Speed Icon Ppt Powerpoint Presentation Professional Good
This is a accelerator meter speed icon ppt powerpoint presentation professional good. This is a three stage process. The stages in this process are accelerator, seed accelerators, startup accelerator.

Accelerator Speed Meter Icon Ppt Powerpoint Presentation Outline Layout
This is a accelerator speed meter icon ppt powerpoint presentation outline layout. This is a four stage process. The stages in this process are accelerator, seed accelerators, startup accelerator.
Speed Level Meter Icon Ppt Powerpoint Presentation Inspiration Slides
This is a speed level meter icon ppt powerpoint presentation inspiration slides. This is a four stage process. The stages in this process are accelerator, seed accelerators, startup accelerator.
Speed Meter Vector Icon Ppt Powerpoint Presentation Model Inspiration
This is a speed meter vector icon ppt powerpoint presentation model inspiration. This is a four stage process. The stages in this process are accelerator, seed accelerators, startup accelerator.
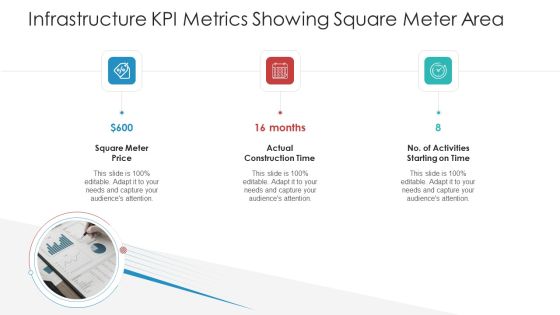
Infrastructure KPI Metrics Showing Square Meter Area Introduction PDF
This is a infrastructure kpi metrics showing square meter area introduction pdf template with various stages. Focus and dispense information on three stages using this creative set, that comes with editable features. It contains large content boxes to add your information on topics like square meter price actual, construction time, no of activities starting on time. You can also showcase facts, figures, and other relevant content using this PPT layout. Grab it now.
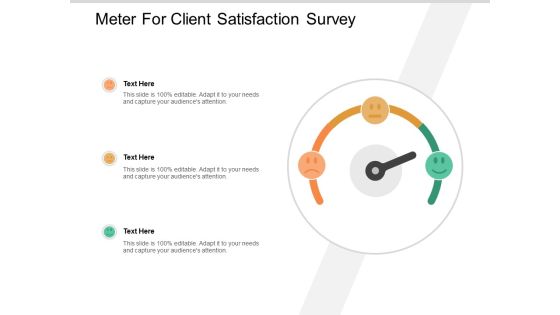
Meter For Client Satisfaction Survey Ppt PowerPoint Presentation Portfolio Outline
Presenting this set of slides with name meter for client satisfaction survey ppt powerpoint presentation portfolio outline. This is a three stage process. The stages in this process are product quality, product improvement, rating scale. This is a completely editable PowerPoint presentation and is available for immediate download. Download now and impress your audience.

Stock Photo Meter Showing Excellent Level Of Quality PowerPoint Slide
This image is designed with 3d meter with business quality representation. Use this image in any business presentations to display various quality levels. This image is a powerful tool for business processes to exhibit quality and its levels along with its factors.

Current Detecting Meter Vector Icon Ppt PowerPoint Presentation Introduction
Presenting this set of slides with name current detecting meter vector icon ppt powerpoint presentation introduction. The topics discussed in these slides are Marketing, Business, Management, Planning, Strategy. This is a completely editable PowerPoint presentation and is available for immediate download. Download now and impress your audience.
Digits Meter Vector Icon Ppt Powerpoint Presentation Inspiration Portfolio
Presenting this set of slides with name digits meter vector icon ppt powerpoint presentation inspiration portfolio. The topics discussed in these slides are number icon, mathematical, number bar vector. This is a completely editable PowerPoint presentation and is available for immediate download. Download now and impress your audience.

Odograph Scrolling Meter Speed Ppt PowerPoint Presentation Complete Deck
Boost your confidence and team morale with this well-structured odograph scrolling meter speed ppt powerpoint presentation complete deck. This prefabricated set gives a voice to your presentation because of its well-researched content and graphics. Our experts have added all the components very carefully, thus helping you deliver great presentations with a single click. Not only that, it contains a set of twelven slides that are designed using the right visuals, graphics, etc. Various topics can be discussed, and effective brainstorming sessions can be conducted using the wide variety of slides added in this complete deck. Apart from this, our PPT design contains clear instructions to help you restructure your presentations and create multiple variations. The color, format, design anything can be modified as deemed fit by the user. Not only this, it is available for immediate download. So, grab it now.

Credit Score Meter Ppt PowerPoint Presentation Complete Deck With Slides
If designing a presentation takes a lot of your time and resources and you are looking for a better alternative, then this Credit Score Meter Ppt PowerPoint Presentation Complete Deck With Slides is the right fit for you. This is a prefabricated set that can help you deliver a great presentation on the topic. All the ten slides included in this sample template can be used to present a birds-eye view of the topic. These slides are also fully editable, giving you enough freedom to add specific details to make this layout more suited to your business setting. Apart from the content, all other elements like color, design, theme are also replaceable and editable. This helps in designing a variety of presentations with a single layout. Not only this, you can use this PPT design in formats like PDF, PNG, and JPG once downloaded. Therefore, without any further ado, download and utilize this sample presentation as per your liking.
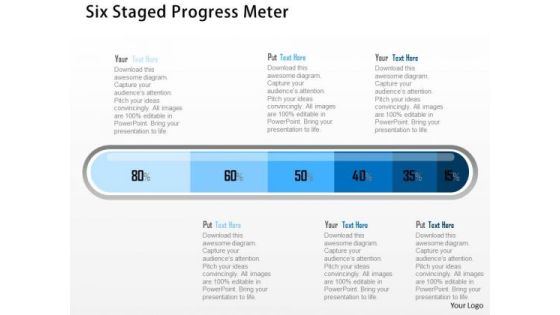
Business Diagram Six Staged Progress Meter Presentation Template
Our above business slide displays graphics of progress meter. This slide can be used as value chain example. This diagram provides an effective way of displaying information you can edit text, color, shade and style as per you need.
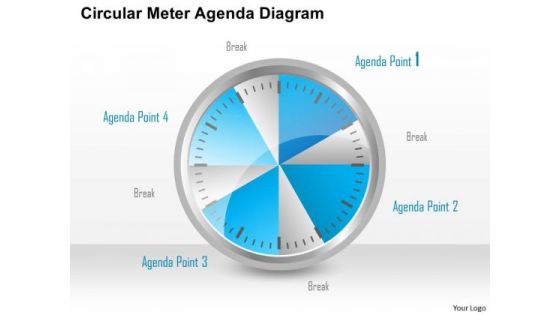
Consulting Slides Circular Meter Agenda Diagram Business Presentation
This circular process layout helps to describe the ordered set of steps required to complete a task. You can download this diagram to make awesome presentations in PowerPoint.

Hazard Meter Showing Three Danger Levels Ppt PowerPoint Presentation Infographic Template Examples
This is a hazard meter showing three danger levels ppt powerpoint presentation infographic template examples. This is a five stage process. The stages in this process are risk meter, risk speedometer, hazard meter.

Meter Showing Moderate Level Of Risk Ppt PowerPoint Presentation Model Summary
This is a meter showing moderate level of risk ppt powerpoint presentation model summary. This is a four stage process. The stages in this process are risk meter, risk speedometer, hazard meter.

Risk Meter With Pointer In Center Showing Medium Level Ppt PowerPoint Presentation Portfolio Templates
This is a risk meter with pointer in center showing medium level ppt powerpoint presentation portfolio templates. This is a three stage process. The stages in this process are risk meter, risk speedometer, hazard meter.

Stock Photo 3d Unique Meter With Low Medium And High Value PowerPoint Slide
This professional image displays graphics of conceptual meter. This meter depicts various levels. You can download this image to make presentations on team performance. Above image provides the ideal backdrop to make interactive presentations.
Good Better Best Rating Meter With Icons Ppt Powerpoint Presentation Outline Vector
This is a good better best rating meter with icons ppt powerpoint presentation outline vector. This is a three stage process. The stages in this process are good better best, good great superb, good great excellent.
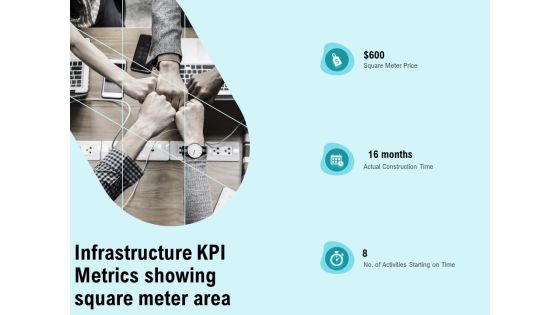
Facility Operations Contol Infrastructure Kpi Metrics Showing Square Meter Area Background PDF
Presenting this set of slides with name facility operations contol infrastructure kpi metrics showing square meter area background pdf. This is a three stage process. The stages in this process are square meter price, actual construction time, no. of activities starting on time . This is a completely editable PowerPoint presentation and is available for immediate download. Download now and impress your audience.

Construction Production Facilities Infrastructure KPI Metrics Showing Square Meter Area Rules PDF
Presenting this set of slides with name construction production facilities infrastructure kpi metrics showing square meter area rules pdf. This is a three stage process. The stages in this process are square meter price, actual construction time, no. of activities starting on time . This is a completely editable PowerPoint presentation and is available for immediate download. Download now and impress your audience.
Electricity Meter With Gear Vector Icon Ppt PowerPoint Presentation File Icons PDF
Presenting this set of slides with name electricity meter with gear vector icon ppt powerpoint presentation file icons pdf. This is a three stage process. The stages in this process are electricity meter with gear vector icon. This is a completely editable PowerPoint presentation and is available for immediate download. Download now and impress your audience.
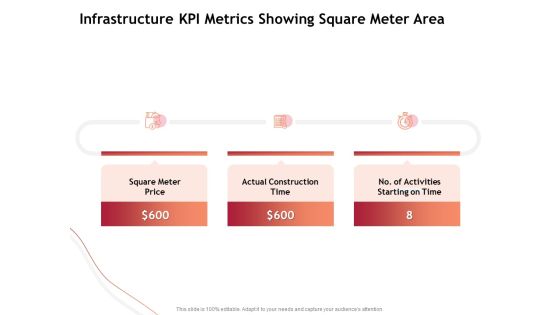
Performance Measuement Of Infrastructure Project Infrastructure KPI Metrics Showing Square Meter Area Download PDF
Presenting this set of slides with name performance measuement of infrastructure project infrastructure kpi metrics showing square meter area download pdf. This is a three stage process. The stages in this process are square meter price, actual construction time, number of activities starting on time. This is a completely editable PowerPoint presentation and is available for immediate download. Download now and impress your audience.

Functional Analysis Of Business Operations Infrastructure KPI Metrics Showing Square Meter Area Mockup PDF
Presenting this set of slides with name functional analysis of business operations infrastructure kpi metrics showing square meter area mockup pdf. This is a three stage process. The stages in this process are square meter price, construction time, activities starting. This is a completely editable PowerPoint presentation and is available for immediate download. Download now and impress your audience.
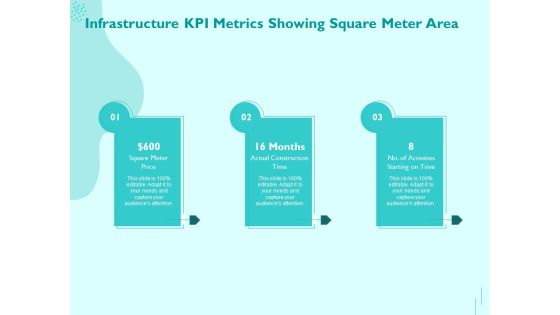
Managing IT Operating System Infrastructure KPI Metrics Showing Square Meter Area Infographics PDF
Presenting this set of slides with name managing it operating system infrastructure kpi metrics showing square meter area infographics pdf. This is a three stage process. The stages in this process are square meter price, actual construction time, no. of activities starting on time. This is a completely editable PowerPoint presentation and is available for immediate download. Download now and impress your audience.
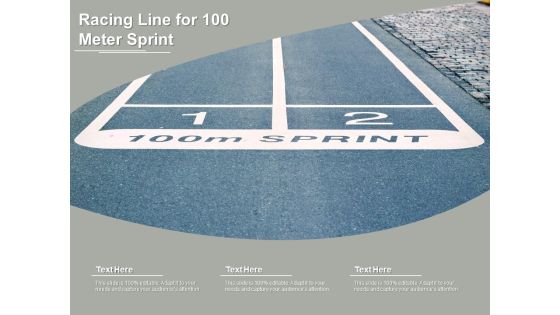
Racing Line For 100 Meter Sprint Ppt PowerPoint Presentation Gallery Picture PDF
Presenting this set of slides with name racing line for 100 meter sprint ppt powerpoint presentation gallery picture pdf. The topics discussed in these slide is racing line for 100 meter sprint. This is a completely editable PowerPoint presentation and is available for immediate download. Download now and impress your audience.

Client Satisfaction Level Meter Vector Icon Ppt PowerPoint Presentation Gallery Structure PDF
Presenting this set of slides with name client satisfaction level meter vector icon ppt powerpoint presentation gallery structure pdf. This is a three stage process. The stages in this process are client satisfaction level meter vector icon. This is a completely editable PowerPoint presentation and is available for immediate download. Download now and impress your audience.
Meter Showing High Risk Level Vector Icon Ppt PowerPoint Presentation Gallery Clipart PDF
Presenting this set of slides with name meter showing high risk level vector icon ppt powerpoint presentation gallery clipart pdf. This is a one stage process. The stage in this process is meter showing high risk level vector icon. This is a completely editable PowerPoint presentation and is available for immediate download. Download now and impress your audience.
Meter Performance Dashboard Vector Icon Ppt PowerPoint Presentation Gallery Backgrounds PDF
Presenting this set of slides with name meter performance dashboard vector icon ppt powerpoint presentation gallery backgrounds pdf. This is a three stage process. The stages in this process are meter performance dashboard vector icon. This is a completely editable PowerPoint presentation and is available for immediate download. Download now and impress your audience.

Business Deal Performance Meter Vector Icon Ppt PowerPoint Presentation Infographic Template Graphic Images PDF
Presenting business deal performance meter vector icon ppt powerpoint presentation infographic template graphic images pdf to dispense important information. This template comprises three stages. It also presents valuable insights into the topics including business deal performance meter vector icon. This is a completely customizable PowerPoint theme that can be put to use immediately. So, download it and address the topic impactfully.

Business Vendors Trust Meter Vector Icon Ppt PowerPoint Presentation Layouts Example PDF
Presenting business vendors trust meter vector icon ppt powerpoint presentation layouts example pdf to dispense important information. This template comprises three stages. It also presents valuable insights into the topics including business vendors trust meter vector icon. This is a completely customizable PowerPoint theme that can be put to use immediately. So, download it and address the topic impactfully.
Like Symbol With Meter Vector Icon Ppt PowerPoint Presentation Infographics Rules PDF
Presenting like symbol with meter vector icon ppt powerpoint presentation infographics rules pdf to dispense important information. This template comprises one stages. It also presents valuable insights into the topics including like symbol with meter vector icon. This is a completely customizable PowerPoint theme that can be put to use immediately. So, download it and address the topic impactfully.
Production Department Efficiency Overview Meter Icon Ppt PowerPoint Presentation Ideas PDF
Presenting production department efficiency overview meter icon ppt powerpoint presentation ideas pdf to dispense important information. This template comprises three stages. It also presents valuable insights into the topics including production department efficiency overview meter icon. This is a completely customizable PowerPoint theme that can be put to use immediately. So, download it and address the topic impactfully.
Water Meter With Arrow Vector Icon Ppt PowerPoint Presentation Summary PDF
Presenting water meter with arrow vector icon ppt powerpoint presentation summary pdf to dispense important information. This template comprises three stages. It also presents valuable insights into the topics including water meter with arrow vector icon. This is a completely customizable PowerPoint theme that can be put to use immediately. So, download it and address the topic impactfully.
Measurement Of Blood Glucose Levels With Hemoglobin Meter Ppt PowerPoint Presentation Icon Layouts PDF
Pitch your topic with ease and precision using this measurement of blood glucose levels with hemoglobin meter ppt powerpoint presentation icon layouts pdf. This layout presents information on measurement of blood glucose levels with hemoglobin meter. It is also available for immediate download and adjustment. So, changes can be made in the color, design, graphics or any other component to create a unique layout.

Amount Of Energy Consumed Shown In Electricity Meter Ppt PowerPoint Presentation File Graphic Tips PDF
Showcasing this set of slides titled amount of energy consumed shown in electricity meter ppt powerpoint presentation file graphic tips pdf. The topics addressed in these templates are amount of energy consumed shown in electricity meter. All the content presented in this PPT design is completely editable. Download it and make adjustments in color, background, font etc. as per your unique business setting.

Digital Electricity Meter Hanging On Wall Ppt PowerPoint Presentation File Layouts PDF
Pitch your topic with ease and precision using this digital electricity meter hanging on wall ppt powerpoint presentation file layouts pdf. This layout presents information on digital electricity meter hanging on wall. It is also available for immediate download and adjustment. So, changes can be made in the color, design, graphics or any other component to create a unique layout.
Electrician Checking Power Meter For Proper Functioning Ppt PowerPoint Presentation Icon Model PDF
Showcasing this set of slides titled electrician checking power meter for proper functioning ppt powerpoint presentation icon model pdf. The topics addressed in these templates are electrician checking power meter for proper functioning. All the content presented in this PPT design is completely editable. Download it and make adjustments in color, background, font etc. as per your unique business setting.

Measuring Electricity Voltage On Multi Meter Device Ppt PowerPoint Presentation Gallery Pictures PDF
Pitch your topic with ease and precision using this measuring electricity voltage on multi meter device ppt powerpoint presentation gallery pictures pdf. This layout presents information on measuring electricity voltage on multi meter device. It is also available for immediate download and adjustment. So, changes can be made in the color, design, graphics or any other component to create a unique layout.

Person Checking Power Meter For Identifying Fault Ppt PowerPoint Presentation Gallery Mockup PDF
Pitch your topic with ease and precision using this person checking power meter for identifying fault ppt powerpoint presentation gallery mockup pdf. This layout presents information on person checking power meter for identifying fault. It is also available for immediate download and adjustment. So, changes can be made in the color, design, graphics or any other component to create a unique layout.
Picture Of Three Phase Power Meter Ppt PowerPoint Presentation Icon Outline PDF
Showcasing this set of slides titled picture of three phase power meter ppt powerpoint presentation icon outline pdf. The topics addressed in these templates are picture of three phase power meter. All the content presented in this PPT design is completely editable. Download it and make adjustments in color, background, font etc. as per your unique business setting.
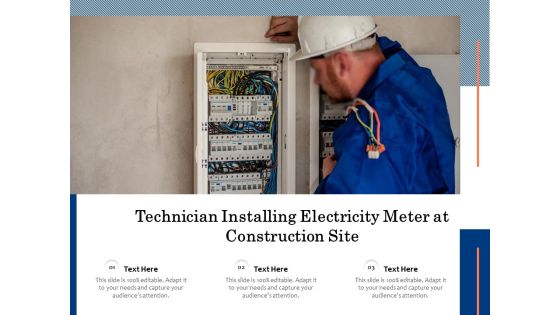
Technician Installing Electricity Meter At Construction Site Ppt PowerPoint Presentation File Slideshow PDF
Pitch your topic with ease and precision using this technician installing electricity meter at construction site ppt powerpoint presentation file slideshow pdf. This layout presents information on technician installing electricity meter at construction site. It is also available for immediate download and adjustment. So, changes can be made in the color, design, graphics or any other component to create a unique layout.
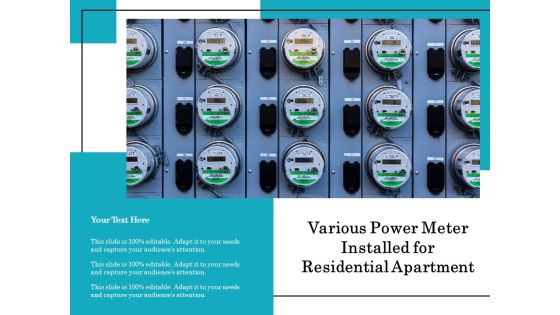
Various Power Meter Installed For Residential Apartment Ppt PowerPoint Presentation Gallery Layouts PDF
Showcasing this set of slides titled various power meter installed for residential apartment ppt powerpoint presentation gallery layouts pdf. The topics addressed in these templates are various power meter installed for residential apartment. All the content presented in this PPT design is completely editable. Download it and make adjustments in color, background, font etc. as per your unique business setting.
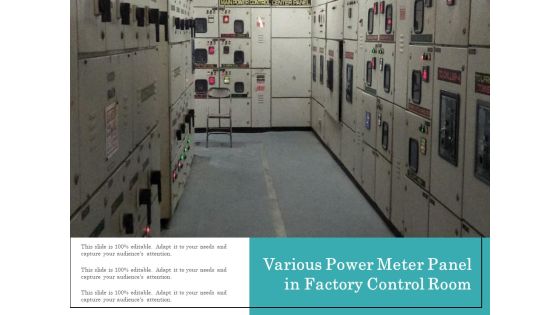
Various Power Meter Panel In Factory Control Room Ppt PowerPoint Presentation Gallery Smartart PDF
Pitch your topic with ease and precision using this various power meter panel in factory control room ppt powerpoint presentation gallery smartart pdf. This layout presents information on various power meter panel in factory control room. It is also available for immediate download and adjustment. So, changes can be made in the color, design, graphics or any other component to create a unique layout.

Circular Meter For Progress Status Vector Icon Ppt Inspiration Template PDF
Presenting circular meter for progress status vector icon ppt inspiration template pdf to dispense important information. This template comprises three stages. It also presents valuable insights into the topics including circular meter for progress status vector icon. This is a completely customizable PowerPoint theme that can be put to use immediately. So, download it and address the topic impactfully.

Company Website Trust Meter Vector Icon Ppt PowerPoint Presentation Infographics Example PDF
Persuade your audience using this company website trust meter vector icon ppt powerpoint presentation infographics example pdf. This PPT design covers two stages, thus making it a great tool to use. It also caters to a variety of topics including company website trust meter vector icon. Download this PPT design now to present a convincing pitch that not only emphasizes the topic but also showcases your presentation skills.
Employee Trust Meter Vector Icon Ppt PowerPoint Presentation Infographics Good PDF
Persuade your audience using this employee trust meter vector icon ppt powerpoint presentation infographics good pdf. This PPT design covers three stages, thus making it a great tool to use. It also caters to a variety of topics including employee trust meter vector icon. Download this PPT design now to present a convincing pitch that not only emphasizes the topic but also showcases your presentation skills.
Security Shield And Meter Vector Icon Ppt PowerPoint Presentation Styles Summary PDF
Persuade your audience using this security shield and meter vector icon ppt powerpoint presentation styles summary pdf. This PPT design covers three stages, thus making it a great tool to use. It also caters to a variety of topics including security shield and meter vector icon. Download this PPT design now to present a convincing pitch that not only emphasizes the topic but also showcases your presentation skills.
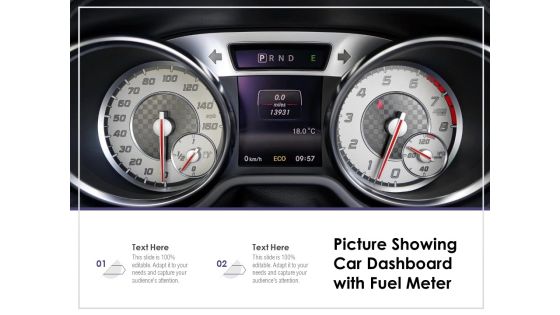
Picture Showing Car Dashboard With Fuel Meter Ppt PowerPoint Presentation Summary Grid PDF
Persuade your audience using this picture showing car dashboard with fuel meter ppt powerpoint presentation summary grid pdf. This PPT design covers two stages, thus making it a great tool to use. It also caters to a variety of topics including picture showing car dashboard with fuel meter. Download this PPT design now to present a convincing pitch that not only emphasizes the topic but also showcases your presentation skills.

IT And Cloud Facilities Management Infrastructure KPI Metrics Showing Square Meter Area Designs PDF
Presenting it and cloud facilities management infrastructure kpi metrics showing square meter area designs pdf to provide visual cues and insights. Share and navigate important information on three stages that need your due attention. This template can be used to pitch topics like square meter, price actual, construction time, activities starting time. In addition, this PPT design contains high-resolution images, graphics, etc, that are easily editable and available for immediate download.
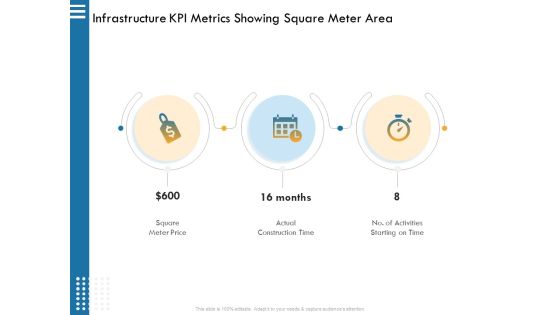
IT Infrastructure Governance Infrastructure KPI Metrics Showing Square Meter Area Ppt Infographics Guide PDF
Presenting it infrastructure governance infrastructure kpi metrics showing square meter area ppt infographics guide pdf. to provide visual cues and insights. Share and navigate important information on three stages that need your due attention. This template can be used to pitch topics like square meter price actual, construction time, no. activities starting time. In addtion, this PPT design contains high resolution images, graphics, etc, that are easily editable and available for immediate download.
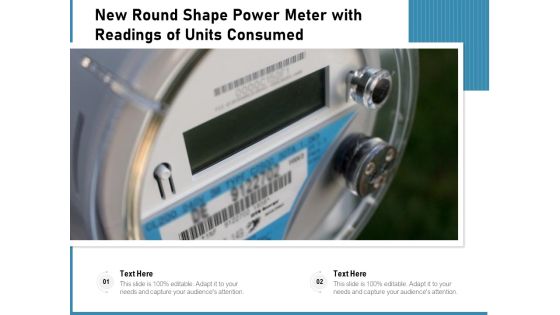
New Round Shape Power Meter With Readings Of Units Consumed Ppt PowerPoint Presentation File Show PDF
Showcasing this set of slides titled new round shape power meter with readings of units consumed ppt powerpoint presentation file show pdf. The topics addressed in these templates are new round shape power meter with readings of units consumed. All the content presented in this PPT design is completely editable. Download it and make adjustments in color, background, font etc. as per your unique business setting.

Framework Administration Infrastructure KPI Metrics Showing Square Meter Area Elements PDF
Presenting framework administration infrastructure kpi metrics showing square meter area elements pdf to provide visual cues and insights. Share and navigate important information on three stages that need your due attention. This template can be used to pitch topics like square meter price, actual construction time, no. of activities starting on time. In addition, this PPT design contains high-resolution images, graphics, etc, that are easily editable and available for immediate download.

Substructure Segment Analysis Infrastructure KPI Metrics Showing Square Meter Area Diagrams PDF
This is a substructure segment analysis infrastructure kpi metrics showing square meter area diagrams pdf template with various stages. Focus and dispense information on three stages using this creative set, that comes with editable features. It contains large content boxes to add your information on topics like square meter price, actual construction time, activities starting on time. You can also showcase facts, figures, and other relevant content using this PPT layout. Grab it now.

Facility Management Infrastructure KPI Metrics Showing Square Meter Area Ppt Inspiration Example PDF
Presenting facility management infrastructure kpi metrics showing square meter area ppt inspiration example pdf to provide visual cues and insights. Share and navigate important information on three stages that need your due attention. This template can be used to pitch topics like square meter price, actual construction time, no of activities starting on time. In addtion, this PPT design contains high resolution images, graphics, etc, that are easily editable and available for immediate download.
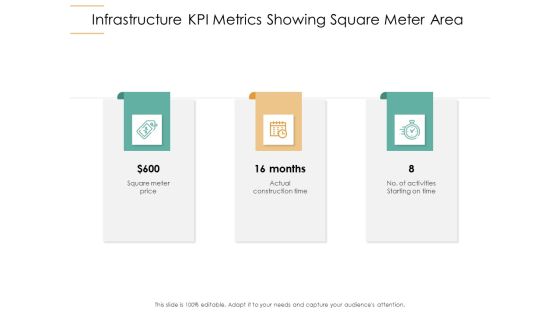
Infrastructure Strategies Infrastructure KPI Metrics Showing Square Meter Area Ppt Outline Graphics Pictures PDF
Presenting infrastructure strategies infrastructure kpi metrics showing square meter area ppt outline graphics pictures pdf to provide visual cues and insights. Share and navigate important information on three stages that need your due attention. This template can be used to pitch topics like square meter price, actual construction time, no of activities starting on time. In addtion, this PPT design contains high resolution images, graphics, etc, that are easily editable and available for immediate download.
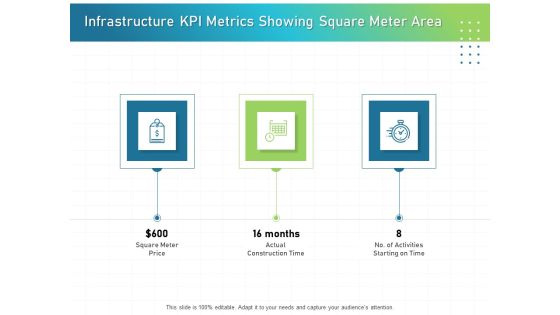
IT Infrastructure Administration Infrastructure KPI Metrics Showing Square Meter Area Guidelines PDF
Presenting it infrastructure administration infrastructure kpi metrics showing square meter area guidelines pdf to provide visual cues and insights. Share and navigate important information on three stages that need your due attention. This template can be used to pitch topics like square meter price, actual construction time, no of activities starting on time. In addtion, this PPT design contains high resolution images, graphics, etc, that are easily editable and available for immediate download.

Infrastructure Project Management In Construction Infrastructure KPI Metrics Showing Square Meter Area Portrait PDF
Presenting infrastructure project management in construction infrastructure kpi metrics showing square meter area portrait pdf. to provide visual cues and insights. Share and navigate important information on three stages that need your due attention. This template can be used to pitch topics like Square Meter Price, Actual Construction Time. In addtion, this PPT design contains high resolution images, graphics, etc, that are easily editable and available for immediate download.

Information Technology Functions Management Infrastructure KPI Metrics Showing Square Meter Area Summary PDF
Presenting information technology functions management infrastructure kpi metrics showing square meter area summary pdf to provide visual cues and insights. Share and navigate important information on three stages that need your due attention. This template can be used to pitch topics like square meter price, actual construction time, no activities starting time. In addition, this PPT design contains high-resolution images, graphics, etc, that are easily editable and available for immediate download.
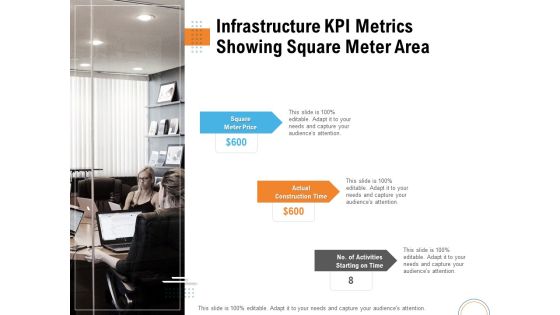
Utilizing Infrastructure Management Using Latest Methods Infrastructure KPI Metrics Showing Square Meter Area Summary PDF
Presenting utilizing infrastructure management using latest methods infrastructure kpi metrics showing square meter area summary pdf to provide visual cues and insights. Share and navigate important information on three stages that need your due attention. This template can be used to pitch topics like square meter price, actual construction time, no activities starting time. In addition, this PPT design contains high-resolution images, graphics, etc, that are easily editable and available for immediate download.

Civil Infrastructure Designing Services Management Infrastructure Kpi Metrics Showing Square Meter Area Slides PDF
Presenting civil infrastructure designing services management infrastructure kpi metrics showing square meter area slides pdf to provide visual cues and insights. Share and navigate important information on three stages that need your due attention. This template can be used to pitch topics like infrastructure kpi metrics showing square meter area. In addtion, this PPT design contains high resolution images, graphics, etc, that are easily editable and available for immediate download.

Business Activities Assessment Examples Infrastructure KPI Metrics Showing Square Meter Area Elements PDF
Presenting business activities assessment examples infrastructure kpi metrics showing square meter area elements pdf to provide visual cues and insights. Share and navigate important information on three stages that need your due attention. This template can be used to pitch topics like square meter price, actual construction time, activities starting on time. In addtion, this PPT design contains high resolution images, graphics, etc, that are easily editable and available for immediate download.
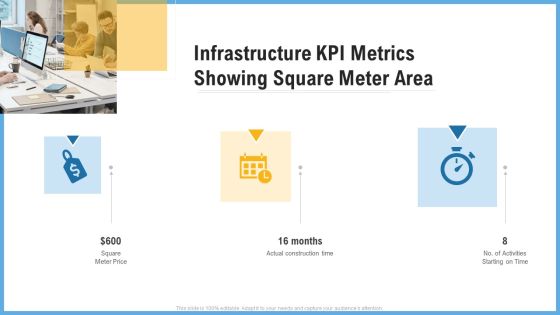
Improving Operational Activities Enterprise Infrastructure Kpi Metrics Showing Square Meter Area Portrait PDF
This is a improving operational activities enterprise infrastructure kpi metrics showing square meter area portrait pdf template with various stages. Focus and dispense information on three stages using this creative set, that comes with editable features. It contains large content boxes to add your information on topics like infrastructure kpi metrics showing square meter area. You can also showcase facts, figures, and other relevant content using this PPT layout. Grab it now.

Construction Management Services And Action Plan Infrastructure KPI Metrics Showing Square Meter Area Information PDF
Presenting construction management services and action plan infrastructure kpi metrics showing square meter area information pdf to provide visual cues and insights. Share and navigate important information on three stages that need your due attention. This template can be used to pitch topics like infrastructure kpi metrics showing square meter area. In addtion, this PPT design contains high resolution images, graphics, etc, that are easily editable and available for immediate download.

Construction Engineering And Industrial Facility Management Infrastructure KPI Metrics Showing Square Meter Area Ideas PDF
Presenting construction engineering and industrial facility management infrastructure kpi metrics showing square meter area ideas pdf to provide visual cues and insights. Share and navigate important information on three stages that need your due attention. This template can be used to pitch topics like square meter price, actual construction time, no of activities starting on time . In addtion, this PPT design contains high resolution images, graphics, etc, that are easily editable and available for immediate download.
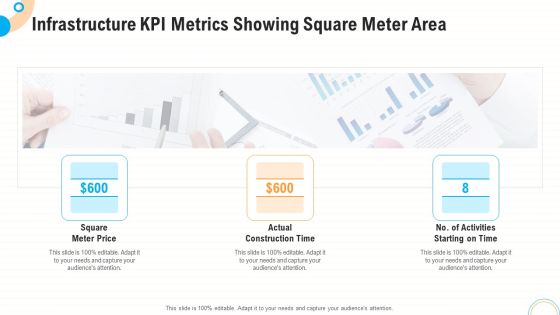
Fiscal And Operational Assessment Infrastructure KPI Metrics Showing Square Meter Area Guidelines PDF
Presenting fiscal and operational assessment infrastructure kpi metrics showing square meter area guidelines pdf to provide visual cues and insights. Share and navigate important information on three stages that need your due attention. This template can be used to pitch topics like square meter price, actual construction time, activities starting. In addtion, this PPT design contains high resolution images, graphics, etc, that are easily editable and available for immediate download.
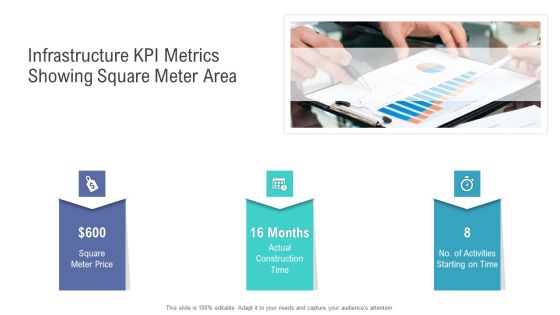
Financial Functional Assessment Infrastructure KPI Metrics Showing Square Meter Area Summary PDF
Presenting financial functional assessment infrastructure kpi metrics showing square meter area summary pdf to provide visual cues and insights. Share and navigate important information on three stages that need your due attention. This template can be used to pitch topics like square meter price, actual construction time, activities. In addition, this PPT design contains high-resolution images, graphics, etc, that are easily editable and available for immediate download.
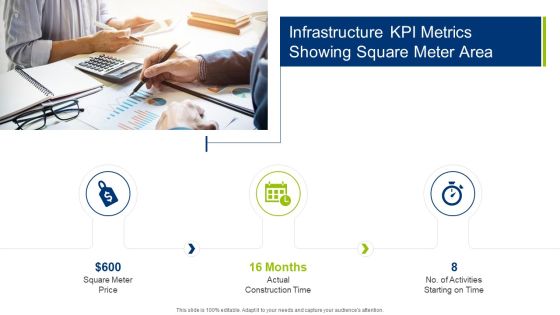
Infrastructure Building Administration Infrastructure KPI Metrics Showing Square Meter Area Portrait PDF
This is a infrastructure building administration infrastructure kpi metrics showing square meter area portrait pdf template with various stages. Focus and dispense information on three stages using this creative set, that comes with editable features. It contains large content boxes to add your information on topics like square meter price actual, construction time, activities starting on time. You can also showcase facts, figures, and other relevant content using this PPT layout. Grab it now.

Construction Management Services Infrastructure KPI Metrics Showing Square Meter Area Designs PDF
Presenting construction management services infrastructure kpi metrics showing square meter area designs pdf to provide visual cues and insights. Share and navigate important information on three stages that need your due attention. This template can be used to pitch topics like square meter price, actual construction time, activities. In addition, this PPT design contains high-resolution images, graphics, etc, that are easily editable and available for immediate download.
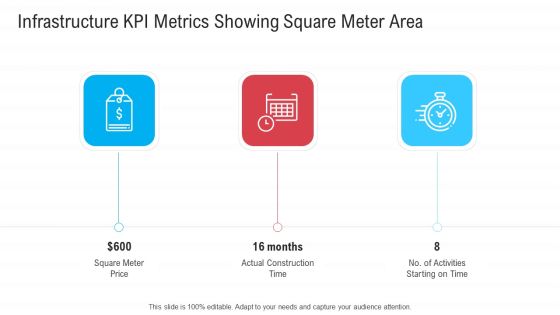
Infrastructure Designing And Administration Infrastructure KPI Metrics Showing Square Meter Area Guidelines PDF
Presenting infrastructure designing and administration infrastructure kpi metrics showing square meter area guidelines pdf to provide visual cues and insights. Share and navigate important information on three stages that need your due attention. This template can be used to pitch topics like square meter price, actual construction time, no of activities starting on time. In addtion, this PPT design contains high resolution images, graphics, etc, that are easily editable and available for immediate download.
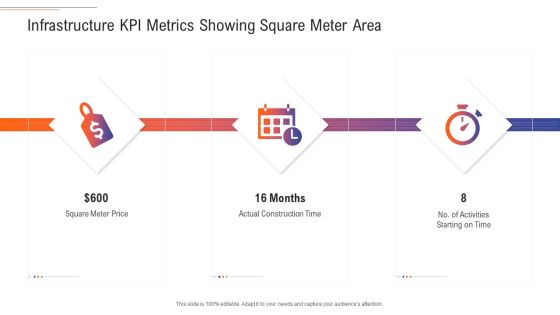
Support Services Management Infrastructure KPI Metrics Showing Square Meter Area Ideas PDF
Presenting support services management infrastructure kpi metrics showing square meter area ideas pdf to provide visual cues and insights. Share and navigate important information on three stages that need your due attention. This template can be used to pitch topics like square meter price, actual construction time, no of activities starting on time. In addtion, this PPT design contains high resolution images, graphics, etc, that are easily editable and available for immediate download.

Half Yearly Marketing Scheme Diagram For Electric Meter Accuracy Ppt PowerPoint Presentation Gallery Maker PDF
Persuade your audience using this half yearly marketing scheme diagram for electric meter accuracy ppt powerpoint presentation gallery maker pdf. This PPT design covers six stages, thus making it a great tool to use. It also caters to a variety of topics including half yearly marketing scheme diagram for electric meter accuracy. Download this PPT design now to present a convincing pitch that not only emphasizes the topic but also showcases your presentation skills.

Customer Satisfaction Rating Meter Feedback Rating Scale Sale Services Excellent Ppt PowerPoint Presentation Complete Deck
Presenting this set of slides with name customer satisfaction rating meter feedback rating scale sale services excellent ppt powerpoint presentation complete deck. The topics discussed in these slides are feedback rating scale, sale services, excellent, product, services. This is a completely editable PowerPoint presentation and is available for immediate download. Download now and impress your audience.
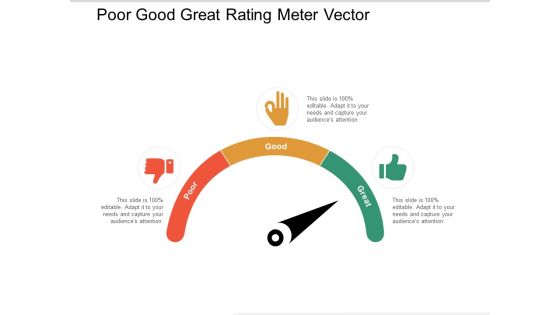
Poor Good Great Rating Meter Vector Ppt PowerPoint Presentation Show Slide Download
Presenting this set of slides with name poor good great rating meter vector ppt powerpoint presentation show slide download. This is a three stage process. The stages in this process are product quality, product improvement, rating scale. This is a completely editable PowerPoint presentation and is available for immediate download. Download now and impress your audience.
Red Yellow Green Meter With Emoticons For Feedback Ppt PowerPoint Presentation Ideas Template
Presenting this set of slides with name red yellow green meter with emoticons for feedback ppt powerpoint presentation ideas template. This is a three stage process. The stages in this process are product quality, product improvement, rating scale. This is a completely editable PowerPoint presentation and is available for immediate download. Download now and impress your audience.
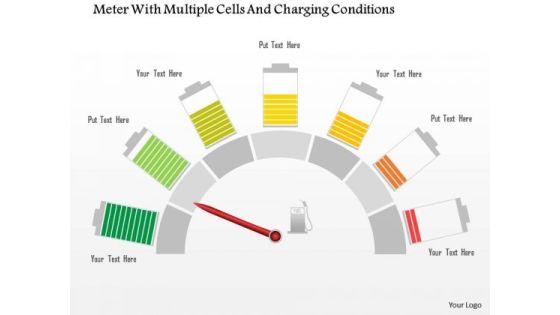
Business Diagram Meter With Multiple Cells And Charging Conditions Presentation Template
This Power Point template slide has been designed with graphic of meter and multiple cells. This PPT slide contains the concept of power consumption and charging. Use this PPT in your presentation and build an innovative presentation for power related topics.
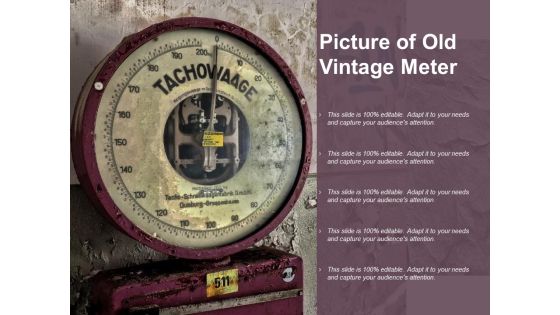
Picture Of Old Vintage Meter Ppt PowerPoint Presentation Infographic Template Sample
Presenting this set of slides with name picture of old vintage meter ppt powerpoint presentation infographic template sample. This is a one stage process. The stages in this process are weighing scale, measure, weighing machine. This is a completely editable PowerPoint presentation and is available for immediate download. Download now and impress your audience.

Customer Satisfaction Score Meter With Three Levels Ppt PowerPoint Presentation Gallery Smartart PDF
Presenting customer satisfaction score meter with three levels ppt powerpoint presentation gallery smartart pdf to dispense important information. This template comprises three stages. It also presents valuable insights into the topics including unsatisfied, neutral, satisfaction. This is a completely customizable PowerPoint theme that can be put to use immediately. So, download it and address the topic impactfully.

Meter Showing Business Risk Levels Ppt PowerPoint Presentation Show Slide PDF
Persuade your audience using this meter showing business risk levels ppt powerpoint presentation show slide pdf. This PPT design covers three stages, thus making it a great tool to use. It also caters to a variety of topics including low, medium, high. Download this PPT design now to present a convincing pitch that not only emphasizes the topic but also showcases your presentation skills.

Smart Grid Technology Iot Based Electricity Energy Meter Reading Background PDF
This slide represents the introduction to smart grid technology that involves two infrastructures, such as electrical and communication infrastructure. It also includes the primary components of the system covering intelligent appliances, smart power meters, smart substations and so on. This modern and well arranged Smart Grid Technology Iot Based Electricity Energy Meter Reading Background PDF provides lots of creative possibilities. It is very simple to customize and edit with the Powerpoint Software. Just drag and drop your pictures into the shapes. All facets of this template can be edited with Powerpoint no extra software is necessary. Add your own material, put your images in the places assigned for them, adjust the colors, and then you can show your slides to the world, with an animated slide included.
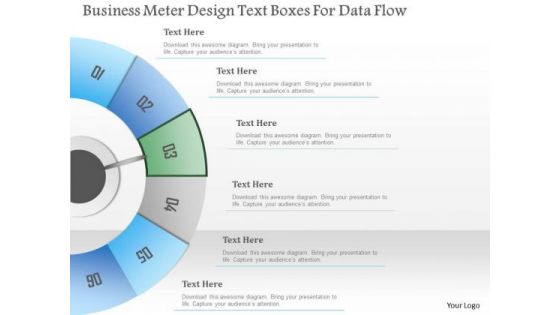
Busines Diagram Business Meter Design Text Boxes For Data Flow Presentation Template
Concept of data flow can be well defined with this exclusive business diagram. This slide contains the diagram of six steps in semi-circle. Use this professional diagram to impress your viewers.

Smart Metering Management Diagram Good Ppt Example
This is a smart metering management diagram good ppt example. This is a eight stage process. The stages in this process are reporting, customer information system, billing system, asset management, network information system, security manager, dc persistency, monitoring and control, meter data management.
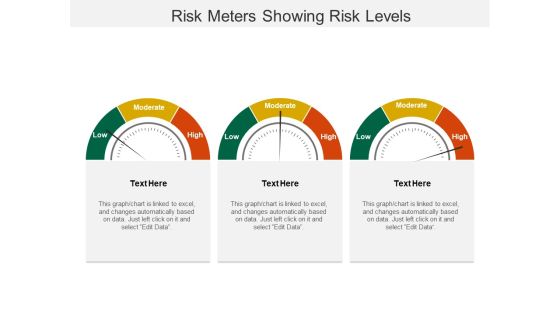
Risk Meters Showing Risk Levels Ppt PowerPoint Presentation Summary Example
This is a risk meters showing risk levels ppt powerpoint presentation summary example. This is a three stage process. The stages in this process are risk meter, risk speedometer, hazard meter.
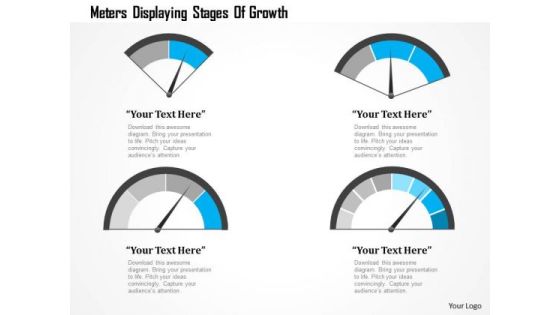
Business Diagram Meters Displaying Stages Of Growth Presentation Template
Graphic of four different meters has been used to craft this power point template. This PPT contains the concept of speed calculation. Use this PPT for your technology and mechanical topics in any presentations.
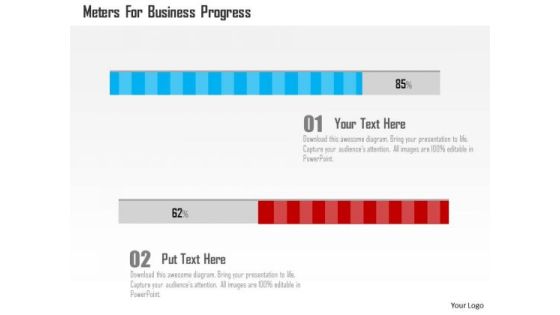
Business Diagram Meters For Business Progress Presentation Template
This business slide contains graphics of meter. You may use this slide to depict business progress. Download our above diagram to express information in a visual way.
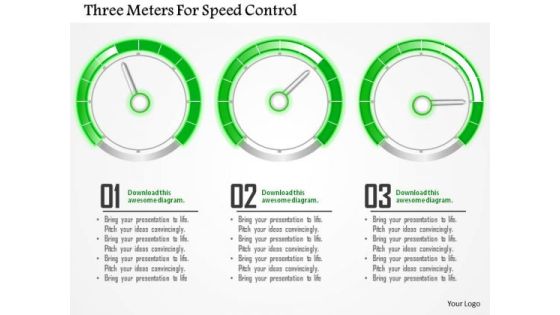
Business Diagram Three Meters For Speed Control Presentation Template
Graphic of three speedometers has been used to design this power point template. This diagram contains the concept of speed control. Amplify your thoughts via this appropriate business template.
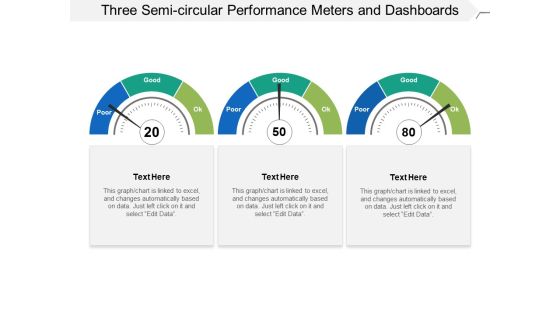
Three Semi Circular Performance Meters And Dashboards Ppt PowerPoint Presentation Slides Influencers
This is a three semi circular performance meters and dashboards ppt powerpoint presentation slides influencers. This is a three stage process. The stages in this process are fuel gauge, gas gauge, fuel containers.
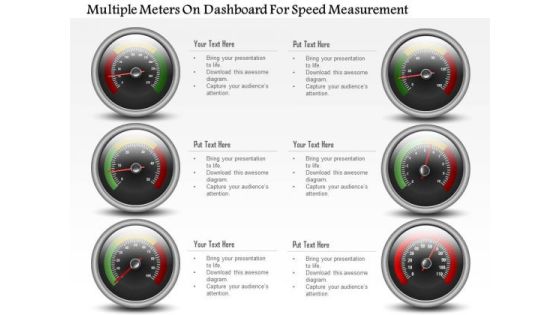
Business Diagram Multiple Meters On Dashboard For Speed Measurement PowerPoint Slide
This business diagram has been designed with multiple meters on dashboard. This slide can be used for business planning and progress. Use this diagram for your business and success milestones related presentations.
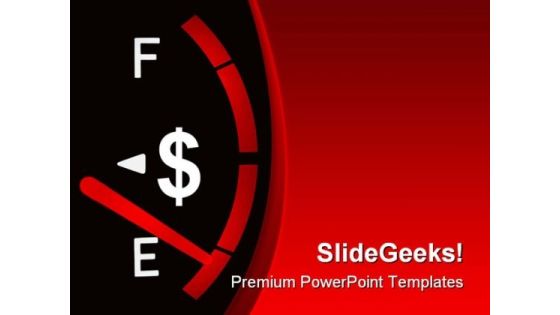
Empty Funds Finance PowerPoint Template 0610
Cash gauge on the dashboard approaching empty value

Profit Business PowerPoint Template 0910
beautiful woman posing near profit loss meter
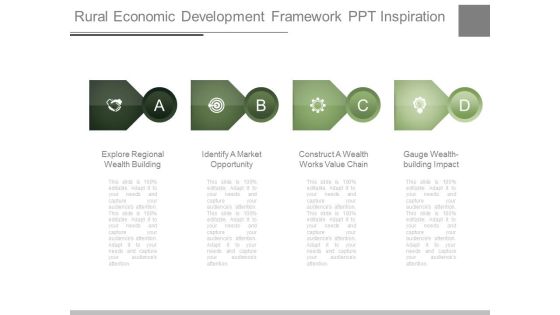
Rural Economic Development Framework Ppt Inspiration
This is a rural economic development framework ppt inspiration. This is a four stage process. The stages in this process are explore regional wealth building, identify a market opportunity, construct a wealth works value chain, gauge wealth building impact.
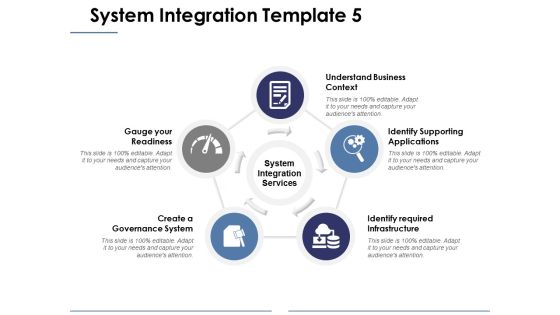
System Integration Template 5 Ppt PowerPoint Presentation File Gallery
This is a system integration template 5 ppt powerpoint presentation file gallery. This is a five stage process. The stages in this process are gauge your readiness, create a governance system, understand business context, identify supporting applications, identify required infrastructure.
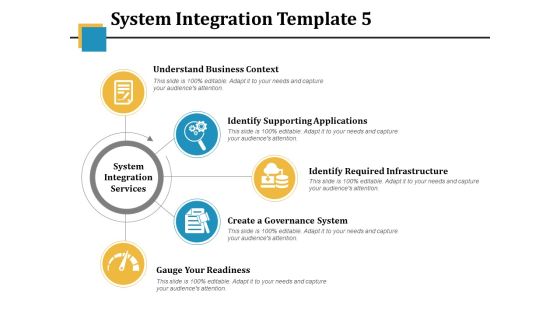
System Integration Template 5 Ppt PowerPoint Presentation Summary Templates
This is a system integration template 5 ppt powerpoint presentation summary templates. This is a five stage process. The stages in this process are understand business context, identify supporting applications, identify required infrastructure, create a governance system, gauge your readiness.

Data Center Architecture Management Best Practices Introduction PDF
This slide covers data center infrastructure management best practices. It involves gauge resource requirements, adopt consistence system of record, implement monitoring and patch servers. Persuade your audience using this Data Center Architecture Management Best Practices Introduction PDF. This PPT design covers four stages, thus making it a great tool to use. It also caters to a variety of topics including Implement Ongoing Monitoring, Consistence System Of Record, Gauge Resource Requirements. Download this PPT design now to present a convincing pitch that not only emphasizes the topic but also showcases your presentation skills.

PR Plan Approaches With Rethink Goals Ppt PowerPoint Presentation Summary Slide Download
Presenting this set of slides with name pr plan approaches with rethink goals ppt powerpoint presentation summary slide download. This is a three stage process. The stages in this process are rethink goals, gauge impact on search, long term narrative vs episodic campaign. This is a completely editable PowerPoint presentation and is available for immediate download. Download now and impress your audience.
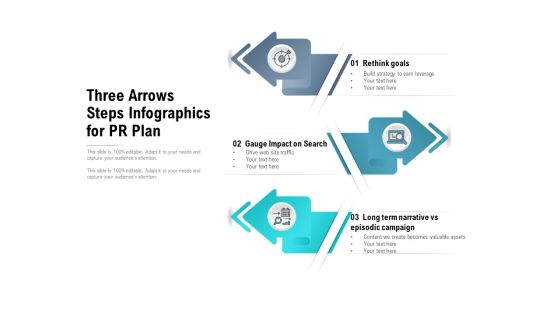
Three Arrows Steps Infographics For PR Plan Ppt PowerPoint Presentation Slides Design Templates
Presenting this set of slides with name three arrows steps infographics for pr plan ppt powerpoint presentation slides design templates. This is a three stage process. The stages in this process are rethink goals, gauge impact on search, long term narrative vs episodic campaign. This is a completely editable PowerPoint presentation and is available for immediate download. Download now and impress your audience.
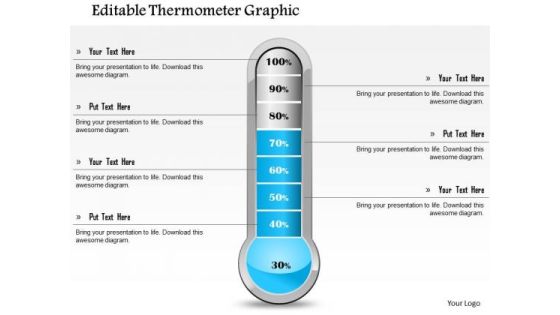
Business Framework Editable Thermometer Graphic PowerPoint Presentation
This Power Point template slide has been crafted with graphic of meter. This meter contains the max and min value. Use this PPt for your technical presentation and display your technical specifications in a graphical way.

Measuring Influencer Marketing ROI Metric Brand Engagement Total Themes PDF
Analyze which posts drew the best engagement likes and comments. The feedback by customers help you gauge customers reactions to your products. Deliver an awe-inspiring pitch with this creative measuring influencer marketing roi metric brand engagement total themes pdf bundle. Topics like engagement over time, total engagement, engagement by content type can be discussed with this completely editable template. It is available for immediate download depending on the needs and requirements of the user.

Business Strategy Planning Model System Integration Services Ppt Inspiration Microsoft PDF
This is a business strategy planning model system integration services ppt inspiration microsoft pdf template with various stages. Focus and dispense information on five stages using this creative set, that comes with editable features. It contains large content boxes to add your information on topics like business context, supporting applications, system integration services, governance system, gauge your readiness. You can also showcase facts, figures, and other relevant content using this PPT layout. Grab it now.

Tableau Business Intelligence Tool Salesforce Business Profile Diagrams PDF
This slide highlights the salesforce analytics software reports and dashboards which showcases the dashboard that includes chart, table, gauge with real-time reporting, and security controls. Deliver an awe inspiring pitch with this creative Tableau Business Intelligence Tool Salesforce Business Profile Diagrams PDF bundle. Topics like Server Management, Embedded Analytics, Security Controls can be discussed with this completely editable template. It is available for immediate download depending on the needs and requirements of the user.

Software Application Marketing Data Analytics Report Mockup PDF
This slide shows app marketing analytics dashboard to gauge how well the marketing efforts are performing. It includes parameters like non organic content, organic content attribution,reengegement. Showcasing this set of slides titled Software Application Marketing Data Analytics Report Mockup PDF. The topics addressed in these templates are Software Application, Marketing Data, Analytics Report. All the content presented in this PPT design is completely editable. Download it and make adjustments in color, background, font etc. as per your unique business setting.

Employee Work Time Utilization Analysis Graph Mockup PDF
The following slide highlights the employee work time assessment to gauge their productivity. It includes activities such as daily tasks, research, meetings, reports, contracting, travel, etc. Showcasing this set of slides titled Employee Work Time Utilization Analysis Graph Mockup PDF. The topics addressed in these templates are Employee Work Time, Utilization Analysis Graph. All the content presented in this PPT design is completely editable. Download it and make adjustments in color, background, font etc. as per your unique business setting.
Data Centre Architecture Model Management Best Practices Ppt Icon Design Inspiration PDF
This slide covers data centre architecture model management best practices to improve the efficiency of the overall process. It involves gauging resource requirements, adopting a consistent system of record, and implementing monitoring and patching servers. Persuade your audience using this Data Centre Architecture Model Management Best Practices Ppt Icon Design Inspiration PDF. This PPT design covers four stages, thus making it a great tool to use. It also caters to a variety of topics including Gauge Resource Requirements, Consistence System Record, Implement Ongoing Monitoring, Patch Servers. Download this PPT design now to present a convincing pitch that not only emphasizes the topic but also showcases your presentation skills.

How Build Gamification Advertising Plan Measure Behavior Post Gamification Ppt File Example PDF
In the example below, gamification was applied for employee engagement. Measure the activities of the employees to gauge how effective the gamification strategy was. Presenting how build gamification advertising plan measure behavior post gamification ppt file example pdf to provide visual cues and insights. Share and navigate important information on six stages that need your due attention. This template can be used to pitch topics like measure behavior post gamification. In addtion, this PPT design contains high resolution images, graphics, etc, that are easily editable and available for immediate download.
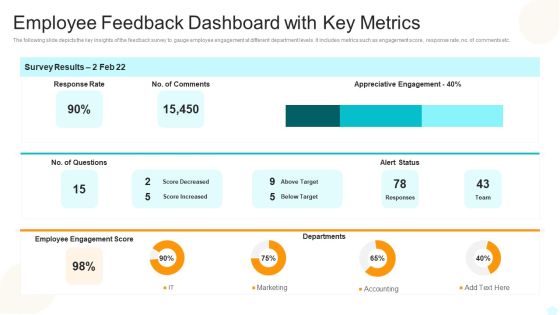
Employee Feedback Dashboard With Key Metrics Elements PDF
The following slide depicts the key insights of the feedback survey to gauge employee engagement at different department levels. It includes metrics such as engagement score, response rate, no. of comments etc.Showcasing this set of slides titled Employee Feedback Dashboard With Key Metrics Elements PDF The topics addressed in these templates are Employee Feedback Dashboard With Key Metrics All the content presented in this PPT design is completely editable. Download it and make adjustments in color, background, font etc. as per your unique business setting.
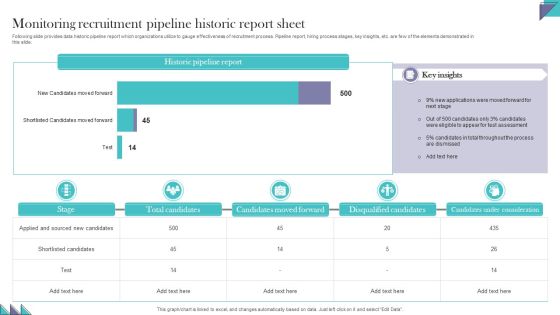
Monitoring Recruitment Pipeline Historic Report Sheet Pictures PDF
Following slide provides data historic pipeline report which organizations utilize to gauge effectiveness of recruitment process. Pipeline report, hiring process stages, key insights, etc. are few of the elements demonstrated in this slide. Pitch your topic with ease and precision using this Monitoring Recruitment Pipeline Historic Report Sheet Pictures PDF. This layout presents information on Candidates Moved Forward, Disqualified Candidates, Candidates Under Consideration. It is also available for immediate download and adjustment. So, changes can be made in the color, design, graphics or any other component to create a unique layout

Strategies To Grow Startup Business Affairs Pictures PDF
Following slide provides information regarding growth approaches which startup business employ to gauge current performance and maximize growth opportunities. New branch opening, product and service diversification, competitive analysis, etc. Are the key strategies demonstrated in this slide.Persuade your audience using this Strategies To Grow Startup Business Affairs Pictures PDF. This PPT design covers six stages, thus making it a great tool to use. It also caters to a variety of topics including Improve Forecasting, Business Process, Continuously Improving. Download this PPT design now to present a convincing pitch that not only emphasizes the topic but also showcases your presentation skills.

Budget Benchmark Report For Oncology Clinical Studies At Global Level Icons PDF
The slide showcases budget benchmarking to gauge and improve financial results by selecting few operating ratios by which company wants to measure its results and manage assets. Showcasing this set of slides titled Budget Benchmark Report For Oncology Clinical Studies At Global Level Icons PDF. The topics addressed in these templates are Benchmark Source, Key Insights, Actual Budget. All the content presented in this PPT design is completely editable. Download it and make adjustments in color, background, font etc. as per your unique business setting.

Global Statistics Showcasing Benchmark Report Strategy Utilization Mockup PDF
The slide highlights global benchmarking usage, which assists organizations to gauge HR resources efficiently and effectively. This slide includes key insights such as facts regarding employers and practices to improve human resource. Showcasing this set of slides titled Global Statistics Showcasing Benchmark Report Strategy Utilization Mockup PDF. The topics addressed in these templates are Top Employers Fact, Improving People Practices, Employers Use Benchmarking. All the content presented in this PPT design is completely editable. Download it and make adjustments in color, background, font etc. as per your unique business setting.

Export Process Checklist To Evaluate Progress Sample PDF
This slide showcases the checklist for the export process to gauge progress. It incudes activities such as conduct SWOT analysis, develop plan, obtain an order. Obtain export license, checking inventory to manufacture, prepare and send invoice and documentation. Showcasing this set of slides titled Export Process Checklist To Evaluate Progress Sample PDF. The topics addressed in these templates are Checking Supply Availability, Confirm Sale Terms, Packing Slip. All the content presented in this PPT design is completely editable. Download it and make adjustments in color, background, font etc. as per your unique business setting.

Strategies To Optimize Export Logistic Process Graphics PDF
This slide showcases the checklist for the export process to gauge progress. It incudes activities such as conduct SWOT analysis, develop plan, obtain an order. Obtain export license, checking inventory to manufacture, prepare and send invoice and documentation. Persuade your audience using this Strategies To Optimize Export Logistic Process Graphics PDF. This PPT design covers Three stages, thus making it a great tool to use. It also caters to a variety of topics including Transportation, Automation, People Management. Download this PPT design now to present a convincing pitch that not only emphasizes the topic but also showcases your presentation skills.

Dashboard For Measuring And Assessing Communication Tactics Information PDF
This slide represents dashboard to assess and gauge internal communication approaches which benefits industries in assessing strategy, plan gaps and build efficient employee engagement. Elements included in this slide are engagement score, employee satisfaction rate, communication tools and strategies, etc. Showcasing this set of slides titled Dashboard For Measuring And Assessing Communication Tactics Information PDF. The topics addressed in these templates are Employee Engagement, Employee Response Rate, Communication Effectiveness. All the content presented in this PPT design is completely editable. Download it and make adjustments in color, background, font etc. as per your unique business setting.

Measuring And Assessing Communication Tactics Channels Rules PDF
Following slide highlights the approaches to assess and gauge communication channels that assist company in identifying engagement medium which best supports targeted business objectives. This slide includes information about channel type, communication approaches, measurement, etc. Pitch your topic with ease and precision using this Measuring And Assessing Communication Tactics Channels Rules PDF. This layout presents information on Channel Type, Communication Strategies, Measurement. It is also available for immediate download and adjustment. So, changes can be made in the color, design, graphics or any other component to create a unique layout.

Toolkit For Measuring And Assessing Communication Tactics Activities Background PDF
This slide demonstrates toolkit to assess and gauge communication acuities implemented by organisations to achieve higher level of workforce performance management and engagement. This slide includes communication activities and strategies and evaluation and measurement tools. Pitch your topic with ease and precision using this Toolkit For Measuring And Assessing Communication Tactics Activities Background PDF. This layout presents information on Communication Activities, Evaluation Tools, Measurement Tools. It is also available for immediate download and adjustment. So, changes can be made in the color, design, graphics or any other component to create a unique layout.
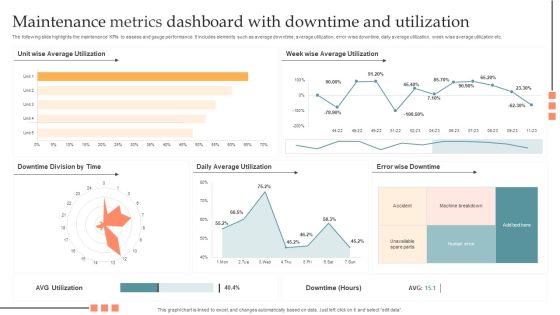
Maintenance Metrics Dashboard With Downtime And Utilization Pictures PDF
The following slide highlights the maintenance KPIs to assess and gauge performance. It includes elements such as average downtime, average utilization, error wise downtime, daily average utilization, week wise average utilization etc. Showcasing this set of slides titled Maintenance Metrics Dashboard With Downtime And Utilization Pictures PDF. The topics addressed in these templates are Maintenance Metrics Dashboard, Downtime And Utilization. All the content presented in this PPT design is completely editable. Download it and make adjustments in color, background, font etc. as per your unique business setting.
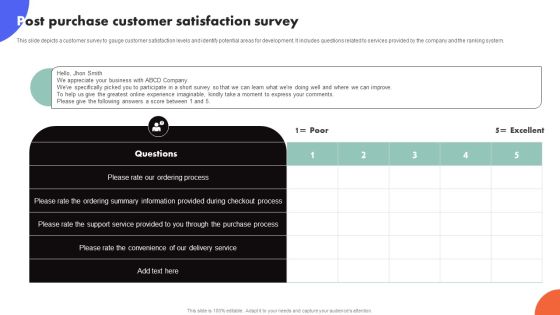
Improving Buyer Journey Through Strategic Customer Engagement Post Purchase Customer Satisfaction Survey Sample PDF
This slide depicts a customer survey to gauge customer satisfaction levels and identify potential areas for development. It includes questions related to services provided by the company and the ranking system. Want to ace your presentation in front of a live audience Our Improving Buyer Journey Through Strategic Customer Engagement Post Purchase Customer Satisfaction Survey Sample PDF can help you do that by engaging all the users towards you.. Slidegeeks experts have put their efforts and expertise into creating these impeccable powerpoint presentations so that you can communicate your ideas clearly. Moreover, all the templates are customizable, and easy-to-edit and downloadable. Use these for both personal and commercial use.
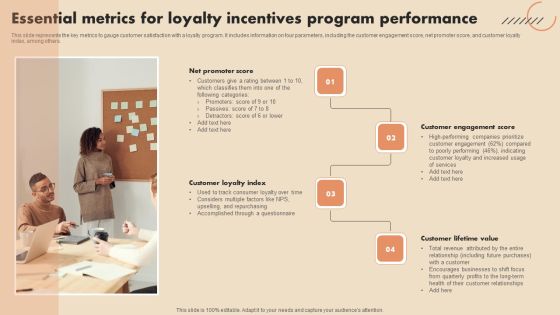
Essential Metrics For Loyalty Incentives Program Performance Microsoft PDF
This slide represents the key metrics to gauge customer satisfaction with a loyalty program. It includes information on four parameters, including the customer engagement score, net promoter score, and customer loyalty index, among others.Persuade your audience using this Essential Metrics For Loyalty Incentives Program Performance Microsoft PDF. This PPT design covers four stages, thus making it a great tool to use. It also caters to a variety of topics including Net Promoter Score, Customer Engagement Score. Download this PPT design now to present a convincing pitch that not only emphasizes the topic but also showcases your presentation skills.
 Home
Home