AI PPT Maker
Templates
PPT Bundles
Design Services
Business PPTs
Business Plan
Management
Strategy
Introduction PPT
Roadmap
Self Introduction
Timelines
Process
Marketing
Agenda
Technology
Medical
Startup Business Plan
Cyber Security
Dashboards
SWOT
Proposals
Education
Pitch Deck
Digital Marketing
KPIs
Project Management
Product Management
Artificial Intelligence
Target Market
Communication
Supply Chain
Google Slides
Research Services
 One Pagers
All Categories
-
Home
- Customer Favorites
- Measure Success
Measure Success

Stock Photo Business Strategy Plan Template Do On Time Calculation Images
Put Them On The Same Page With Our stock photo business strategy plan template do on time calculation stock photo images Powerpoint Templates. Your Team Will Sing From The Same Sheet. Push The Envelope With Our clocks Powerpoint Templates. Let Your Thoughts Rise Above The Norm.
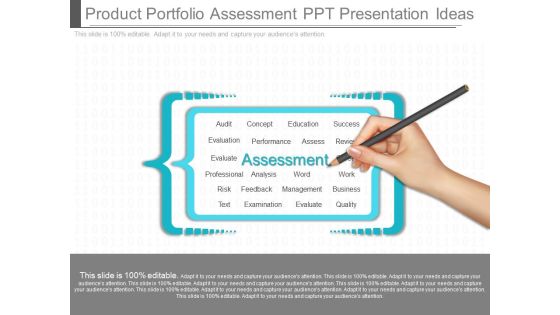
Product Portfolio Assessment Ppt Presentation Ideas
This is a product portfolio assessment ppt presentation ideas. This is a one stage process. The stages in this process are assessment, audit, concept, education, success, evaluation, performance, assess, review, evaluate, career, professional, analysis, word, work, risk, feedback, management, business, text, examination, quality.

Kpis For Media Campaigns Evaluation Ppt PowerPoint Presentation Deck
This is a kpis for media campaigns evaluation ppt powerpoint presentation deck. This is a three stage process. The stages in this process are traffic, engagement, conversion, website visitors.
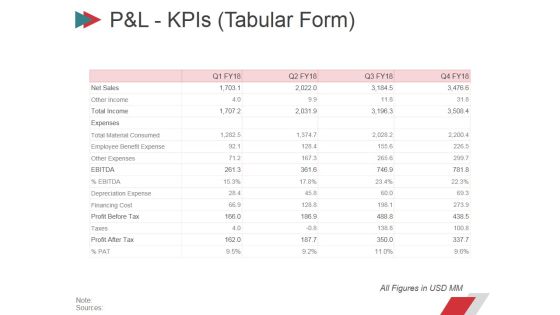
Pandl Kpis Tabular Form Ppt PowerPoint Presentation Summary Layout
This is a pandl kpis tabular form ppt powerpoint presentation summary layout. This is a four stage process. The stages in this process are revenue, cogs, operating profit, net profit.

Pandl Kpis Tabular Form Ppt PowerPoint Presentation File Design Templates
This is a pandl kpis tabular form ppt powerpoint presentation file design templates. This is a four stage process. The stages in this process are revenue, cogs, operating profit, net profit.

Balance Sheet Kpis Ppt PowerPoint Presentation Infographics Good
This is a balance sheet kpis ppt powerpoint presentation infographics good. This is a four stage process. The stages in this process are current assets, current liabilities, total assets, total liabilities.

Cash Flow Statement Kpis Ppt PowerPoint Presentation Model Samples
This is a cash flow statement kpis ppt powerpoint presentation model samples. This is a four stage process. The stages in this process are operations, financing activities, investing activities, increase in cash.
Testing Product Performance Ppt PowerPoint Presentation Slides
This is a testing product performance ppt powerpoint presentation slides. This is a three stage process. The stage in this process are venn, business, process, circular, arrows.

Balanced Business Scorecards Metrics Ppt Slides
This is a balanced business scorecards metrics ppt slides. This is a four stage process. The stages in this process are revenue, improvement, innovation, cost.

Retail Inventory Metrics Systems Ppt Powerpoint Images
This is a retail inventory metrics systems ppt powerpoint images. This is a one stage process. The stages in this process are mobility, labor operations, store pulse, labor budgeting, labor forecasting, labor scheduling, employee self service, time and attendance, kpi activator, store walk, task management, store execution, advanced analytics and reporting.

Supply Chain Management Operational Metrics SCM Goals Background PDF
Presenting supply chain management operational metrics SCM goals background pdf. to provide visual cues and insights. Share and navigate important information on five stages that need your due attention. This template can be used to pitch topics like minimization of supply chain expenses is very essential, standardized processes. In addtion, this PPT design contains high resolution images, graphics, etc, that are easily editable and available for immediate download.
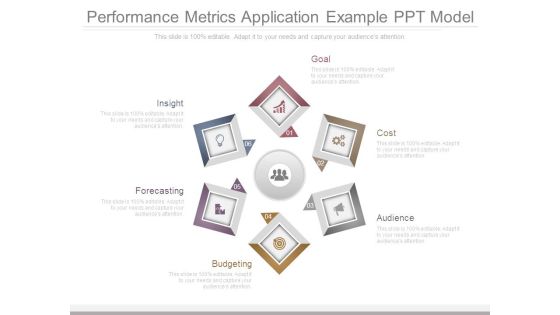
Performance Metrics Application Example Ppt Model
This is a performance metrics application example ppt model. This is a six stage process. The stages in this process are goal, cost, audience, budgeting, forecasting, insight.
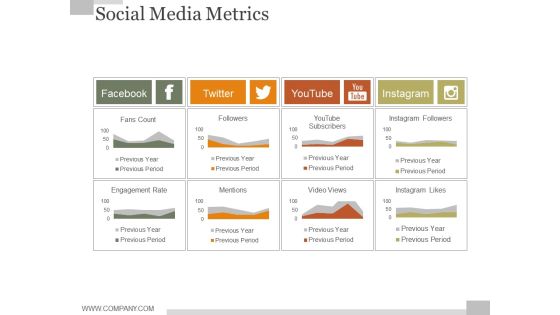
Social Media Metrics Ppt PowerPoint Presentation Graphics
This is a social media metrics ppt powerpoint presentation graphics. This is a four stage process. The stages in this process are facebook, twitter, youtube, instagram.
Strategic Management Metrics Example Ppt Presentation
This is a strategic management metrics example ppt presentation. This is a four stage process. The stages in this process are lower cost, differentiation, broad target, narrow target, cost leadership, differentiation, cost focus, differentiation focus.
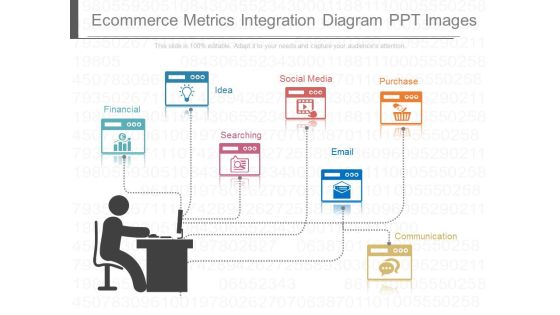
Ecommerce Metrics Integration Diagram Ppt Images
This is a ecommerce metrics integration diagram ppt images. This is a seven stage process. The stages in this process are financial, idea, searching, social media, email, purchase, communication.
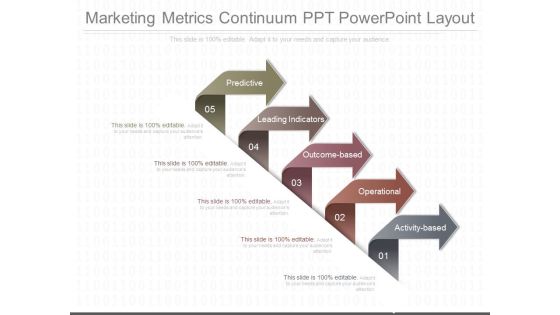
Marketing Metrics Continuum Ppt Powerpoint Layout
This is a marketing metrics continuum ppt powerpoint layout. This is a five stage process. The stages in this process are predictive, leading indicators, outcome based, operational, activity based.

Kpi Metric Dashboard Diagram Ppt Example
This is a kpi metric dashboard diagram ppt example. This is a seven stage process. The stages in this process are avg cost hour, safety inspection score, on time shipment, ndt acceptance rate, ncr customer accept, annual pipeline value, indirect man hours.

Product Wise Performance Ppt PowerPoint Presentation Summary Slideshow
This is a product wise performance ppt powerpoint presentation summary slideshow. This is a two stage process. The stages in this process are product wise performance, product wise performance.

Cash Flow Statement Kpis Tabular Form Ppt PowerPoint Presentation Infographics File Formats
This is a cash flow statement kpis tabular form ppt powerpoint presentation infographics file formats. This is a four stage process. The stages in this process are operations, investing activities, financing activities, net increase in cash.

Cash Flow Statement Kpis Tabular Form Ppt PowerPoint Presentation Layouts Grid
This is a cash flow statement kpis tabular form ppt powerpoint presentation layouts grid. This is a four stage process. The stages in this process are operations, financing activities, investing activities, net increase in cash.

Cash Flow Statement Kpis Template 2 Ppt PowerPoint Presentation Summary Guidelines
This is a cash flow statement kpis template 2 ppt powerpoint presentation summary guidelines. This is a four stage process. The stages in this process are operations, investing activities, net increase in cash, financing activities.
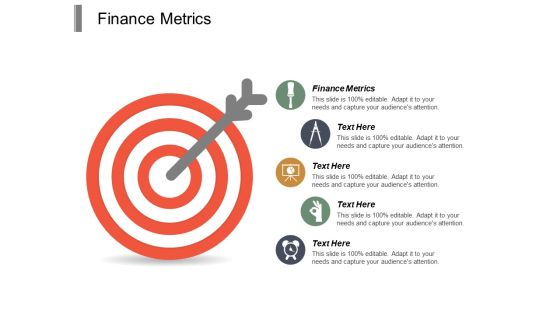
Finance Metrics Ppt PowerPoint Presentation Outline Professional Cpb
This is a finance metrics ppt powerpoint presentation outline professional cpb. This is a five stage process. The stages in this process are finance metrics.

Data Record Quality Enhancement Metrics Icon Rules PDF
Presenting Data Record Quality Enhancement Metrics Icon Rules PDF to dispense important information. This template comprises Four stages. It also presents valuable insights into the topics including Data Record Quality, Enhancement Metrics. This is a completely customizable PowerPoint theme that can be put to use immediately. So, download it and address the topic impactfully.
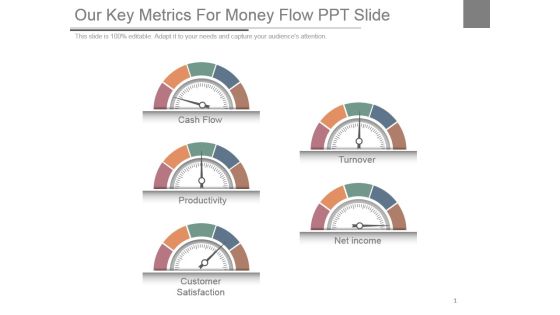
Our Key Metrics For Money Flow Ppt Slide
This is a our key metrics for money flow ppt slide. This is a five stage process. The stages in this process are cash flow, productivity, customer satisfaction, turnover, net income.
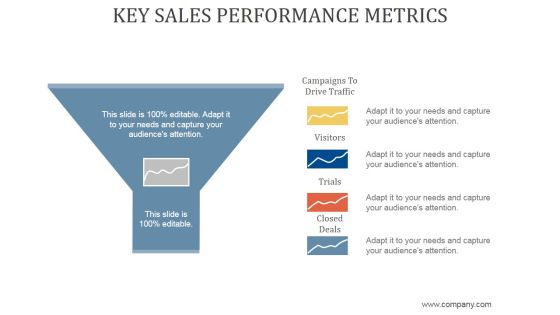
Key Sales Performance Metrics Ppt PowerPoint Presentation Samples
This is a key sales performance metrics ppt powerpoint presentation samples. This is a four stage process. The stages in this process are campaigns to drive traffic, visitors, trials, closed deals.
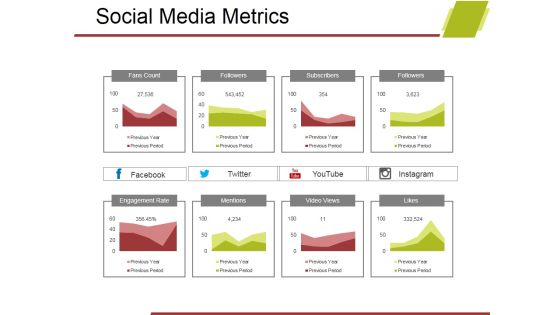
Social Media Metrics Ppt PowerPoint Presentation Styles Topics
This is a social media metrics ppt powerpoint presentation styles topics. This is a eight stage process. The stages in this process are fans count, followers, subscribers, engagement rate, mentions, video views, likes.
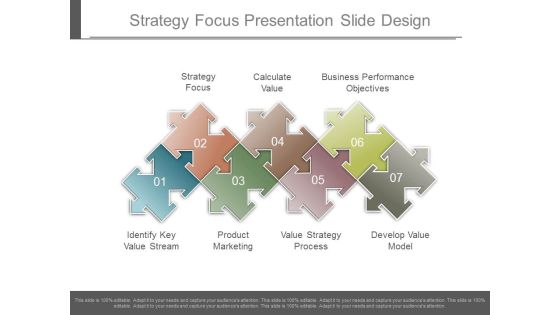
Strategy Focus Presentation Slide Design
This is a strategy focus presentation slide design. This is a seven stage process. The stages in this process are strategy focus, calculate value, business performance objectives, identify key value stream, product marketing, value strategy process, develop value model.

Value Strategy Process Good Ppt Example
This is a value strategy process good ppt example. This is a seven stage process. The stages in this process are identify key value stream, product marketing, strategy focus, value strategy process, calculate value, business performance objectives, develop value model.
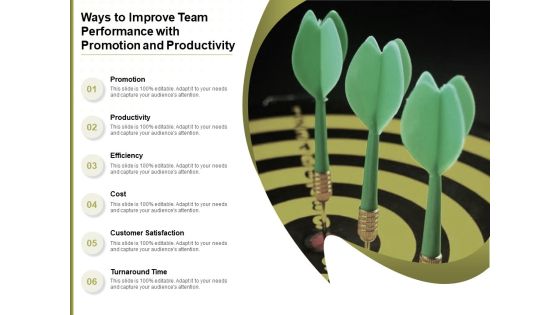
Ways To Improve Team Performance With Promotion And Productivity Ppt PowerPoint Presentation File Objects PDF
Presenting this set of slides with name ways to improve team performance with promotion and productivity ppt powerpoint presentation file objects pdf. This is a six stage process. The stages in this process are promotion, productivity, efficiency, cost, customer satisfaction, turnaround time. This is a completely editable PowerPoint presentation and is available for immediate download. Download now and impress your audience.
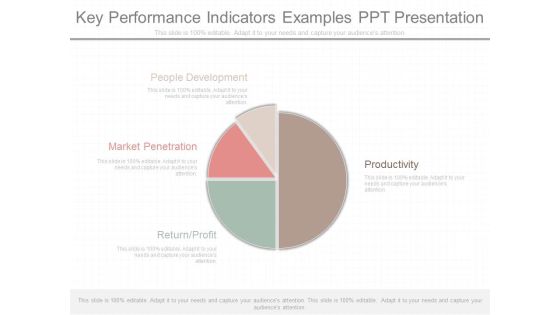
Key Performance Indicators Examples Ppt Presentation
This is a key performance indicators examples ppt presentation. This is a four stage process. The stages in this process are people development, productivity, market penetration, return profit.
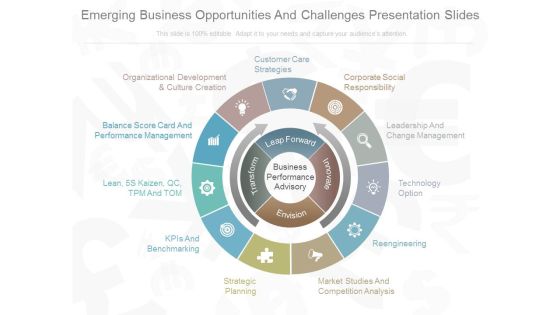
Emerging Business Opportunities And Challenges Presentation Slides
This is a emerging business opportunities and challenges presentation slides. This is a eleven stage process. The stages in this process are business performance advisory, leap forward, transform, envision, innovate, customer care strategies, corporate social responsibility, leadership and change management, technology option, reengineering, market studies and competition analysis, strategic planning, kpis and benchmarking, lean, 5s kaizen, qc, tpm and tom, balance score card and performance management, organizational development and culture creation.
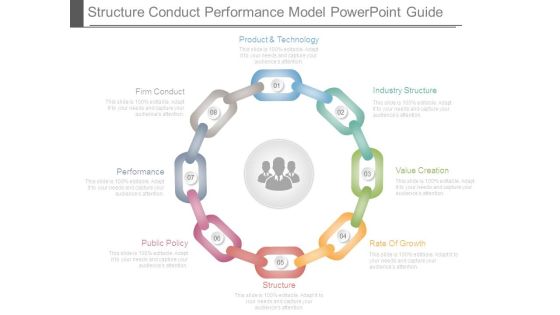
Structure Conduct Performance Model Powerpoint Guide
This is a structure conduct performance model powerpoint guide. This is a eight stage process. The stages in this process are product and technology, industry structure, value creation, rate of growth, structure, public policy, performance, firm conduct.

Sales Team Performance Evaluation Presentation Powerpoint
This is a sales team performance evaluation presentation powerpoint. This is a eight stage process. The stages in this process are competition, territories, customer satisfaction, market profile, field team size and skills, product and pricing, customer segments, call cycles.
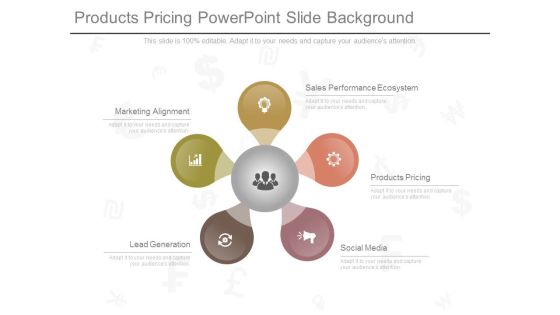
Products Pricing Powerpoint Slide Background
This is a products pricing powerpoint slide background. This is a five stage process. The stages in this process are marketing alignment, sales performance ecosystem, products pricing, social media, lead generation.

Kpi Dashboard Framework Ppt Powerpoint Slide Images
This is a kpi dashboard framework ppt powerpoint slide images. This is a five stage process. The stages in this process are business metrics, customer metrics, operational metrics, channel metrics, marketing metrics.

Promotes Performance And Motivation Sample Presentation Ppt
This is a promotes performance and motivation sample presentation ppt. This is a seven stage process. The stages in this process are promotes performance and motivation, employee engagement, equality and diversity, health and safety, economic growth, products that contribute to increased security, social contributions.

Office Workplace Productivity Study Powerpoint Topics
This is a office workplace productivity study powerpoint topics. This is a one stage process. The stages in this process are workplace satisfaction, job performance, job satisfaction, innovation.
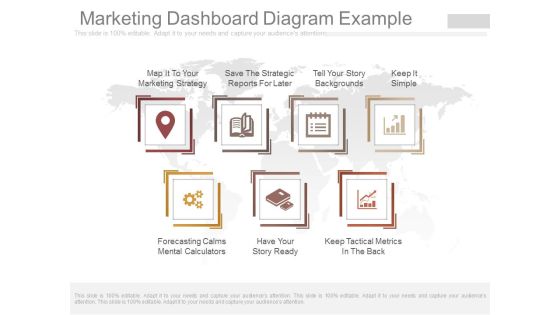
Marketing Dashboard Diagram Example
This is a marketing dashboard diagram example. This is a seven stage process. The stages in this process are map it to your marketing strategy, save the strategic reports for later, tell your story backgrounds, keep it simple, forecasting calms mental calculators, have your story ready, keep tactical metrics in the back.

Product Service Development Design Powerpoint Images
This is a product service development design powerpoint images. This is a nine stage process. The stages in this process are prototyping, research, research, performance tuning, development, qi and testing, posting and cross platform migration, support and maintenance.

Process Manufacturing Overview Diagram Powerpoint Templates
This is a process manufacturing overview diagram powerpoint templates. This is a four stage process. The stages in this process are processing, controlling, sequencing, calculation.

Big Data Technologies Ppt PowerPoint Presentation Backgrounds
This is a big data technologies ppt powerpoint presentation backgrounds. This is a nine stage process. The stages in this process are crowd sourcing, data fusion, data integration, genetic algorithm, machine learning, simulation.

Example Of Cost Cutting Strategies For Business Ppt Powerpoint Show
This is a example of cost cutting strategies for business ppt powerpoint show. This is a one stage process. The stages in this process are low cost country sourcing, component consolidation, supplier consolidation, request for quotation, design workshop with suppliers, supplier cost breakdown analysis, product benchmarking, design to cost, function cost analysis, cost driver analysis, reverse costing, design for manufacture, competitive benchmarking, value analysis.
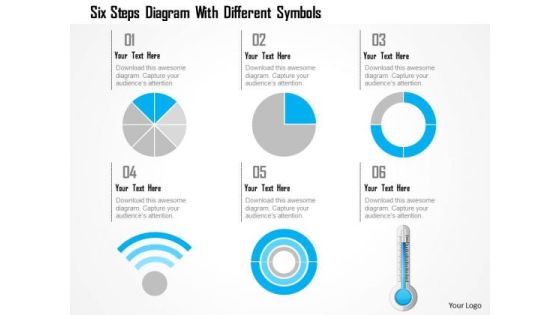
Business Diagram Six Steps Diagram With Different Symbols Presentation Template
This power point template has been crafted with graphic of 3d pie charts with Wi-Fi symbol and thermometer. This PPT contains the concept of calculation and result analysis. Use this PPT for your business and science related presentations.

Activity Based Costing Example Ppt Slides
This is a activity based costing example ppt slides. This is a five stage process. The stages in this process are identify activities, estimate costs, assigns costs, calculate costs, prepare reports.

Business Profit Statistical Analysis Presentation Background Images
This is a business profit statistical analysis presentation background images. This is a five stage process. The stages in this process are collection of data, organization of data, interpretation of data, calculate results, analyze results.

Search Engine Rankings Ppt PowerPoint Presentation Gallery Summary
This is a search engine rankings ppt powerpoint presentation gallery summary. This is a three stage process. The stages in this process are summary top 3 results, search engine ranking, keyword, benchmark.

Business Objects Strategy Management Diagram Presentation Slides
This is a business objects strategy management diagram presentation slides. This is a three stage process. The stages in this process are goals, decisions, kpis, initiatives.

Defacto Performance Management Plan Ppt Example
This is a defacto performance management plan ppt example. This is a five stage process. The stages in this process are model, goals, plan, kpis, analyze.

Organizational Development Interventions Powerpoint Presentation Examples
This is a organizational development interventions powerpoint presentation examples. This is a six stage process. The stages in this process are implement intervention, investigate problem nee to change, evaluate performance and learning, design intervention and results expectation, desire to improve or change, explore solutions and benchmarks.
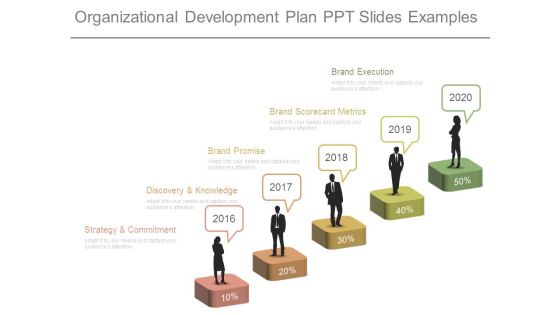
Organizational Development Plan Ppt Slides Examples
This is a organizational development plan ppt slides examples. This is a five stage process. The stages in this process are strategy and commitment, discovery and knowledge, brand promise, brand scorecard metrics, brand execution.

Prospect Needs Analysis Powerpoint Slides Themes
This is a prospect needs analysis powerpoint slides themes. This is a four stage process. The stages in this process are prospect needs analysis, online market access, digital marketing, roadmap, marketing kpis, action plan.

Business Kpi Dashboard Diagram Powerpoint Templates
This is a business kpi dashboard diagram powerpoint templates. This is a six stage process. The stages in this process are analytics, cost per sales, reporting, kpis, dashboard, visualization.
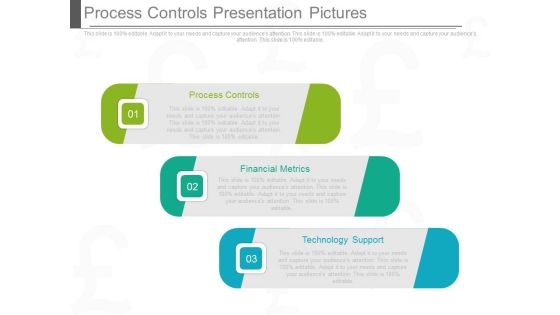
Process Controls Presentation Pictures
This is a process controls presentation pictures. This is a three stage process. The stages in this process are process controls, financial metrics, technology support.
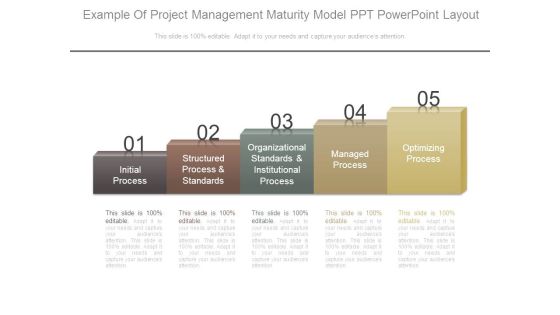
Example Of Project Management Maturity Model Ppt Powerpoint Layout
This is a example of project management maturity model ppt powerpoint layout. This is a five stage process. The stages in this process are initial process, structured process and standards, organizational standards and institutional process, managed process, optimizing process.
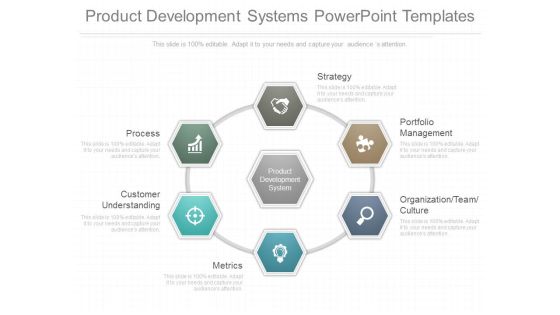
Product Development Systems Powerpoint Templates
This is a product development systems powerpoint templates. This is a seven stage process. The stages in this process are process, customer understanding, metrics, organization team culture, portfolio management, strategy.

Evaluating The Rough Research Ppt PowerPoint Presentation Show
This is a evaluating the rough research ppt powerpoint presentation show. This is a two stage process. The stages in this process are overall project performance, product need, threat from competitors, feasibility, key performance indicators.

Business Analysis Vs Business Intelligence Ppt Powerpoint Layout
This is a business analysis vs business intelligence ppt powerpoint layout. This is a five stage process. The stages in this process are business intelligence, oriented to standard and consistent metrics analysis, focused on dashboards and predefined reports, primarily answers predefined questions, provides end users indirect raw data access through cubes, reports and summarized data, exception based reporting, oriented to wards ad hoc analysis of past performance, focused on interactive and investigative analysis by user, business analytics, primarily used to derive new insights and understanding, explore the unknown and discover new patterns, relies on low level data to provide visibility to unexpected activity.

Business Analysis Vs Business Analytics Diagram Ppt Slides
This is a business analysis vs business analytics diagram ppt slides. This is a one stage process. The stages in this process are area, main focus, architectural domains, requirements, project management, business analysis, functions and process, enterprise? process technology organisation, functionality software configuration and development, sdlc, business analytics, data and reporting, data information technology, reports, dashboards and kpis data consolidation and presention, sdlc agile.

Five S Method Of Improvement Ppt Sample
This is a five s method of improvement ppt sample. This is a five stage process. The stages in this process are set in order, sort, shine, standardize, sustain.

Basis For Annual Accounts Plan Powerpoint Slides
This is a basis for annual accounts plan powerpoint slides. This is a five stage process. The stages in this process are basis for annual accounts plan, focus on growing relationship equity, relationship metrics, relationship map and vectors, account strategy.
