Math Powerpoint

Change Management Strategy Ppt PowerPoint Presentation Template
This is a change management strategy ppt powerpoint presentation template. This is a five stage process. The stages in this process are visible change leadership, smart engagement and communication, strong individual performance, supportive organization and culture, meaningful change measurement.
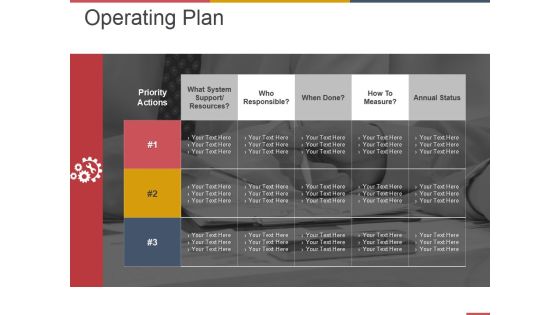
Operating Plan Ppt PowerPoint Presentation Portfolio Example
This is a operating plan ppt powerpoint presentation portfolio example. This is a three stage process. The stages in this process are priority actions, what system support resources, how to measure.

Operating Plan Ppt PowerPoint Presentation Ideas Outline
This is a operating plan ppt powerpoint presentation ideas outline. This is a three stage process. The stages in this process are priority actions, what system support resources, who responsible, when done, how to measure.

Agenda Ppt Powerpoint Presentation Styles Templates
This is a agenda ppt powerpoint presentation styles templates. This is a six stage process. The stages in this process are about us, ideas for success, partnership contract, measuring growth.

Operating Plan Ppt PowerPoint Presentation Ideas Aids
This is a operating plan ppt powerpoint presentation ideas aids. This is a three stage process. The stages in this process are priority actions, who responsible, how to measure, when done.
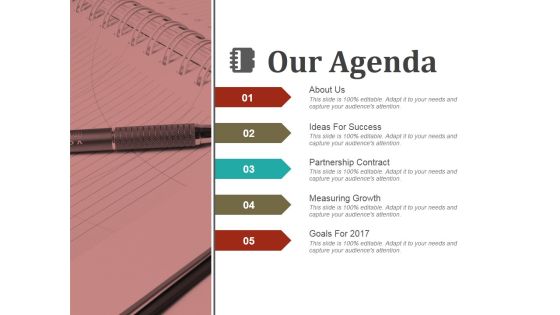
Our Agenda Ppt PowerPoint Presentation Infographics
This is a our agenda ppt powerpoint presentation infographics. This is a five stage process. The stages in this process are about us, ideas for success, partnership contract, measuring growth.

Dashboard Ppt PowerPoint Presentation File Slide
This is a dashboard ppt powerpoint presentation file slide. This is a one stage process. The stages in this process are high speed performance on, business, marketing, meter, measure.

Deck Outline Ppt PowerPoint Presentation Layouts Portrait
This is a deck outline ppt powerpoint presentation layouts portrait. This is a ten stage process. The stages in this process are introduction, planning and forecasting, inventory management, performance measures, strategic sourcing process, scm decision phases.

Empathy Map Ppt PowerPoint Presentation Infographics Gallery
This is a empathy map ppt powerpoint presentation infographics gallery. This is a one stage process. The stages in this process are pain, feels, frustrations, gain, measure of success.
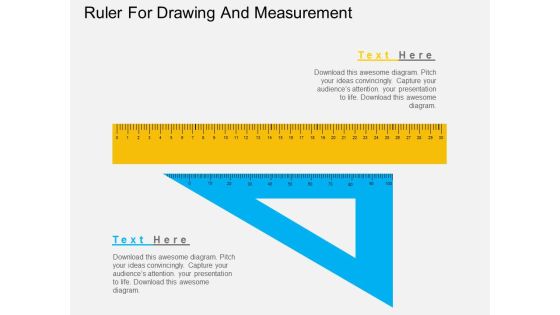
Ruler For Drawing And Measurement Powerpoint Templates
Create dynamic presentations with our professional template containing diagram of ruler. This diagram is useful to display drawing and measurement. Download this template to leave permanent impression on your audience.

Measuring Customer Feedback Ppt Presentation Powerpoint
This is a measuring customer feedback ppt presentation powerpoint. This is a four stage process. The stages in this process are advice, partnership, availability, accuracy.

Measuring Sales Effectiveness Ppt Presentation Powerpoint
This is a measuring sales effectiveness ppt presentation powerpoint. This is a three stage process. The stages in this process are knowledge, behavior, application practice.

Ppt Linear Arrow 12 Stages PowerPoint Templates
PPT linear arrow 12 stages PowerPoint Templates-This PPT is made of Linear arrows. This graphics is of superlative quality that makes an attractive presentation. This template is quite a remedy to present any process-PPT linear arrow 12 stages PowerPoint Templates-Arrow, Background, Collection, Completed, Concept, Confirmation, Design, Flow, Graph, Graphic, Illustration, Indication, Indicator, Information, Instruction, Interface, Internet, Layout, Measurement, Order, Phase, Pointer, Process, Progress, Reflection, Scale, Shape, Sign

TQM Pyramid Ppt PowerPoint Presentation Layouts Backgrounds
Presenting this set of slides with name tqm pyramid ppt powerpoint presentation layouts backgrounds. This is a five stage process. The stages in this process are tqm, culture, leadership, involvement, process quality, customer driven, values empowerment continuous improvement, ownership management support mission planning vision, rewards recognition training, teams, awareness empowerment, partnership, measurement informatics spc, cost quality documentation, reporting testing, tools, presentation. This is a completely editable PowerPoint presentation and is available for immediate download. Download now and impress your audience.
Scale With Four Business Icons Powerpoint Templates
Develop competitive advantage with our above template which contains scale diagram with four business icons. This diagram helps to display how to measure business performance. You can edit text, color, shade and style as per you need.

Clock With Planning Icons Powerpoint Template
This professionally designed business diagram is as an effective tool for communicating time planning related concepts. You can also use this diagram to visually support your content. Above slide is suitable for business presentation.

Stopwatch With Process Completion Chart Powerpoint Template
Download this exclusive business diagram to display importance of time. This slide contains the graphic of stopwatch with process competition chart. This diagram is useful for business presentations.
Two Web User Element Diagram Powerpoint Template
Visually support your presentation with our above template of modern business infographic. This slide has been professionally designed to display business information. This template offers an excellent background to build impressive presentation.

Watch For Perfect Time Planning Powerpoint Template
Our compelling template consists with diagram of watch. This slide has been professionally designed to display perfect time planning. This template offers an excellent background to build impressive presentation.
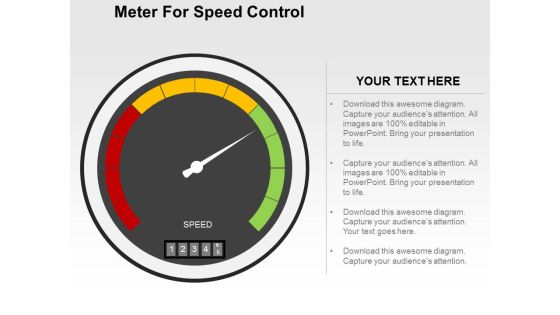
Meter For Speed Control Powerpoint Templates
Our professionally designed business diagram is as an effective tool for communicating business ideas and strategies for corporate planning. It contains graphics of speed control meter. Above slide is suitable to display business options with technology.
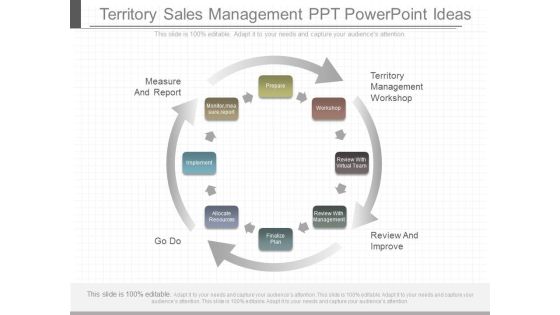
Territory Sales Management Ppt Powerpoint Ideas
This is a territory sales management ppt powerpoint ideas. This is a eight stage process. The stages in this process are measure and report, go do, review and improve, territory management workshop, prepare, monitor measure report, implement, allocate resources, finalize plan, review with management, review with virtual team, workshop.

Shareholder Value Management Ppt Powerpoint Images
This is a shareholder value management ppt powerpoint images. This is a nine stage process. The stages in this process are planning, budgeting and forecasting, strategic planning, business planning, budgeting, reporting and performance measurement, forecasting, reporting financial and operational, performance measurement, organizational alignment and accountability, analysis, monitor individual results, reward results.

Integrated The Key Performance Powerpoint Slide Ideas
This is a integrated the key performance powerpoint slide ideas. This is a three stage process. The stages in this process are shareholder value, reward results, monitor individual results, analysis, performance measurement, reporting, business planning, budgeting, forecasting, strategic planning, planning, budgeting and forecasting, reporting and performance measurement, organizational alignment and accountability.

Six Methods Timeline Powerpoint Slide Themes
This is a six methods timeline powerpoint slide themes. This is a five stage process. The stages in this process are define, measure, analyze, improve design, control verify, build project from nonconformance, feedback and audits, collect measurements, analyze processes online, correct, design, train and document, monitor live dashboard.

Stock Photo Measuring Tape Construction PowerPoint Slide
This image displays graphic of Measuring Tape on white background. Use this image to depict concept of measurement and engineering. Use this image and make an impressive presentation.

Stock Photo Measuring Tape PowerPoint Slide
This image displays graphic of Measuring Tape on white background. Use this image to depict concept of measurement and engineering. Use this image and make an impressive presentation.

Circular Performance Measurement Metrics PowerPoint Templates
Communicate with your group through this slide of circles. It will facilitate understanding of your views. This diagram can be used to display performance measurement in business presentations.
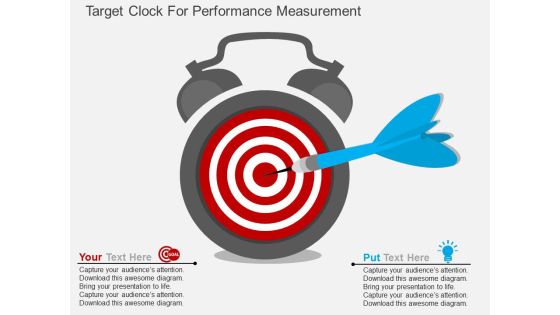
Target Clock For Performance Measurement Powerpoint Template
Create dynamic presentations with our professional template containing target clock. This diagram is useful to display performance measurement. Download this template to leave permanent impression on your audience.

Business Framework Build Measure Learn PowerPoint Presentation
This business power point diagram slide has been designed with build measure learn. This is used in lean manufacturing system where you have to show continuous deployment and minimal viable production. Use this PPT slide in your production related presentations.

Business Framework Demand Measurement PowerPoint Presentation
This image slide displays demand measurement business framework. Use this image slide to express views on segmentation in marketing. You may change color size and orientation of any icon to your liking. Create professional presentations by using this image slide.
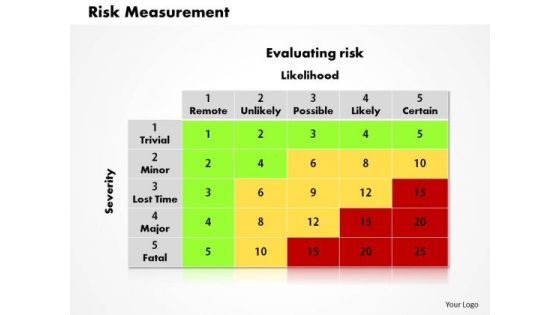
Business Framework Risk Measurement PowerPoint Presentation
The above slide has framework of risk measurement. Use this diagram for giving a clear message in a structured manner. This template helps you to grab the attention of your listener.
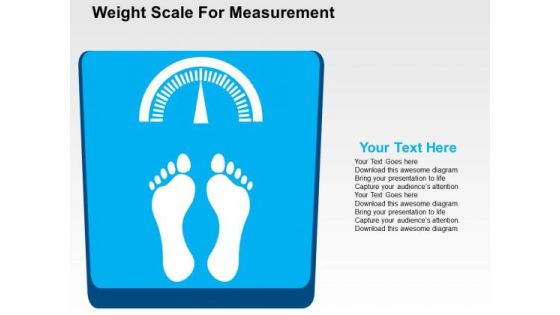
Weight Scale For Measurement PowerPoint Template
Our above template contains a graphic of weight scale with foot prints. You may use this diagram to display information in visual manner. Create captivating presentations using this business diagram.

Business Framework Exchange Rate Relationship PowerPoint Presentation
This business framework power point template diagram has been designed with graphic of four text boxes. This PPT diagram contains the concept of exchange rate. This PPT diagram may be used for relationship and mathematical formulas related topics.

Six Sigma Tools Flowchart Powerpoint Guide
This is a six sigma tools flowchart powerpoint guide. This is a five stage process. The stages in this process are six sigma, cycle time reduction, defect reduction, cross function process mapping, developing six sigma software, Define Measure Analyze Improve Control, Define Measure Analyze Design Verify, Define Measure Analyze Design Optimize Verify, Improving Cross functional Processes, Software Development, Improving Existing Cross functional Processes, Designing New Processes, Design and Manufacture.

Business Framework Lean Kaizen PowerPoint Presentation
Above business slide provides framework of lean kaizen. It contains graphics of linear arrows. This lean kaizen diagram is based on the approach of process improvement. This diagram defines basic steps of business process like define, measure analyze, improve and control.Use this professional and customized business diagram in your PowerPoint presentations.

Identify Areas For Improvement Powerpoint Slides Background
This is a identify areas for improvement powerpoint slides background. This is a six stage process. The stages in this time process are set goals and objectives and detailed timeline, products high level time line, manage performance and measure success of change against metrics, determine objective, identify areas for improvement, communication and engagement with staff.

Products High Level Timeline Powerpoint Layout
This is a products high level timeline powerpoint layout. This is a six stage process. The stages in this process are determine objective, products high level time line, identify areas for improvement, communication and engagement with staff, set goals and objectives and detailed timeline, manage performance and measure success of change against metrics.
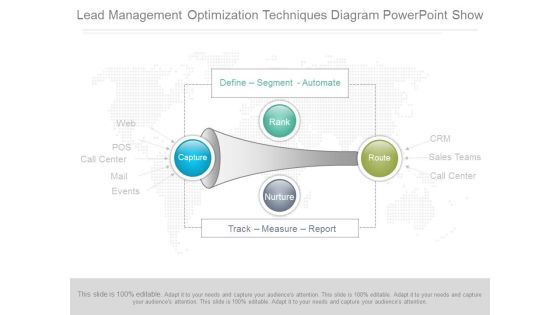
Lead Management Optimization Techniques Diagram Powerpoint Show
This is a lead management optimization techniques diagram powerpoint show. This is a four stage process. The stages in this process are web, pos, call center, mail, events, capture, nurture, rank, route, define segment automate, track measure report, crm, sales teams, call center.
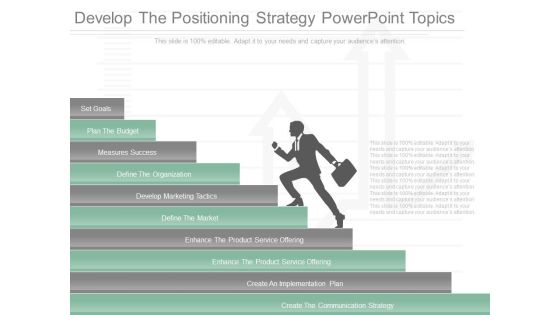
Develop The Positioning Strategy Powerpoint Topics
This is a develop the positioning strategy powerpoint topics. This is a ten stage process. The stages in this process are set goals, plan the budget, measures success, define the organization, develop marketing tactics, define the market, enhance the product service offering, enhance the product service offering, create an implementation plan, create the communication strategy.

Ppc Management Techniques Diagram Powerpoint Ideas
This is a ppc management techniques diagram powerpoint ideas. This is a seven stage process. The stages in this process are measuring keyword intent, diverse strategy, quality score best practices, conversion and monetization, visibility across multiple platforms, outside the box testing, deep review of analytics data, ppc success.
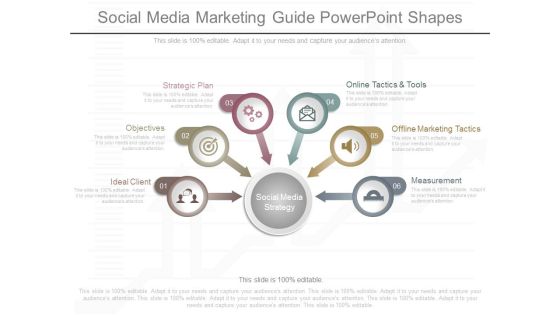
Social Media Marketing Guide Powerpoint Shapes
This is a social media marketing guide powerpoint shapes. This is a six stage process. The stages in this process are offline marketing tactics , measurement , online tactics and tools , strategic plan , objectives , ideal client , social media strategy.
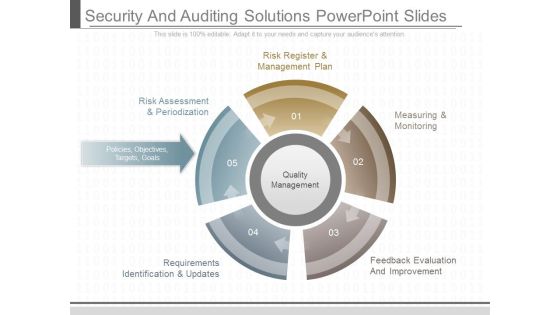
Security And Auditing Solutions Powerpoint Slides
This is a security and auditing solutions powerpoint slides. This is a five stage process. The stages in this process are risk register and management plan, risk assessment and periodization, policies objectives targets goals, requirements identification and updates, measuring and monitoring, feedback evaluation and improvement, quality management.
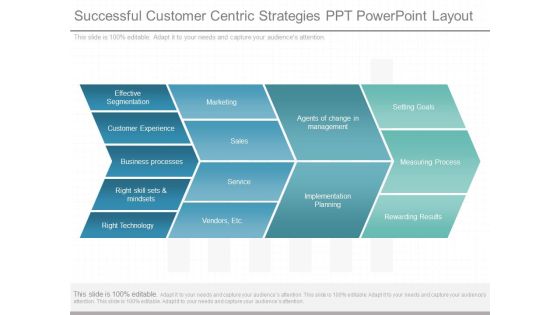
Successful Customer Centric Strategies Ppt Powerpoint Layout
This is a successful customer centric strategies ppt powerpoint layout. This is a four stage process. The stages in this process are effective segmentation, customer experience, business processes, right skill sets and mindsets, right technology, sales, service, vendors, etc, agents of change in management, implementation planning, setting goals, measuring process, rewarding results.
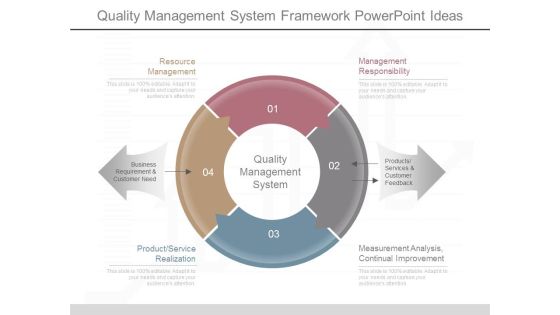
Quality Management System Framework Powerpoint Ideas
This is a quality management system framework powerpoint ideas. This is a four stage process. The stages in this process are resource management, product service realization, measurement analysis continual improvement, management responsibility, quality management system, business requirement and customer need, products services and customer, feedback.

Agendas For Sales Meetings Diagram Powerpoint Slides
This is a agendas for sales meetings diagram powerpoint slides. This is a five stage process. The stages in this process are decision tool for invitees, guide to aid invitees prepare, structural tool, device of control, measure of success or failure.
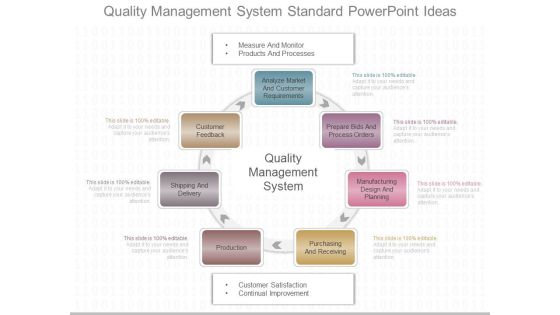
Quality Management System Standard Powerpoint Ideas
This is a quality management system standard powerpoint ideas. This is a seven stage process. The stages in this process are analyze market and customer requirements, prepare bids and process orders, manufacturing design and planning, purchasing and receiving, production, shipping and delivery, customer feedback, quality management system, measure and monitor, products and processes, customer satisfaction, continual improvement.
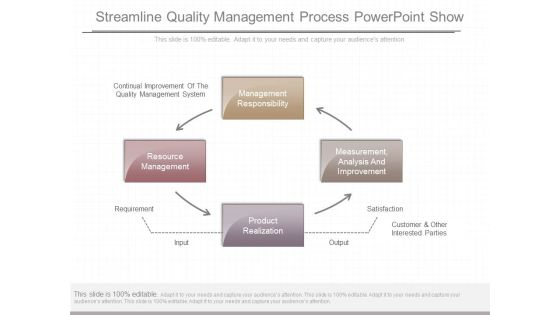
Streamline Quality Management Process Powerpoint Show
This is a streamline quality management process powerpoint show. This is a four stage process. The stages in this process are management responsibility, measurement analysis and improvement, product realization, resource management, requirement, input, output, satisfaction, customer and other interested parties, continual improvement of the quality management system.
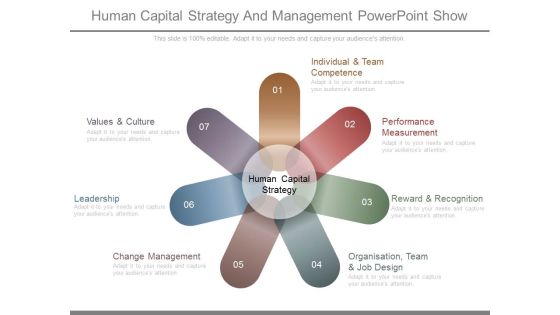
Human Capital Strategy And Management Powerpoint Show
This is a human capital strategy and management powerpoint show. This is a seven stage process. The stages in this process are individual and team competence, performance measurement, reward and recognition, organisation, team and job design, change management, leadership, values and culture, human capital strategy.

Content Marketing Automation Diagram Content Powerpoint Templates
This is a content marketing automation diagram content powerpoint templates. This is a eight stage process. The stages in this process are emails triggered based on behavior and demographics, demographic and, behavioral scoring of prospect , sales, measure, analyze and improve, marketing, automation database, web form, website, search.

Collaboration And Knowledge Sharing Powerpoint Graphics
This is a collaboration and knowledge sharing powerpoint graphics. This is a five stage process. The stages in this process are collaboration and knowledge sharing, information management, policy and, procedure framework, open source procurement, proposed open government, framework, government services, performance measurement.
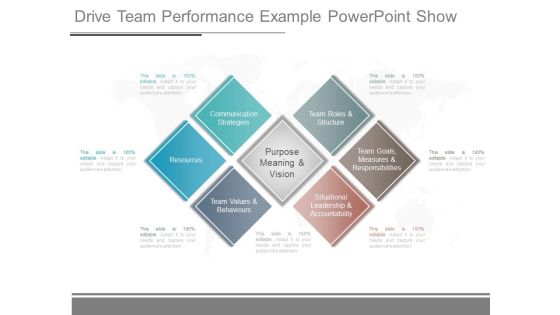
Drive Team Performance Example Powerpoint Show
This is a drive team performance example powerpoint show. This is a six stage process. The stages in this process are communication strategies, resources, team values and behaviours, purpose meaning and vision, team roles and structure, team goals, measures and responsibilities, situational leadership and accountability.

Operational Efficiency Example Diagram Powerpoint Show
This is a operational efficiency example diagram powerpoint show. This is a eight stage process. The stages in this process are developing skills and resources, tools and infrastructure, governance, measurements, initiative identification discovery, linking initiative and strategy, initiative execution, methods and standards, operational efficiency.

Perspective Performance Indicator Ppt Powerpoint Slide Designs
This is a perspective performance indicator ppt powerpoint slide designs. This is a seven stage process. The stages in this process are performance indicator, perspective, unit, description formula, data source, measurement instrument, method of test how, frequency when, decision criteria, data collector who, owner, baseline, target, process diagram or drawings.

Agile Information Governance Process Ppt Powerpoint Layout
This is a agile information governance process ppt powerpoint layout. This is a six stage process. The stages in this process are define business problem, obtain executive sponsors, align teams, understand data risk and value, implement project, measure results, plan, act, assess.
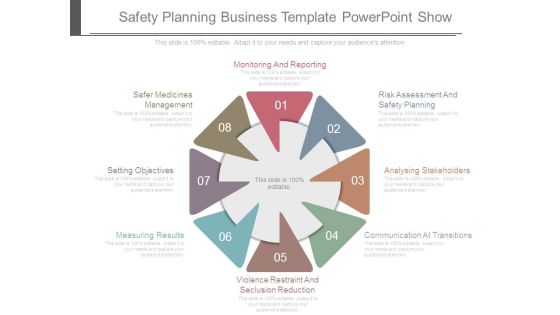
Safety Planning Business Template Powerpoint Show
This is a safety planning business template powerpoint show. This is a eight stage process. The stages in this process are monitoring and reporting, risk assessment and safety planning, analysing stakeholders, communication at transitions, violence restraint and seclusion reduction, measuring results, setting objectives, safer medicines management.
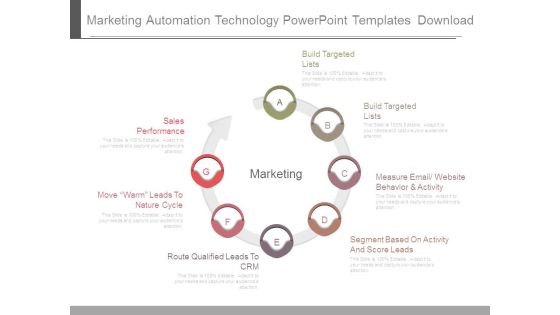
Marketing Automation Technology Powerpoint Templates Download
This is a marketing automation technology powerpoint templates download. This is a seven stage process. The stages in this process are build targeted lists, build targeted lists, measure email website behavior and activity, segment based on activity and score leads, sales performance, move warm leads to nature cycle, route qualified leads to crm, marketing.
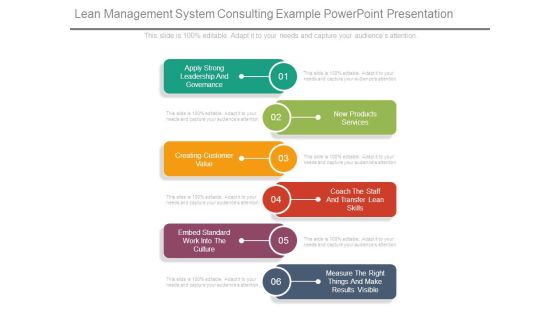
Lean Management System Consulting Example Powerpoint Presentation
This is a lean management system consulting example powerpoint presentation. This is a six stage process. The stages in this process are apply strong leadership and governance, new products services, creating customer value, coach the staff and transfer lean skills, embed standard work into the culture, measure the right things and make results visible.

Accessibility Administration Ppt Diagram Powerpoint Slide Introduction
This is a accessibility administration ppt diagram powerpoint slide introduction. This is a six stage process. The stages in this process are produce and maintain availability plan, provide advice and guidance, assist with diagnosis, availability management objective, assess impact of changes, ensuring proactive measures, undertaking tuning activities.
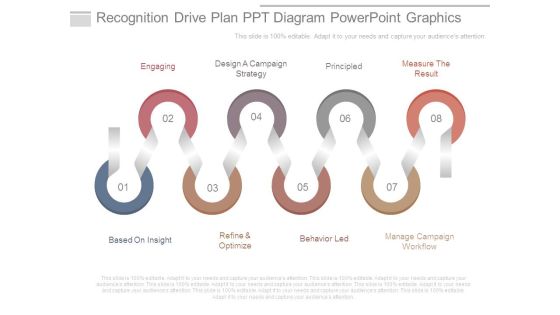
Recognition Drive Plan Ppt Diagram Powerpoint Graphics
This is a recognition drive plan ppt diagram powerpoint graphics. This is a eight stage process. The stages in this process are engaging, design a campaign strategy, principled, measure the result, based on insight, refine and optimize, behavior led, manage campaign workflow.
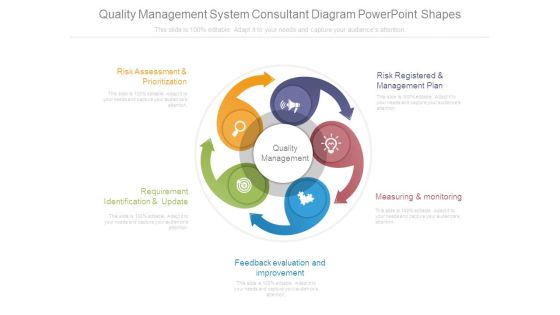
Quality Management System Consultant Diagram Powerpoint Shapes
This is a quality management system consultant diagram powerpoint shapes. This is a five stage process. The stages in this process are risk assessment and prioritization, requirement identification and update, feedback evaluation and improvement, measuring and monitoring, risk registered and management plan.

Dmaic Improvement Process Powerpoint Templates Download
This is a dmaic improvement process powerpoint templates download. This is a five stage process. The stages in this process are toll gate review, define the opportunities, measure the performance, analyse the performance, improve the performance, control the performance, activities to be executed at each phase, relational tools techniques acquired, expected deliverables at each phase.

The Damic Roadmap Powerpoint Slides Templates
This is a the damic roadmap powerpoint slides templates. This is a five stage process. The stages in this process are define the opportunities, measure the performance, analyse the performance, improve the performance, control the performance, toll gate review, activities to be executed at each phase, relational tools techniques acquired, expected deliverables at each phase.
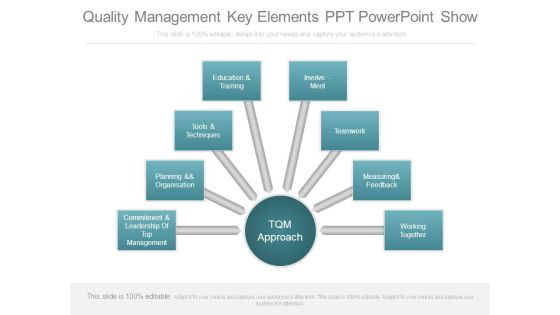
Quality Management Key Elements Ppt Powerpoint Show
This is a quality management key elements ppt powerpoint show. This is a eight stage process. The stages in this process are tqm approach, commitment and leadership of top management, planning and organisation, tools and techniques, education and training, involvement, teamwork, measuring and feedback, working together.
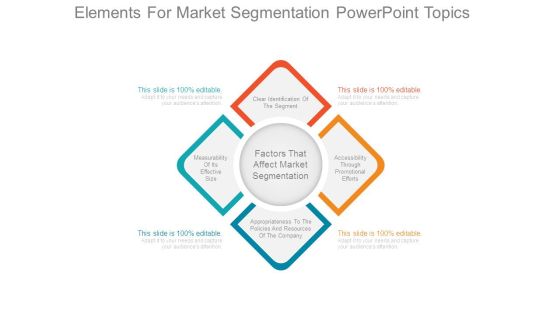
Elements For Market Segmentation Powerpoint Topics
This is a elements for market segmentation powerpoint topics. This is a four stage process. The stages in this process are clear identification of the segment, measurability of its effective size, accessibility through promotional efforts, appropriateness to the policies and resources of the company, factors that affect market segmentation.

Effective Lead Scoring Model Powerpoint Slide
This is a effective lead scoring model powerpoint slide. This is a six stage process. The stages in this process are measurable roi on lead generation program, increased conversion rates from qualified lead to opportunity, increased sales productivity and effectiveness, shortened sales cycle, better forecast and pipeline visibility, better alignment of marketing and sales efforts.
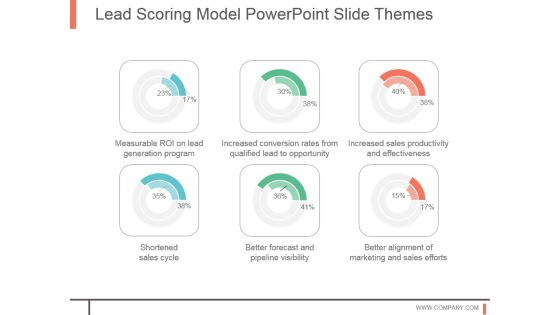
Lead Scoring Model Powerpoint Slide Themes
This is a lead scoring model powerpoint slide themes. This is a six stage process. The stages in this process are measurable roi on lead generation program, increased conversion rates from qualified lead to opportunity, increased sales productivity and effectiveness, shortened sales cycle, better forecast and pipeline visibility, better alignment of marketing and sales efforts.

Lead Scoring Chart Powerpoint Slide Background
This is a lead scoring chart powerpoint slide background. This is a six stage process. The stages in this process are measurable roi on lead generation program, increased conversion rates from qualified lead to opportunity, increased sales productivity and effectiveness, shortened sales cycle, better forecast and pipeline visibility, better alignment of marketing and sales efforts.
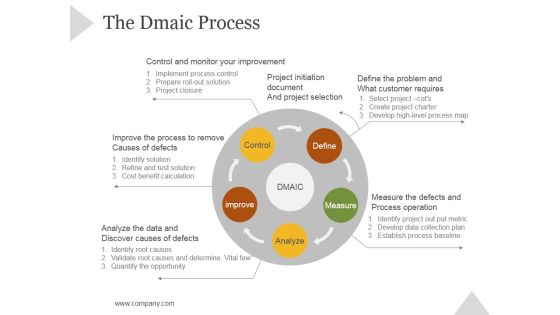
The Dmaic Process Ppt PowerPoint Presentation Model
This is a the dmaic process ppt powerpoint presentation model. This is a five stage process. The stages in this process are control and monitor your improvement, project initiation document, measure the defects and, process operation, define the problem and, what customer requires, improve the process to remove, causes of defects.

Lead Scoring Ppt PowerPoint Presentation Ideas
This is a lead scoring ppt powerpoint presentation ideas. This is a six stage process. The stages in this process are measurable roi on lead generation program, increased conversion rates from qualified lead to opportunity, increased sales productivity and effectiveness, better alignment of marketing and sales efforts, better forecast and pipeline visibility.

Lead Scoring Ppt PowerPoint Presentation Rules
This is a lead scoring ppt powerpoint presentation rules. This is a six stage process. The stages in this process are measurable roi on lead generation program, increased conversion rates from, qualified lead to opportunity, increased sales productivity and effectiveness, shortened sales cycle, better forecast and pipeline visibility.
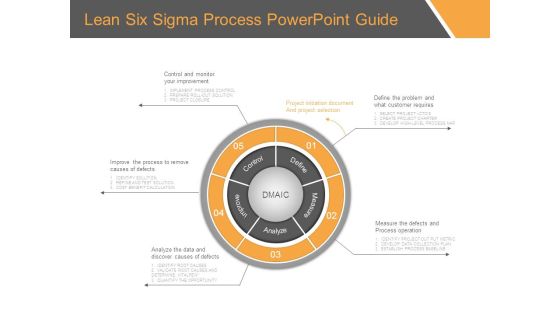
Lean Six Sigma Process Powerpoint Guide
This is a lean six sigma process powerpoint guide. This is a five stage process. The stages in this process are control, improve, analyze, measure, define, control and monitor your improvement, project initiation document and project selection, define the problem and what customer requires, improve the process to remove causes of defects, analyze the data and discover causes of defects, measure the defects and process operation, implement process control, prepare roll out solution, project closure, select project ctos, create project charter, develop high level process map, identify solution, refine and test solution, cost benefit calculation, identify root causes, validate root causes and determine vitalfew, quantify the opportunity, identify project out put metric, develop data collection plan, establish process baseline.

Two Steps Of Time Planning Powerpoint Template
Our professionally designed business diagram is as an effective tool for communicating concept of time planning. It contains graphics of business man with clock. Convey your views with this diagram slide. It will amplify the strength of your logic.

Infographic Layout With Clock Design Powerpoint Templates
This business slide has been designed with clock infographic. Use this diagram to exhibit time management concept. This slide is innovatively designed to highlight your worthy views.

Hand Holding Clock And Coins Powerpoint Template
Our professionally designed business diagram is as an effective tool for communicating business ideas and strategies for corporate planning. It contains graphics of hand holding clock and coins. Download this template to build interactive presentation.
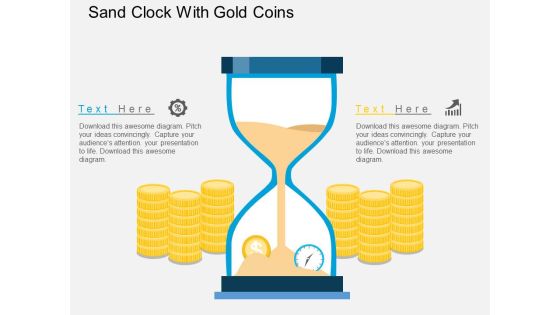
Sand Clock With Gold Coins Powerpoint Template
Our professionally designed business diagram is as an effective tool for communicating business ideas and strategies for corporate planning. This PPT slide contains sand clock with gold coins. Download this template to build interactive presentation.

Cost Of Education Money PowerPoint Template 1110
A calculator with a dollar sign on a blue book Cost of education
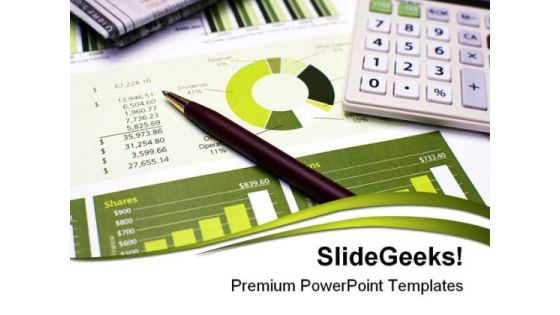
Financial Planning Money Business PowerPoint Template 1110
Financial Planning Pen and Calculator and Review of Year End Reports

Pdca Infographic Template Powerpoint Slide Backgrounds
This is a pdca infographic template powerpoint slide backgrounds. This is a five stage process. The stages in this process are define, measure, analyze, improve, control, project charter, critical to quality tree, pareto chart, solution analysis and selection, statistical process control, voice of the customer voice of the business, mesa, risk assessment, sustainability and benefits, process mao, summary statistic, cause and effect diagram, solution implementation, project handoff.

Quality Management Flow Chart Diagram Powerpoint Images
This is a quality management flow chart diagram powerpoint images. This is a four stage process. The stages in this process are project document, project quality management, plan quality management, control quality, perform quality assurance, develop project mgmt. plan, perform integrated, change control, project documents, enterprise, organization, quality mgmt plan, process impr plan, quality metrics, quality control measurements, project mgmt plan update, project document, change requests, project documents updates, organizational process asset update.
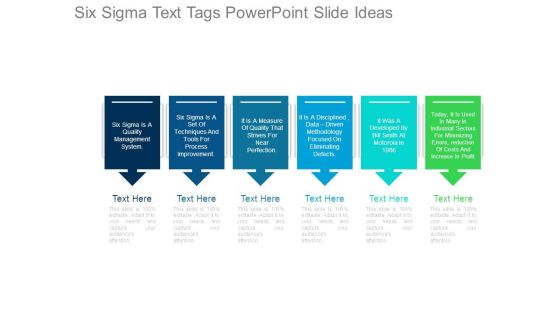
Six Sigma Text Tags Powerpoint Slide Ideas
This is a six sigma text tags powerpoint slide ideas. This is a six stage process. The stages in this process are six sigma is a quality management system, six sigma is a set of techniques and tools for process improvement, it is a measure of quality that strives for near perfection, it is a disciplined data driven methodology focused on eliminating defects, it was a developed by bill smith at motorola in 1986, today, it is used in many in industrial sectors for minimizing errors reduction of costs and increase in profit.
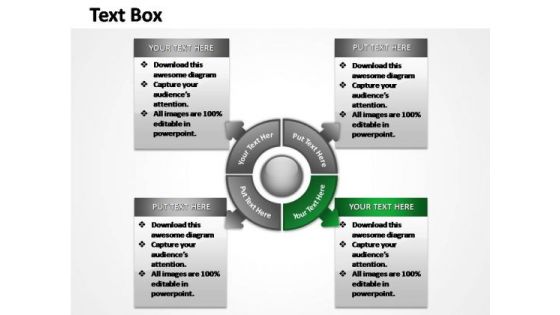
PowerPoint Slide Layout Business Steps Ppt Slides
Use this layout to define the outcome and the multiple possibilities in a way that is used in calculation of probabilities, genetics and strategic reasoning.
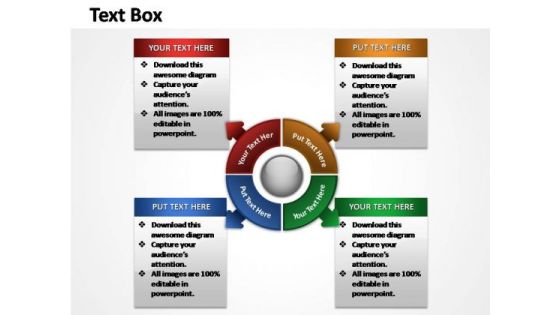
PowerPoint Slide Layout Success Steps Ppt Slides
Use this layout to define the outcome and the multiple possibilities in a way that is used in calculation of probabilities, genetics and strategic reasoning.
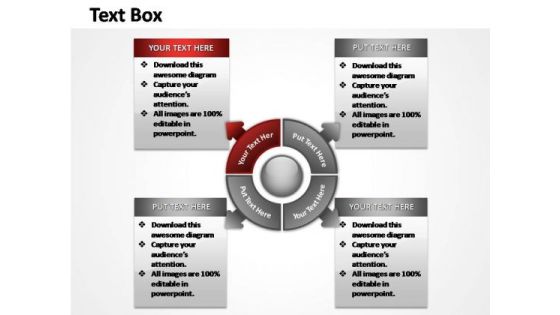
PowerPoint Slides Sales Steps Ppt Slides
Use this layout to define the outcome and the multiple possibilities in a way that is used in calculation of probabilities, genetics and strategic reasoning.
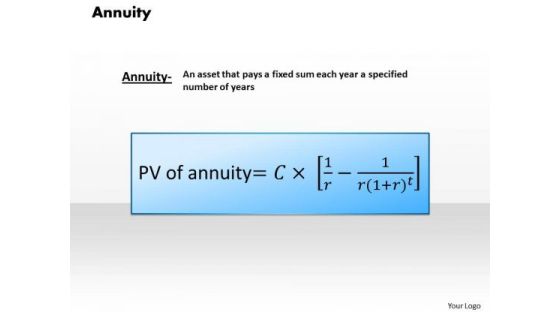
Business Framework Annuity PowerPoint Presentation 2
Thia diagram displays calculations of annuity. Use this annuity diagram in business and finance related topic. Annuity is return on investment fund.

Business Framework Call Options PowerPoint Presentation
this professional PPT slide has been crafted with graphic of call option calculation with graph. Use this analysis diagram in your business presentation to show overall growth.
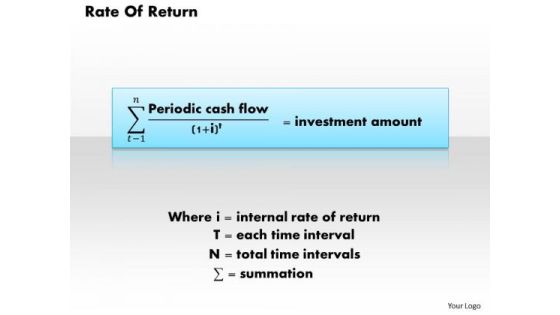
Business Framework Rate Of Return PowerPoint Presentation
Our above diagram displays formula to calculate rate or return. Use this business diagram in finance related topic. This diagram is perfect to make professional presentations.

Business Framework Project Management Matrix PowerPoint Presentation
This diagram displays profitability ratio calculation template. Use this diagram in business and marketing presentations to depict profit ratio. This diagram will enhance the quality of your presentations.
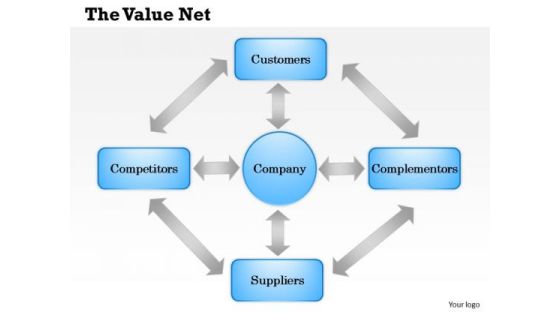
Business Framework The Value Net PowerPoint Presentation
This business power point diagram template has been designed with graphic of multiple staged. This diagram template can be used for value net calculation display in any financial and business presentations.

Business Framework Poverty Index PowerPoint Presentation
A linear growth chart with text boxes has been used to decorate this Power Point template slide. This diagram slide contains the concept of poverty index. Use this index in your financial presentations to show poverty based calculation.
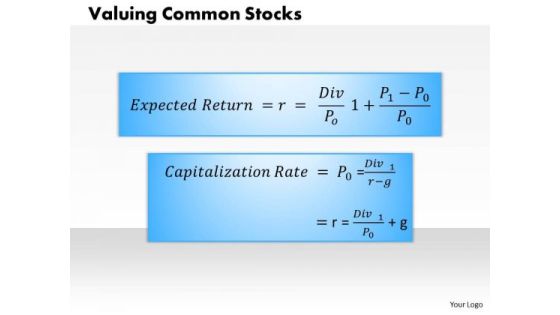
Business Framework Valuing Common Stocks PowerPoint Presentation
This diagram displays framework for valuing common stocks. This diagram has been designed to depict calculations of expected return and capitalization rate. Download this diagram to make professional presentations.

Weight Loss Health PowerPoint Template 0610
Bananas with a measuring tape on a white background bananas

Under Construction Realestate PowerPoint Template 0910
bricks, trowel, hammer & measuring tape on white

Building Plans Construction PowerPoint Template 1010
Blue hard hat yellow pencil measuring tape and building plans

Business Framework Du Pont System PowerPoint Presentation
This beautiful image slide has been designed to display calculation formula for DuPont schema in your presentations. This image slide may be used in business and marketing presentations. You may change color, size and orientation of any icon to your liking. Create professional presentations using this image slide.

Business Framework Efficiency Ratio PowerPoint Presentation
This image slide has been designed to depict efficiency ratio. This image slide displays formulas to calculate asset turnover ratio and NWC ratio. This image slide may be used to exhibit business marketing analysis in your presentations. This image slide will give edge to your presentations.
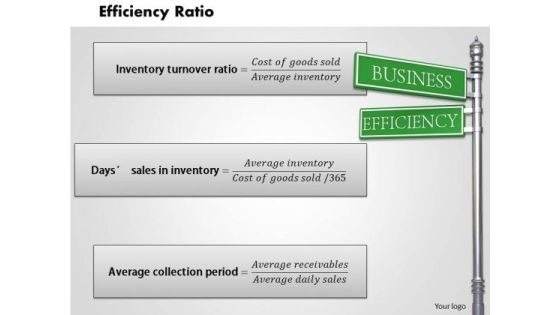
Business Framework Efficiency Ratio PowerPoint Presentation 1
This image slide has been designed to depict efficiency ratio. This image slide displays formulas to calculate average collection period, days sales in inventory, inventory turnover ratio. This image slide may be used to exhibit business marketing analysis in your presentations. This image slide will give edge to your presentations.
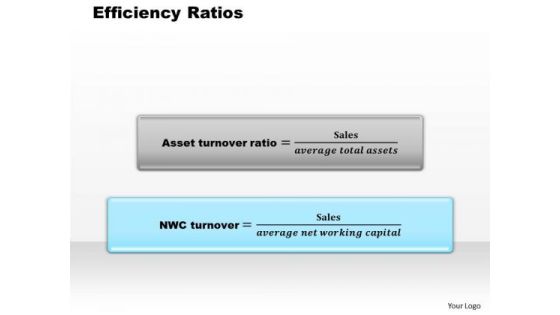
Business Framework Efficiency Ratios PowerPoint Presentation
This image slide has been designed to depict efficiency ratio. This image slide displays formulas to calculate asset turnover ratio and NWC ratio. This image slide may be used to exhibit business marketing analysis in your presentations. This image slide will give edge to your presentations.
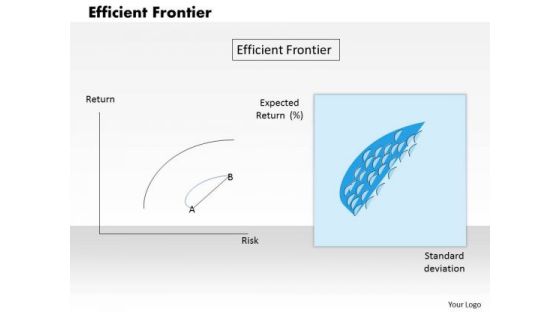
Business Framework Efficient Frontier PowerPoint Presentation 1
This image slide has been designed to depict efficiency ratio. This image slide displays formulas to calculate asset ratio and NWC ratio. This image slide may be used to exhibit business marketing analysis in your presentations. This image slide will give edge to your presentations.
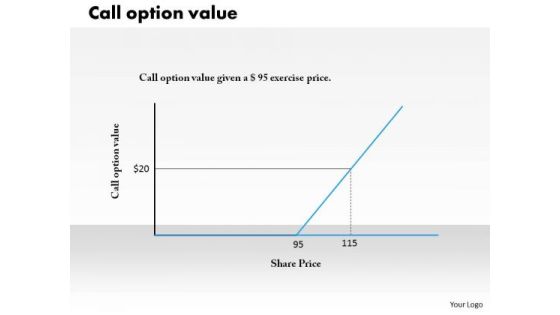
Business Framework Call Option Value PowerPoint Presentation
Explain the call option value in any business presentation with this PPT slide. This PPT slide has been crafted with graphic of call option value graph which is important calculation for growth analysis. Use this PPT and build strong presentation for growth analysis.

Business Framework Net Present Value PowerPoint Presentation
This image slide has been designed to display net present value calculation formulas. Use this image slide, in your presentations to depict present value of cash inflow and present value of cash outflow in business. This image slide will enhance the quality of your presentations.
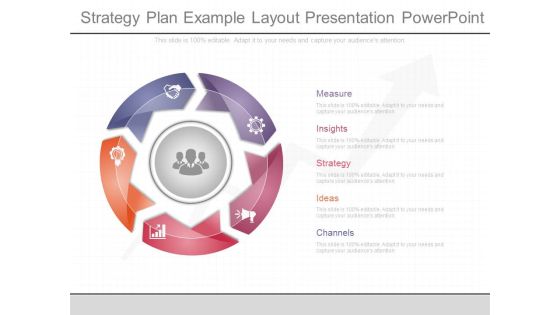
Strategy Plan Example Layout Presentation Powerpoint
This is a strategy plan example layout presentation powerpoint. This is a five stage process. The stages in this process are measure, insights, strategy, ideas, channels.

Example Social Media Strategy Diagram Presentation Powerpoint
This is a example social media strategy diagram presentation powerpoint. This is a six stage process. The stages in this process are define, prioritize, develop, measure, control, brand.

Tightening Up Money PowerPoint Template 0610
a wad of fifty and hundred dollar bills tied up in a tape measure
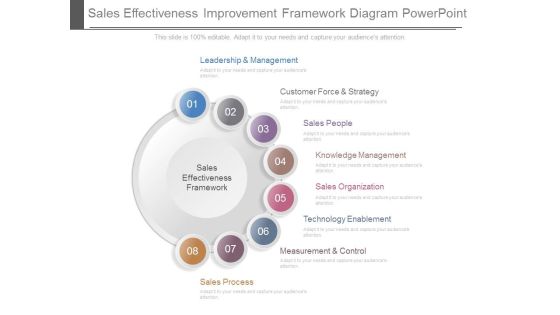
Sales Effectiveness Improvement Framework Diagram Powerpoint
This is a sales effectiveness improvement framework diagram powerpoint. This is a eight stage process. The stages in this process are customer force and strategy, sales people, knowledge management, sales organization, technology enablement, measurement and control, sales effectiveness framework.
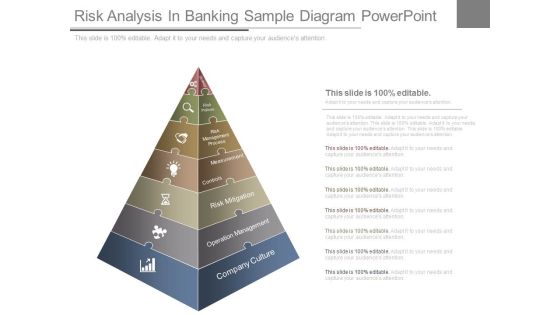
Risk Analysis In Banking Sample Diagram Powerpoint
This is a risk analysis in banking sample diagram powerpoint. This is a seven stage process. The stages in this process are strategy, risk polices, risk management process, measurement, controls, risk mitigation, operation management, company culture.
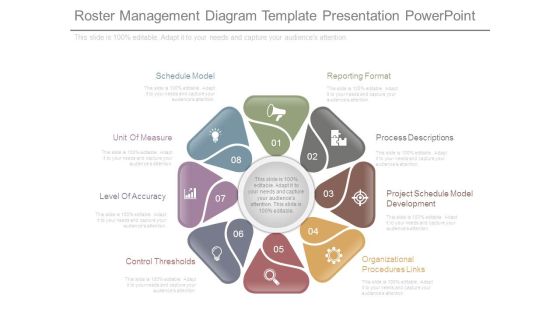
Roster Management Diagram Template Presentation Powerpoint
This is a roster management diagram template presentation powerpoint. This is a eight stage process. The stages in this process are schedule model, unit of measure, level of accuracy, control thresholds, organizational procedures links, project schedule model development, process descriptions, reporting format.
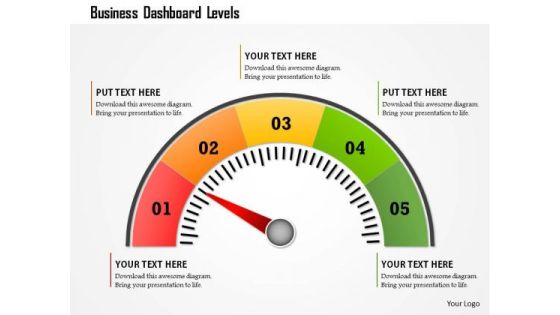
Business Framework Business Dashboard Levels PowerPoint Presentation
This business diagram displays colored meter with multiple levels. Use this diagram to display business process. This diagram can be used to indicate performance measures. This is an excellent diagram to impress your audiences.

Baseline Current State Powerpoint Slide Backgrounds
This is a baseline current state power point slide backgrounds. This is a five stage process. The stages in this process are baseline current state, gap analysis, benchmark target state, strategy execution, measure and control.

Business Framework Horizontal Integration PowerPoint Presentation
This image slide has been designed to display innovative diagram of horizontal integration. This image slide has been designed with matrix with vertical and horizontal measures. This image slide displays the concept of business and marketing management. Use this image slide to enhance the quality of your presentations.

Business Framework Entry Strategies Timeline PowerPoint Presentation
This Power Point template slide has been crafted with graphic of thermometer. This PPT contain the concept of measurement of temperature. Use this PPt for your science and technology related topics. This PPt slide is editable so you can put your data in this PPt slide and make a personal presentation based on your data.

Business Framework Smart Goals Acronym PowerPoint Presentation
Explain the small goal acronyms in your business presentations with this exclusive PPT. This diagram PPT contains the graphic of blue tags and upward way arrow. This PPT is specifically designed for explaining assignable and measurable goals. Use this PPT for your business and goal related topics.
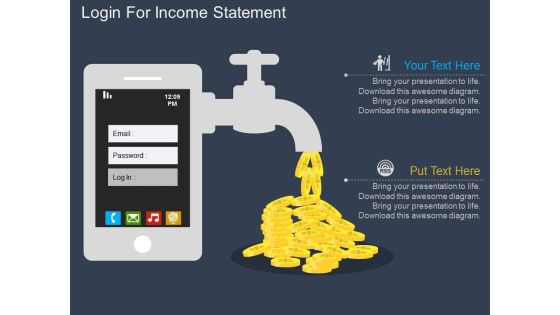
Login For Income Statement Powerpoint Template
Our above slide display graphics of log in page on mobile phone with money flowing out of tap. Download this diagram slide to display security measures for money saving account. Adjust the above diagram in your business presentations to visually support your content.

Internet Browser And Calculator Technology PowerPoint Templates And PowerPoint Backgrounds 0711
Microsoft PowerPoint Template and Background with an internet browser

Internet Browser And Calculator Technology PowerPoint Themes And PowerPoint Slides 0711
Microsoft PowerPoint Theme and Slide with an internet browser

Search Engine Optimization Cost Calculator PowerPoint Layouts Ppt PowerPoint Presentation Gallery Infographics PDF
Presenting this set of slides with name search engine optimization cost calculator powerpoint layouts ppt powerpoint presentation gallery infographics pdf. The topics discussed in these slides are service, optimization, strategy. This is a completely editable PowerPoint presentation and is available for immediate download. Download now and impress your audience.

Measuring Tape With Red Apple Health PowerPoint Templates And PowerPoint Backgrounds 0311
Microsoft PowerPoint Template and Background with photo of the measuring tape with red apple

Test Tubes Measuring Glasses Science PowerPoint Templates And PowerPoint Backgrounds 0711
Microsoft PowerPoint Template and Background with test tubes and measuring glasses filled with different chemicals

Apple With Measure Tape Health PowerPoint Templates And PowerPoint Backgrounds 0911
Microsoft PowerPoint Template and Background with towel, apple with measure tape, dumbbells and water bottle

Apple With Measure Tape Health PowerPoint Themes And PowerPoint Slides 0911
Microsoft PowerPoint Theme and Slide with towel, apple with measure tape, dumbbells and water bottle

Test Tubes Measuring Glasses Science PowerPoint Themes And PowerPoint Slides 0711
Microsoft PowerPoint Theme and Slide with test tubes and measuring glasses filled with different chemicals
 Home
Home