Math Powerpoint
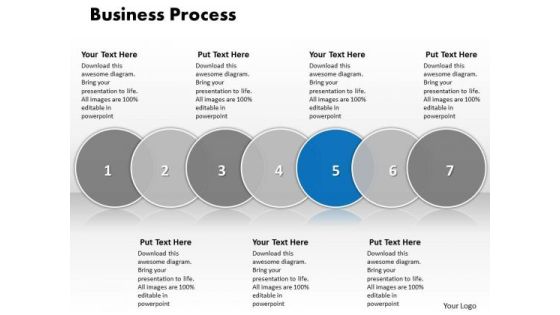
Ppt Free Business Sample Presentation PowerPoint Process Steps Templates
PPT free business sample presentation powerpoint process steps Templates-Use this circle chart to make your team understand complex processes. Constant monitoring of the processes provides you with opportunities to concentrate on the core competencies in your business and improve the standards for more effective results.-PPT free business sample presentation powerpoint process steps Templates-3, Advice, Analysis, Analyze, Answer, Area, Career, Chart, Choice, Circles, Concept, Determination, Diagram, Graph, Idea, Illustration, Intersect, Measurement, Opportunities, Options, Overlap, Overlapped, Overlapping, Passion, Passionate, Prioritize, Priority, Profession

Ppt Multiple Tasks Design 5 Stages PowerPoint Templates 2010
PPT multiple tasks design 5 stages powerpoint templates 2010 -Use this diagram to set out the goals and your plan of action for your team. Satiate their brains with a taste of the final product.-PPT multiple tasks design 5 stages powerpoint templates 2010 -3d, Abstract, Backgrounds, Ball, Business, Choice, Comparison, Concept, Descriptive, Equilibrium, Grow, Illustrations, Instrument, Measurement, Metallic, Part, Partnership, Pattern, Progress, Reflections, Scales, Several, Sphere, Strategy, Success
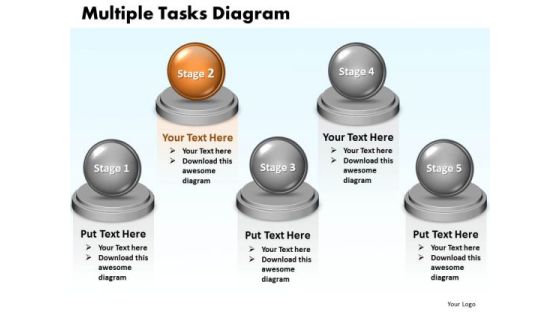
Ppt Multiple Tasks Model 5 Stages Presentation PowerPoint Templates
PPT multiple tasks model 5 stages birthday presentation powerpoint Templates- Amplify your views, ideas and thoughts from very basic aspects tothe highly technical and complicated issues using this template as a tool.-PPT multiple tasks model 5 stages birthday presentation powerpoint Templates-3d, Abstract, Backgrounds, Ball, Business, Choice, Comparison, Concept, Descriptive, Equilibrium, Grow, Illustrations, Instrument, Measurement, Metallic, Part, Partnership, Pattern, Progress, Reflections, Scales, Several, Sphere, Strategy, Success

Conclusion And Recommendations Ppt PowerPoint Presentation Model Icon
Presenting this set of slides with name conclusion and recommendations ppt powerpoint presentation model icon. This is a FOUR stage process. The stages in this process are identify and leverage the burning platform, use supply intelligence and scenario planning, identify potential risk mitigation and contingency steps required, measure and monitor the changes and benefits from the new process. This is a completely editable PowerPoint presentation and is available for immediate download. Download now and impress your audience.
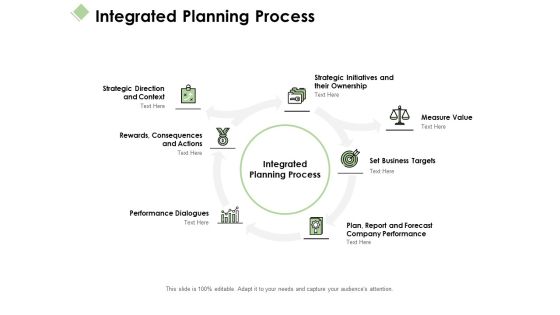
Integrated Planning Process Ppt PowerPoint Presentation Pictures Example
Presenting this set of slides with name integrated planning process ppt powerpoint presentation pictures example. This is a five stage process. The stages in this process are strategic initiatives, ownership, measure value, set business targets plan, report and forecast company performance, performance dialogues, rewards, consequences and actions, strategic direction and context. This is a completely editable PowerPoint presentation and is available for immediate download. Download now and impress your audience.
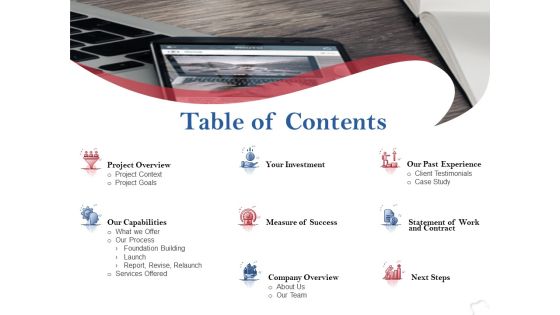
Table Of Contents Ppt PowerPoint Presentation Pictures Design Inspiration
Presenting this set of slides with name table of contents ppt powerpoint presentation pictures design inspiration. This is a eight stage process. The stages in this process are project overview, investment, our past experience, statement of work and contract, next steps, company overview, measure success, our capabilities. This is a completely editable PowerPoint presentation and is available for immediate download. Download now and impress your audience.

Balanced Scorecard Outline Content Ppt PowerPoint Presentation Ideas Infographics PDF
Presenting this set of slides with name balanced scorecard outline content ppt powerpoint presentation ideas infographics pdf. This is a nine stage process. The stages in this process are need balanced scorecard, bsc perspectives, bsc perspectives measurement, balanced scorecard implementation, bsc strategy map, scorecard departmental level, bsc execution framework, performance dashboard. This is a completely editable PowerPoint presentation and is available for immediate download. Download now and impress your audience.
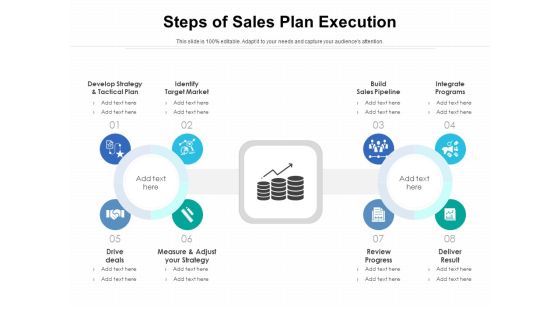
Steps Of Sales Plan Execution Ppt PowerPoint Presentation Example PDF
Presenting steps of sales plan execution ppt powerpoint presentation example pdf to dispense important information. This template comprises eight stages. It also presents valuable insights into the topics including build sales pipeline, integrate programs, review progress, deliver result, develop strategy and tactical plan, identify target market, drive deals, measure and adjust your strategy. This is a completely customizable PowerPoint theme that can be put to use immediately. So, download it and address the topic impactfully.

4 Step ERM Roadmap Ppt PowerPoint Presentation File Infographics PDF
This slide shows the roadmap of the risk management of an enterprise. It also includes 4 steps such as framework, scope, assess and respond. Presenting 4 Step ERM Roadmap Ppt PowerPoint Presentation File Infographics PDF to dispense important information. This template comprises four stages. It also presents valuable insights into the topics including Erm Framework, Measure, Erm Implementation. This is a completely customizable PowerPoint theme that can be put to use immediately. So, download it and address the topic impactfully.
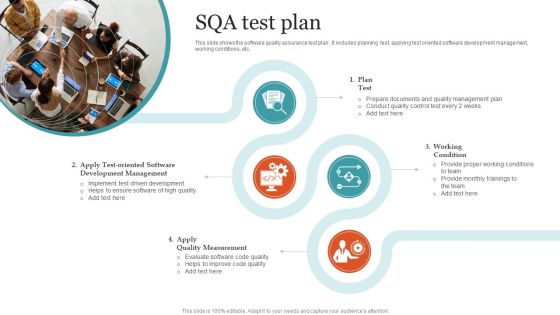
SQA Test Plan Ppt PowerPoint Presentation File Graphic Tips PDF
This slide shows the software quality assurance test plan . It includes planning test, applying test oriented software development management, working conditions, etc. Presenting SQA Test Plan Ppt PowerPoint Presentation File Graphic Tips PDF to dispense important information. This template comprises four stages. It also presents valuable insights into the topics including Plan Test, Working Condition, Apply Quality Measurement. This is a completely customizable PowerPoint theme that can be put to use immediately. So, download it and address the topic impactfully.
Stop Watch With Business Strategy Icons Powerpoint Templates
This business slide has been designed with stair diagram with business icons. This slide may be used to display business progress steps. Use this diagram to make your presentations more effective.
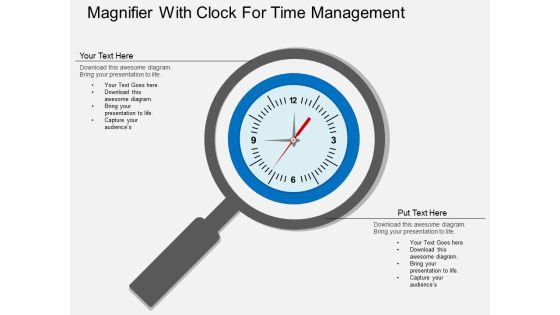
Magnifier With Clock For Time Management Powerpoint Template
Our above business slide contains diagram of magnifier with clock. Download this template to display concepts of time management and strategy. This diagram provides an effective way of displaying information you can edit text, color, shade and style as per you need.

Marketing Insight In Planning Process Sample Powerpoint Ideas
This is a marketing insight in planning process sample powerpoint ideas. This is a nine stage process. The stages in this process are implementing strategies and measures, forecast equipment, design network, marketing, defining your project, using results to adapt and improve, developing strategies and measures, select technologies, finance business strategy.
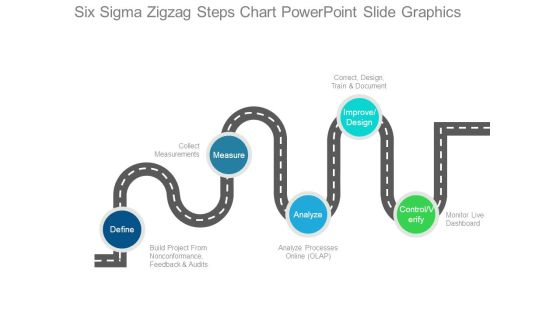
Six Sigma Zigzag Steps Chart Powerpoint Slide Graphics
This is a six sigma zigzag steps chart powerpoint slide graphics. This is a five stage process. The stages in this process are define, build project from nonconformance feedback and audits, collect measurements, measure, analyze, analyze processes online olap, improve design, correct design train and document, monitor live dashboard, control verify.

Continual Service Improvement Template 4 Ppt PowerPoint Presentation Portfolio Styles
This is a continual service improvement template 4 ppt powerpoint presentation portfolio styles. This is a seven stage process. The stages in this process are decide about what should be measured, decide about what can be measured, gather data, process data, analyze data.

Continual Service Improvement Template 2 Ppt PowerPoint Presentation Gallery Themes
This is a continual service improvement template 2 ppt powerpoint presentation gallery themes. This is a five stage process. The stages in this process are business vision mission goals and objectives, baseline assessment, measurable targets, service and process improvement, measurement and metrics.
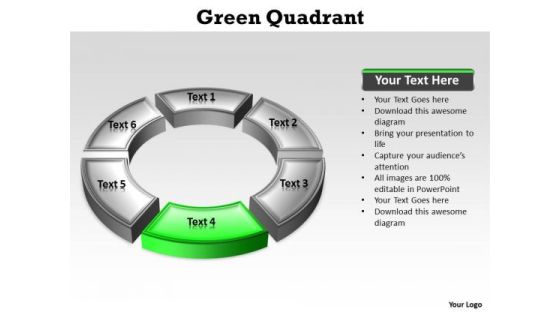
Ppt Circular PowerPoint Menu Template Description Green Stage Templates
PPT circular powerpoint menu template description green stage Templates-Select the key concepts of the topic under study use this slide to discuss that topic with your team. This Diagram is an effective way of displaying information. You can edit text, color, shade and style as per you need.-PPT circular powerpoint menu template description green stage Templates-arrow, blue, business, button, chronometer, circle, clock, concept, countdown, day, design, dial, display, electronics, element, future, futuristic, green, group, hour, icon, illustration, instrument, interval, measure, measurement, metering, minute, numbers, object, precision, quadrant, quick, race, red, round, second, set, shadow, speed, sphere, sport, start, stop

Business Framework The Strategic Planning Gap PowerPoint Presentation
This Power Point diagram template has been designed with graphic of mathematical graph. This business framework contains the concept of strategic planning gap. Use this diagram template for your business strategy and planning related topics in your management presentations.
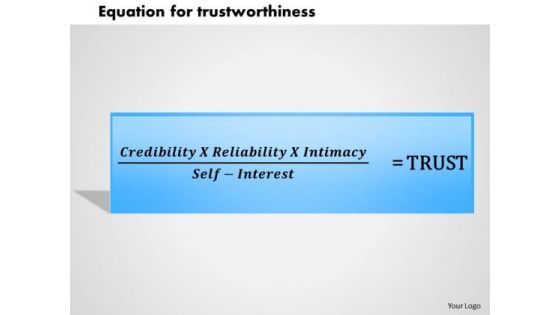
Business Framework Equation For Trustworthiness 2 PowerPoint Presentation
This business framework PPT diagram has been designed with graphic of text box. This PPT diagram contains the concept of trustworthiness. Use this PPT diagram for your education and mathematical presentations.
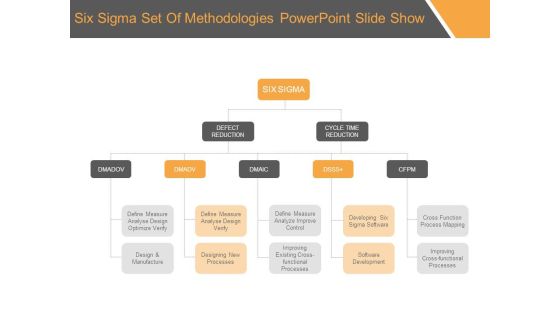
Six Sigma Set Of Methodologies Powerpoint Slide Show
This is a six sigma set of methodologies powerpoint slide show. This is a four stage process. The stages in this process are six sigma, defect reduction, cycle time reduction, define measure analyse design optimize verify, design and manufacture, define measure analyse design verify, designing new processes, define measure analyze improve control, improving existing cross functional processes, developing six sigma software, software development, cross function process mapping, improving cross functional processes.
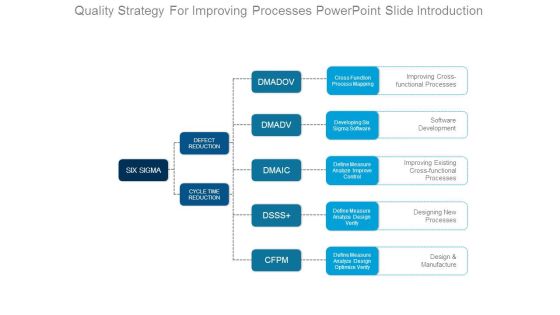
Quality Strategy For Improving Processes Powerpoint Slide Introduction
This is a quality strategy for improving processes powerpoint slide introduction. This is a four stage process. The stages in this process are six sigma, defect reduction, cycle time reduction, dmadov, cross function process mapping, dmadv, dmaic, dsss, cfpm, developing six sigma software, define measure analyze improve control, define measure analyze design verify, define measure analyze design optimize verify, improving cross functional processes, software development, improving existing cross functional processes, designing new processes, design and manufacture.
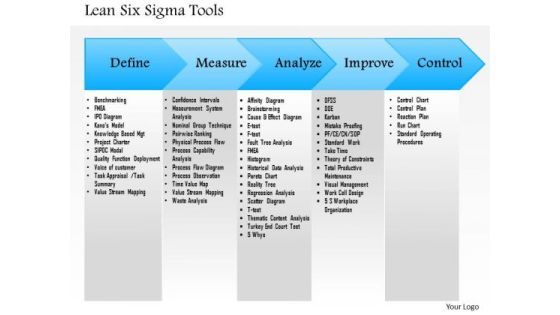
Business Framework Lean Six Sigma Tools PowerPoint Presentation
This diagram displays framework for lean six sigma tools. It contains arrow diagram with five linear steps depicting concepts of define, measure, analyze, improve and control. It helps to explain the route, one may follow to establish a continuously improving business processes. Use this professional and customized business diagram in your PowerPoint presentations.
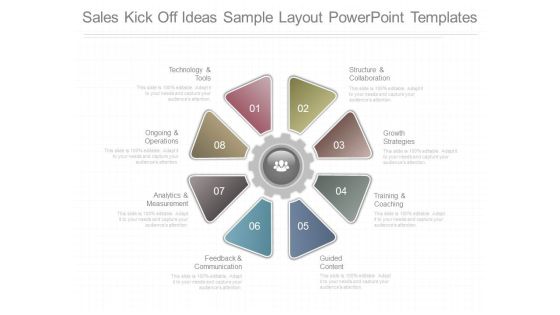
Sales Kick Off Ideas Sample Layout Powerpoint Templates
This is a sales kick off ideas sample layout powerpoint templates. This is a eight stage process. The stages in this process are structure and collaboration, growth strategies, training and coaching, guided content, feedback and communication, analytics and measurement, ongoing and operations, technology and tools.
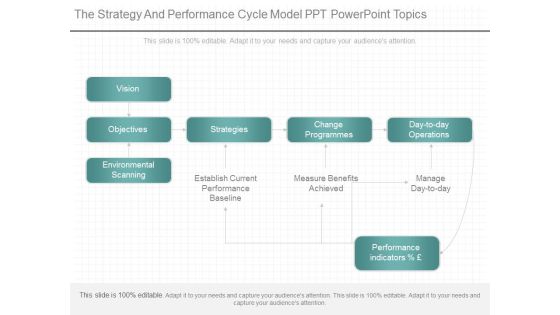
The Strategy And Performance Cycle Model Ppt Powerpoint Topics
This is a the strategy and performance cycle model ppt powerpoint topics. This is a seven stage process. The stages in this process are vision, objectives, strategies, change programmes, day to day operations, environmental scanning, establish current performance baseline, measure benefits achieved, manage day to day, performance indicators.
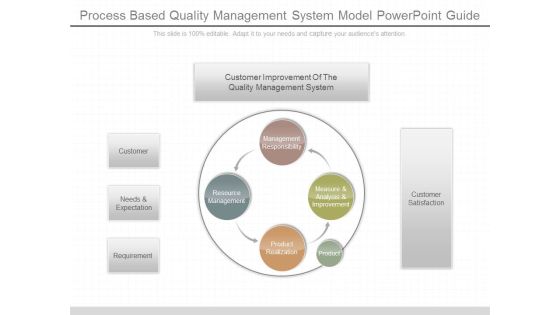
Process Based Quality Management System Model Powerpoint Guide
This is a process based quality management system model powerpoint guide. This is a four stage process. The stages in this process are customer, needs and expectation, requirement, management responsibility, resource management, product realization, product, measure and analysis and improvement, customer satisfaction, customer improvement of the quality management system.

Business Strategy Development And Implementation Ppt Powerpoint Guide
This is a business strategy development and implementation ppt powerpoint guide. This is a four stage process. The stages in this process are execution and ongoing monitoring, business vision and measurement goals, review of vision and goals needs and objectives, business mission.

Systematic Process Of Problem Solving Diagram Powerpoint Slides
This is a systematic process of problem solving diagram powerpoint slides. This is a nine stage process. The stages in this process are define problem measure, gather problem facts data, search for possible causes, plan temporary and permanent improvement, confirm root cause, analyze for cause, check results, install permanent improvement, control.
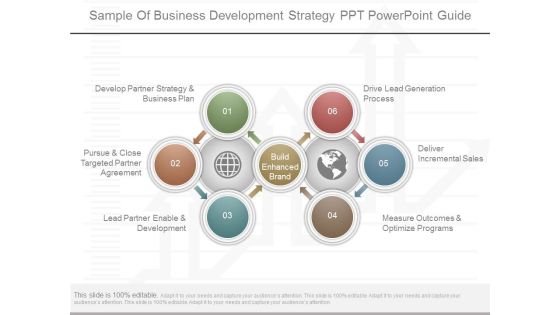
Sample Of Business Development Strategy Ppt Powerpoint Guide
This is a sample of business development strategy ppt powerpoint guide. This is a six stage process. The stages in this process are develop partner strategy and business plan, pursue and close targeted partner agreement, lead partner enable and development, measure outcomes and optimize programs, deliver incremental sales, drive lead generation process, build enhanced brand.

Business Plan For Marketing Design Example Powerpoint Topics
This is a business plan for marketing design example powerpoint topics. This is a six stage process. The stages in this process are make your customers your focus, build a brand that reflects your business, create engaging and relevant content, make a plan, make your website interesting, measurement and control.
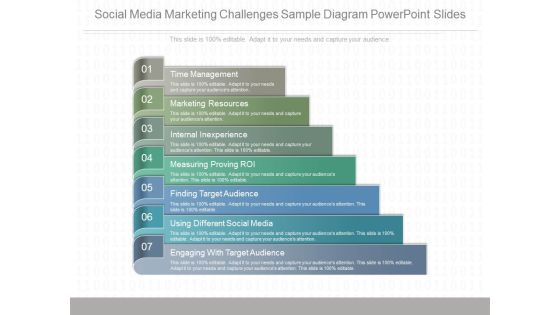
Social Media Marketing Challenges Sample Diagram Powerpoint Slides
This is a social media marketing challenges sample diagram powerpoint slides. This is a seven stage process. The stages in this process are time management, marketing resources, internal inexperience, measuring proving roi, finding target audience, using different social media, engaging with target audience.
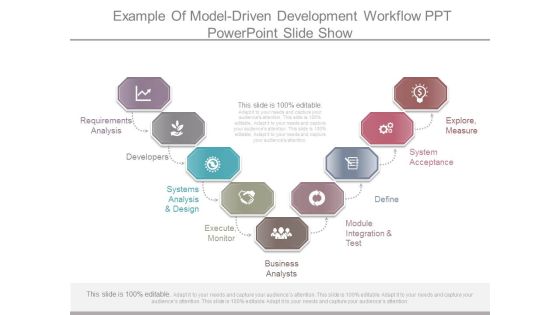
Example Of Model Driven Development Workflow Ppt Powerpoint Slide Show
This is a example of model driven development workflow ppt powerpoint slide show. This is a nine stage process. The stages in this process are requirements analysis, developers, systems analysis and design, execute, monitor, business analysts, module integration and test, define, system acceptance, explore, measure.

Risk Based Asset Management Model Ppt Powerpoint Ideas
This is a risk based asset management model ppt powerpoint ideas. This is a six stage process. The stages in this process are continuous improvement, plan, do, check, act, building capability, quality system, operational stability, classify, analyze, control, measure, metrics, corporate culture.

Evaluating Market Dynamics Diagram Powerpoint Slides Design Ideas
This is a evaluating market dynamics diagram powerpoint slides design ideas. This is a eight stage process. The stages in this process are technology adoption, supply side analysis, strategy development, market models, situation assessment, analyst insight, execution and measurement, solution design.

Allowance Execution Model Diagram Powerpoint Slide Presentation Sample
This is a allowance execution model diagram powerpoint slide presentation sample. This is a eight stage process. The stages in this process are determine results, procurement process, impact measurement process, clarify result definitions, value programs based on results, audit and legislative oversight process, identify programs, budget execution process.

Roster Management Diagram Template Powerpoint Slide Deck Template
This is a roster management diagram template powerpoint slide deck template. This is a eight stage process. The stages in this process are schedule model development, level of accuracy, units of measure, schedule model maintenance, control thresholds, performance management rules, reporting format, process description.

Elements That Affect Market Segmentation Powerpoint Slide Information
This is a elements that affect market segmentation powerpoint slide information. This is a four stage process. The stages in this process are clear identification of the segment, accessibility through promotional efforts, appropriateness to the policies and resources of the company, measurability of its effective size, factors that affect market segmentation.

Six Sigma Circular Chart With Down Arrows Powerpoint Slide Images
This is a six sigma circular chart with down arrows powerpoint slide images. This is a five stage process. The stages in this process are recognize, realize, measure, define, analyze, improve, control, voice of customer and voice of process, practical problem, statistical problem, statistical solution, practical solution, control plan, result.
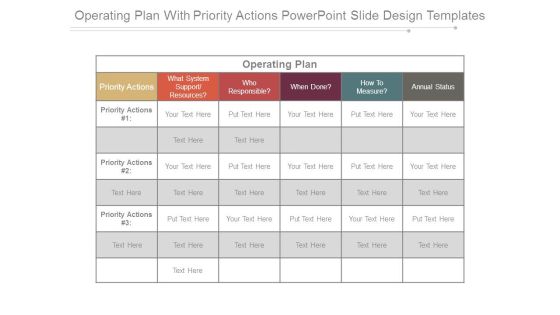
Operating Plan With Priority Actions Powerpoint Slide Design Templates
This is a operating plan with priority actions powerpoint slide design templates. This is a six stage process. The stages in this process are priority actions, what system support resources, who responsible, when done, how to measure, annual status, operating plan.

Factors That Affect Market Segmentation Ppt PowerPoint Presentation Graphics
This is a factors that affect market segmentation ppt powerpoint presentation graphics. This is a four stage process. The stages in this process are factors that affect market segmentation, clear identification of the segment, accessibility through promotional efforts, measurability of its effective size, appropriateness to the policies and resources of the company.
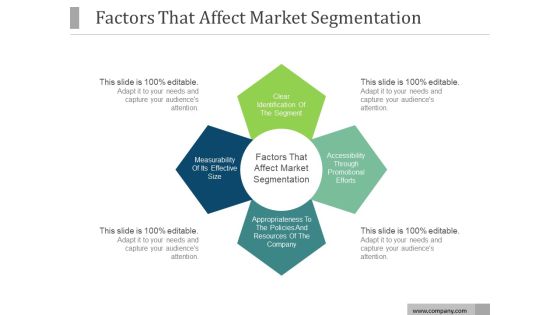
Factors That Affect Market Segmentation Ppt PowerPoint Presentation Good
This is a factors that affect market segmentation ppt powerpoint presentation good. This is a four stage process. The stages in this process are clear identification of the segment, accessibility through promotional efforts, factors that affect, market segmentation, appropriateness to the policies and resources of the company, measurability of its effective size.

Typical Product Launch Marketing Process Ppt PowerPoint Presentation Infographics Picture
This is a typical product launch marketing process ppt powerpoint presentation infographics picture. This is a three stage process. The stages in this process are traditional media plan, traditional media, measure impact, social media plan, outreach plan for press bloggers, advance outreach, social media, launch event.

Factors That Affect Market Segmentation Ppt PowerPoint Presentation Designs
This is a factors that affect market segmentation ppt powerpoint presentation designs. This is a four stage process. The stages in this process are clear identification of the segment, accessibility through promotional efforts, appropriateness to the policies and resources of the company, measurability of its effective size.

Ppt Comparison Diagram Of 4 Colorful State PowerPoint Templates
PPT comparison diagram of 4 colorful state PowerPoint Templates-This Detailed Flow Diagram displays the activities you may need to execute to achieve successful implementation and in-service management of your services program. You can show various processes with these linear designed Circular pieces. This image has been conceived to enable you to emphatically communicate your ideas in your Comparing 4 quantities PPT presentation.-PPT comparison diagram of 4 colorful state PowerPoint Templates-3d, Abstract, Backgrounds, Ball, Business, Choice, Comparison, Concept, Descriptive, Equilibrium, Grow, Illustrations, Instrument, Measurement, Metallic, Part, Partnership, Pattern, Progress, Reflections, Scales, Several, Sphere, Strategy, Success

Ppt Multiple Cases Diagram 5 Stages PowerPoint Templates 2010 0812
PPT multiple cases diagram 5 stages powerpoint templates 2010 0812-This diagram provides a graphical view of different aspects of a business plan and the relationships between them. Use this circular PPT abstraction to establish a link between your personal methodology and action research possibilities. The ideas and plans are on your fingertips. Now imprint them on the minds of your audience via our slides.-PPT multiple cases diagram 5 stages powerpoint templates 2010 0812-3d, Abstract, Backgrounds, Ball, Business, Choice, Comparison, Concept, Descriptive, Equilibrium, Grow, Illustrations, Instrument, Measurement, Metallic, Part, Partnership, Pattern, Progress, Reflections, Scales, Several, Sphere, Strategy, Success

Ppt Multiple Processes Diagram 5 Stages Presentation 0812 PowerPoint Templates
PPT multiple processes diagram 5 stages presentation 0812 PowerPoint Templates-Deliver amazing Presentations with our above Diagram illustrating the five different processes to be explained in one single slide. This Diagram shows the first stage with red color. Clarity of thought has been the key to your growth. Use our Diagram to illustrate your ability.-PPT multiple processes diagram 5 stages presentation 0812 PowerPoint Templates-3d, Abstract, Backgrounds, Ball, Business, Choice, Comparison, Concept, Descriptive, Equilibrium, Grow, Illustrations, Instrument, Measurement, Metallic, Part, Partnership, Pattern, Progress, Reflections, Scales, Several, Sphere, Strategy, Success

Ppt Multiple Tasks Diagram 5 Stages PowerPoint Templates 2003 0812
PPT multiple tasks diagram 5 stages powerpoint templates 2003 0812-The above Diagram displays a picture of five circular text boxes placed in 3D manner. This image has been professionally designed to emphasize the concept of Operations performed in Circular process. Adjust the above image in your PPT presentations to visually support your content in your Business PPT slideshows. This Diagram illustrates the concept of purple circular box.-PPT multiple tasks diagram 5 stages powerpoint templates 2003 0812-3d, Abstract, Backgrounds, Ball, Business, Choice, Comparison, Concept, Descriptive, Equilibrium, Grow, Illustrations, Instrument, Measurement, Metallic, Part, Partnership, Pattern, Progress, Reflections, Scales, Several, Sphere, Strategy, Success

Ppt Interconnected Seven Stages Of Writing Process PowerPoint Presentation Templates
PPT interconnected seven stages of writing process powerpoint presentation Templates-This diagram is a graphical illustration of the relationships between and among sets of data, groups of objects that share something in common. This diagram is made up of overlapping circles that show all possible logical relations. Deliver amazing presentations to mesmerize your audience.-PPT interconnected seven stages of writing process powerpoint presentation Templates-3, Advice, Analysis, Analyze, Answer, Area, Career, Chart, Choice, Circles, Concept, Determination, Diagram, Graph, Idea, Illustration, Intersect, Measurement, Opportunities, Options, Overlap, Overlapped, Overlapping, Passion, Passionate, Prioritize, Priority, Profession

Ppt Comparable Seven State Diagram Business PowerPoint Templates
PPT comparable seven state diagram Business PowerPoint Templates-Develop competitive advantage with our above Diagram which contains a diagram of six stages organized in Linear Manner. This Highlighted Blue circular text box shows the fifth step occurring in the process. It is a useful captivating tool enables you to define your message in your Marketing PPT presentations. You can edit text, color, shade and style as per you need.-PPT comparable seven state diagram Business PowerPoint Templates-3, Advice, Analysis, Analyze, Answer, Area, Career, Chart, Choice, Circles, Concept, Determination, Diagram, Graph, Idea, Illustration, Intersect, Measurement, Opportunities, Options, Overlap, Overlapped, Overlapping, Passion, Passionate, Prioritize, Priority, Profession

Ppt Complementary Seven Power Point Stage Business PowerPoint Templates
PPT complementary seven power point stage Business PowerPoint Templates-Our Awesome Diagram consists of a design of seven circular boxes placed In the Horizontal Manner. Adjust the above image into your Presentations to visually support your contents in your Business PPT Slideshows. This image represents the Abstraction of seven steps involved in the process. Deliver amazing presentations to mesmerize your audience using this Diagram.-PPT complementary seven power point stage Business PowerPoint Templates-3, Advice, Analysis, Analyze, Answer, Area, Career, Chart, Choice, Circles, Concept, Determination, Diagram, Graph, Idea, Illustration, Intersect, Measurement, Opportunities, Options, Overlap, Overlapped, Overlapping, Passion, Passionate, Prioritize, Priority, Profession
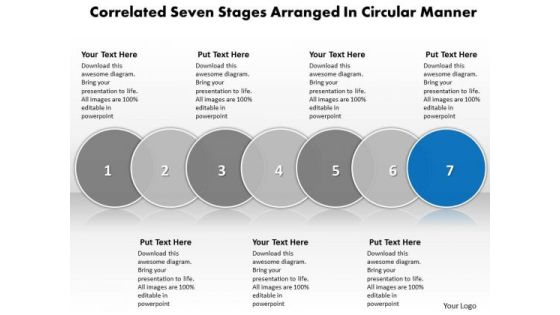
Ppt Correlative Seven Phase Diagram Business PowerPoint Templates
PPT correlative seven phase diagram Business PowerPoint Templates-The structure of our Diagrams allows you to effectively highlight the key issues concerning the growth of your business. Use this Diagram to Show your clients how they can save the day. You have the plans ready for them to absorb and understand. Explain the process by which you intend to right it. Start the gears of youthful minds and set them in motion.-PPT correlative seven phase diagram Business PowerPoint Templates-3, Advice, Analysis, Analyze, Answer, Area, Career, Chart, Choice, Circles, Concept, Determination, Diagram, Graph, Idea, Illustration, Intersect, Measurement, Opportunities, Options, Overlap, Overlapped, Overlapping, Passion, Passionate, Prioritize, Priority, Profession
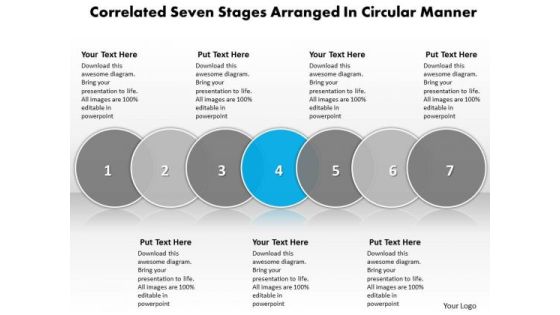
Ppt Employment Connections Seven Power Point Stage Business PowerPoint Templates
PPT employment connections seven power point stage Business PowerPoint Templates-With these pre-designed Circular Boxes you can visualize almost any type of concept, chronological process or steps of your strategies. Use these upright arrows to make your presentation more attractive. The structure of our Diagrams allows you to effectively highlight the key issues concerning the growth of your business. -PPT employment connections seven power point stage Business PowerPoint Templates-3, Advice, Analysis, Analyze, Answer, Area, Career, Chart, Choice, Circles, Concept, Determination, Diagram, Graph, Idea, Illustration, Intersect, Measurement, Opportunities, Options, Overlap, Overlapped, Overlapping, Passion, Passionate, Prioritize, Priority, Profession

EUC Metrics Structure Ppt PowerPoint Presentation Icon Model PDF
This slide depicts end user computing metrics. It covers metrics related to end user sentiment, system data and workflow simplification that helps to measure and enhance end user experience. Presenting EUC Metrics Structure Ppt PowerPoint Presentation Icon Model PDF to dispense important information. This template comprises three stages. It also presents valuable insights into the topics including Sentiment Metrics, System Metrics, Simplification Metrics. This is a completely customizable PowerPoint theme that can be put to use immediately. So, download it and address the topic impactfully.

SRE Action Plan Ppt PowerPoint Presentation File Templates PDF
The following slide depicts the plan to manage systems and capacity planning of services. It mainly includes elements such as culture, toil reduction, measurements, SLAs, SLIs, SLOs, continuous delivery and integration, deployments, incident management etc. Presenting SRE Action Plan Ppt PowerPoint Presentation File Templates PDF to dispense important information. This template comprises nine stages. It also presents valuable insights into the topics including Continuous Integration, Continuous Delivery, Deployments. This is a completely customizable PowerPoint theme that can be put to use immediately. So, download it and address the topic impactfully.
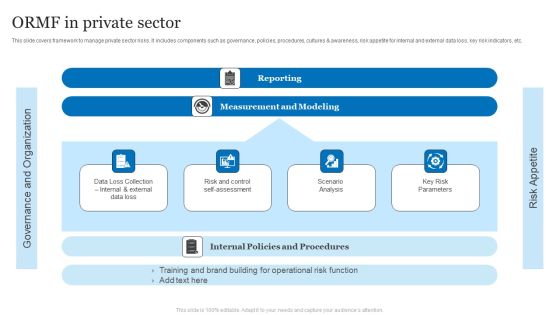
ORMF In Private Sector Ppt PowerPoint Presentation Professional Introduction PDF
This slide covers framework to manage private sector risks. It includes components such as governance, policies, procedures, cultures and awareness, risk appetite for internal and external data loss, key risk indicators, etc.Presenting ORMF In Private Sector Ppt PowerPoint Presentation Professional Introduction PDF to dispense important information. This template comprises four stages. It also presents valuable insights into the topics including Measurement Modeling, Policies Procedures, Building Operational. This is a completely customizable PowerPoint theme that can be put to use immediately. So, download it and address the topic impactfully.

Gear Clock For Strategic Marketing Process Powerpoint Template
Above business slide has been designed with graphics of gear clock with icons. Download this diagram to exhibit strategic marketing process. Trigger the imagination of your audience with this slide.

Circular Steps Around Watch With Icons Powerpoint Template
This business slide has been designed with graphics of circular steps around clock. This diagram has been designed to exhibit time planning and management. This professional slide helps in making an instant impact on viewers.
Five Icons With Stopwatch In Linear Flow Powerpoint Templates
This business slide contains five icons with stop watch. This diagram is suitable to present concept of time management for business functions. The visual effect of this slide helps in maintaining the flow of the discussion and provides more clarity to the subject.
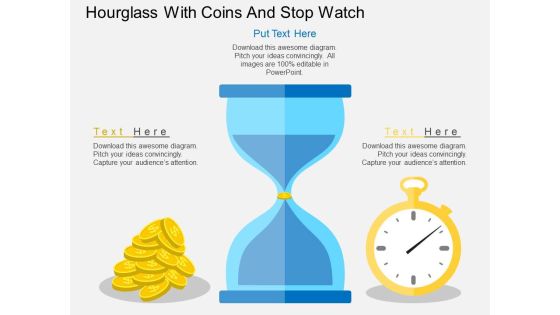
Hourglass With Coins And Stop Watch Powerpoint Template
Our professionally designed business diagram is as an effective tool for communicating business ideas and strategies for corporate planning. It contains graphics of hourglass with coins and stop watch. Download this template to build interactive presentation.
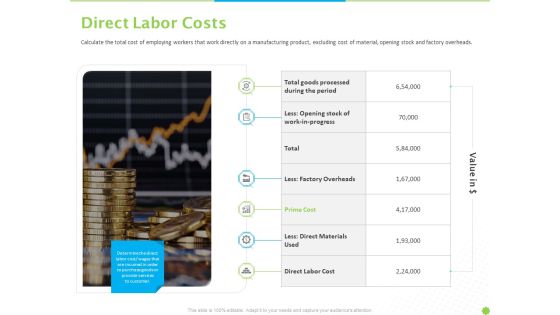
Price Architecture Direct Labor Costs Ppt PowerPoint Presentation Microsoft PDF
Calculate the total cost of employing workers that work directly on a manufacturing product, excluding cost of material, opening stock and factory overheads. This is a price architecture direct labor costs ppt powerpoint presentation microsoft pdf template with various stages. Focus and dispense information on six stages using this creative set, that comes with editable features. It contains large content boxes to add your information on topics like total goods processed during the period, less opening stock of work progress, factory overheads, prime cost, direct labor cost. You can also showcase facts, figures, and other relevant content using this PPT layout. Grab it now.

Experian Company Outline Ppt PowerPoint Presentation Complete With Slides
Business requires a combination of luck, numerical skills, people skills and a lot of calculated investment and risk taking. This Experian Company Outline Ppt PowerPoint Presentation Complete With Slides allows you a peak into how varied skills and the ability to spot opportunities is an invaluable asset for a business manager. With forty five slides, this this 100 percent editable and customisable template can we presented to any audience profile with abandon and will always be well received. The key to aceing this presentation is hands on experience, combined the ability to story tell. This presentation template does justice to both abilities. Download now.

Stock Photo Measuring Tape And Red Pencil PowerPoint Slide
This image displays graphic of Measuring Tape with Red Pencil. Use this image to depict concept of measurement and engineering. Use this image and make an impressive presentation.

Business Framework How To Measure Key Performance Indicator PowerPoint Presentation
This Power Point diagram slide has been crafted with graphic of flower petal diagram. This PPT slide contains the concept of measuring the key performance and indicate it. Use this PPT slide for your management related presentation.

Build Test Market Measure Structure Steps Powerpoint Slides
Our above business slide has been designed with graphics four colorful blocks. This slide is suitable to present build, test and market measure steps. Use this business diagram to present your work in a more smart and precise manner.
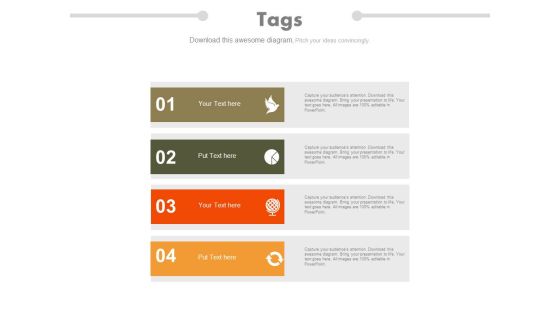
Four Tags For Balanced Scorecard Measures Powerpoint Template
Our above business slide illustrates four infographic tags. This PPT slide is suitable to display balances scorecard measures. Use this power point template to present your work in a more smart and precise manner.

Quality Control Dashboard Ppt PowerPoint Presentation Visual Aids Summary PDF
Following slide shows quality control dashboard covering target and measurement percentage of process under control. It also includes statistics of number of defects per lot, corrective actions and cost of quantity.Deliver an awe-inspiring pitch with this creative quality control dashboard ppt powerpoint presentation visual aids summary pdf. bundle. Topics like process under control, cost of quality, target can be discussed with this completely editable template. It is available for immediate download depending on the needs and requirements of the user.

Where Is The Gap Ppt PowerPoint Presentation File Styles PDF
This slide covers the gap analysis for waste management including activity, problems and required solutions. Deliver an awe inspiring pitch with this creative where is the gap ppt powerpoint presentation file styles pdf bundle. Topics like technology, measure facility, maintenance, collection and transportation can be discussed with this completely editable template. It is available for immediate download depending on the needs and requirements of the user.
NPS Measurement Ppt PowerPoint Presentation Complete Deck With Slides
This complete presentation has PPT slides on wide range of topics highlighting the core areas of your business needs. It has professionally designed templates with relevant visuals and subject driven content. This presentation deck has total of sixteen slides. Get access to the customizable templates. Our designers have created editable templates for your convenience. You can edit the colour, text and font size as per your need. You can add or delete the content if required. You are just a click to away to have this ready made presentation. Click the download button now.
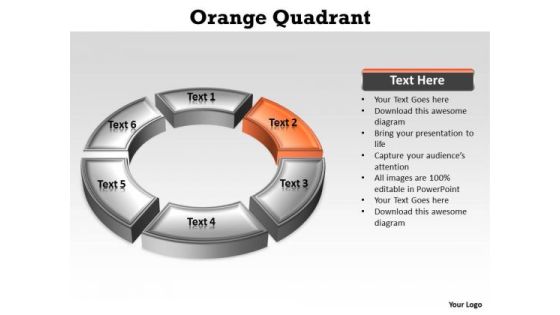
Ppt Orange Stage Through PowerPoint Presentation Circular Diagram Templates
PPT orange stage through powerpoint presentation circular diagram Templates-Create visually stunning and define your PPT Presentations in a unique and inspiring manner using our above Diagram which contains a graphic of of a Circular process. This correlative six stages diagram is a tool that can help your team work productively and successfully. Our colorful image makes your presentations inviting, friendly, simpler, professional showing that you care about even the smallest details. You can change color, size and orientation of any icon to your liking.-PPT orange stage through powerpoint presentation circular diagram Templates-abstract, accuracy, arrow, blue, chronometer, circle, clock, elegance, glass, glossy, graphic, icon, illustration, measure, asurement, mechanism, metal, point, quartz, round, shape, sign, single, slow, stylish, symbol, technology, timepiece, timer, vector,
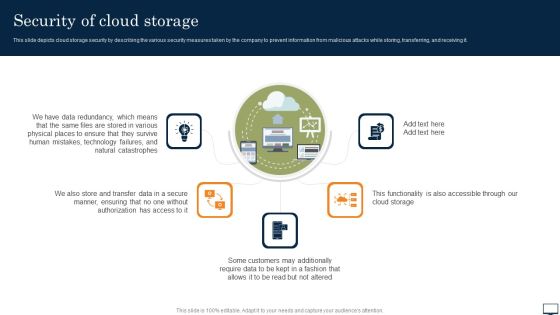
Security Of Cloud Storage Ppt PowerPoint Presentation File Styles PDF
This slide depicts cloud storage security by describing the various security measures taken by the company to prevent information from malicious attacks while storing, transferring, and receiving it. Get a simple yet stunning designed Security Of Cloud Storage Ppt PowerPoint Presentation File Styles PDF. It is the best one to establish the tone in your meetings. It is an excellent way to make your presentations highly effective. So, download this PPT today from Slidegeeks and see the positive impacts. Our easy to edit Security Of Cloud Storage Ppt PowerPoint Presentation File Styles PDF can be your go to option for all upcoming conferences and meetings. So, what are you waiting for Grab this template today.

Security Of Cloud Storage Ppt PowerPoint Presentation File Deck PDF
This slide depicts cloud storage security by describing the various security measures taken by the company to prevent information from malicious attacks while storing, transferring, and receiving it. Retrieve professionally designed Security Of Cloud Storage Ppt PowerPoint Presentation File Deck PDF to effectively convey your message and captivate your listeners. Save time by selecting pre made slideshows that are appropriate for various topics, from business to educational purposes. These themes come in many different styles, from creative to corporate, and all of them are easily adjustable and can be edited quickly. Access them as PowerPoint templates or as Google Slides themes. You do not have to go on a hunt for the perfect presentation because Slidegeeks got you covered from everywhere.

Visitor Segment Value Matrix Ppt PowerPoint Presentation File Styles PDF
The following slide highlights a matrix to measure current and potential value if customers for refining business customers marketing and retention strategy. It showcases segments such as disengaged, star, light and new. Get a simple yet stunning designed Visitor Segment Value Matrix Ppt PowerPoint Presentation File Styles PDF. It is the best one to establish the tone in your meetings. It is an excellent way to make your presentations highly effective. So, download this PPT today from Slidegeeks and see the positive impacts. Our easy to edit Visitor Segment Value Matrix Ppt PowerPoint Presentation File Styles PDF can be your go to option for all upcoming conferences and meetings. So, what are you waiting for Grab this template today.

Monitoring And Controlling Risks Process Ppt Powerpoint Image
This is a monitoring and controlling risks process ppt powerpoint image. This is a Three stage process. The stages in this process are inputs, tools and techniques, outputs, project documents update, change requests, update to organizational process assets and project documents such as project management plan and risk register, risk management plan, cost management plan, risk register, performance report, work performance information, project management plan risk, organizational process assets, data gathering and representation techniques, quantitative risk analysis and modeling techniques, risk assessments and risk audits, performance measuring and analysis such as technical performance measurements variance analysis.

Banking And Financial ORMF Ppt PowerPoint Presentation Slides Mockup PDF
This slide covers risk management framework for several banking and financial processes. It includes components such as modelling planning, monitoring financial performance, data consolidation, financial instrument measurement for outcomes, budget control, loans, derivatives, etc.Pitch your topic with ease and precision using this Banking And Financial ORMF Ppt PowerPoint Presentation Slides Mockup PDF. This layout presents information on Modelling Planning, Financial Instrument, Measurement Outcomes. It is also available for immediate download and adjustment. So, changes can be made in the color, design, graphics or any other component to create a unique layout.

Employee Retention Planned Initiatives Ppt PowerPoint Presentation File Examples PDF
This slide showcases the proposed strategy for retaining employees with measure of success. It includes proposed actions such as reduce employee turnover rate, reduce training time, increase productivity and improve company culture. Showcasing this set of slides titled Employee Retention Planned Initiatives Ppt PowerPoint Presentation File Examples PDF. The topics addressed in these templates are Activities, Actions, Measure Of Success. All the content presented in this PPT design is completely editable. Download it and make adjustments in color, background, font etc. as per your unique business setting.
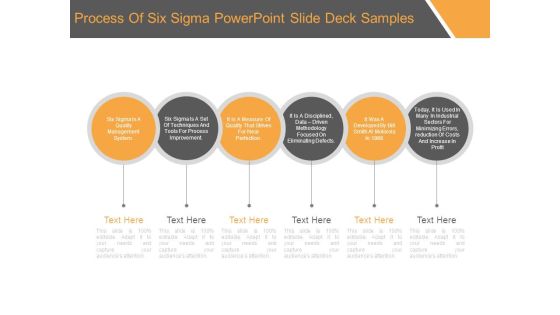
Process Of Six Sigma Powerpoint Slide Deck Samples
This is a process of six sigma powerpoint slide deck samples. This is a six stage process. The stages in this process are six sigma is a quality management system, six sigma is a set of techniques and tools for process improvement, it is a measure of quality that strives for near perfection, it is a disciplined, data driven methodology focused on eliminating defects, it was a developed by bill smith at motorola in 1986, today, it is used in many in industrial sectors for minimizing errors, reduction of costs and increase in profit.

Business Operations Dashboard Ppt PowerPoint Presentation Styles Pictures PDF
This slide shows dashboard for measuring business operations. It includes details of total production, weekly average production, scrap and scrap average in each production line. It also covers daily production statistics, production trend, project summary, events and distribution.Deliver an awe-inspiring pitch with this creative business operations dashboard ppt powerpoint presentation styles pictures pdf. bundle. Topics like production trend, daily production, production summary, distribution can be discussed with this completely editable template. It is available for immediate download depending on the needs and requirements of the user.
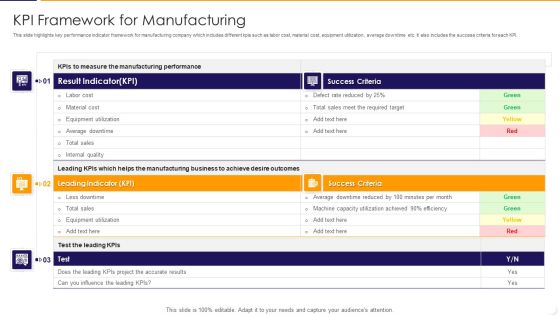
KPI Framework For Manufacturing Ppt PowerPoint Presentation Gallery Themes PDF
This slide highlights key performance indicator framework for manufacturing company which includes different kpis such as labor cost, material cost, equipment utilization, average downtime etc. It also includes the success criteria for each KPI. Pitch your topic with ease and precision using this kpi framework for manufacturing ppt powerpoint presentation gallery themes pdf This layout presents information on measure, manufacturing, performance. It is also available for immediate download and adjustment. So, changes can be made in the color, design, graphics or any other component to create a unique layout.

Production FMEA Tool Ppt PowerPoint Presentation Outline Templates PDF
This slide represents FMEA report of a product manufacturing company to identifying potential failure modes, listing potential failure effects, assigning severity score, determining potential causes, assigning occurrence rating, determining current process controls, and assigning detection rating.Pitch your topic with ease and precision using this Production FMEA Tool Ppt PowerPoint Presentation Outline Templates PDF. This layout presents information on Process Function, Soap Manufacturing, Standard Measurement. It is also available for immediate download and adjustment. So, changes can be made in the color, design, graphics or any other component to create a unique layout.

Corporation Pitch Deck Solution Ppt PowerPoint Presentation Layouts Skills PDF
This slide provides the glimpse about the solution offered by our company for expense tracking and optimization such as tracking SaaS expenses, identifying duplicate services, etc. Presenting Corporation Pitch Deck Solution Ppt PowerPoint Presentation Layouts Skills PDF to provide visual cues and insights. Share and navigate important information on four stages that need your due attention. This template can be used to pitch topics like Invoices Automatically, Measuring Team, Streamline Migration. In addtion, this PPT design contains high resolution images, graphics, etc, that are easily editable and available for immediate download.

Adopting Devops Maturity Model Ppt PowerPoint Presentation Diagram PDF
This slide provides the glimpse about the DevOps maturity model adoption which cover 5 steps such as initial, managed, defined, measured, and optimized. Find a pre designed and impeccable Adopting Devops Maturity Model Ppt PowerPoint Presentation Diagram PDF. The templates can ace your presentation without additional effort. You can download these easy to edit presentation templates to make your presentation stand out from others. So, what are you waiting for Download the template from Slidegeeks today and give a unique touch to your presentation.

Consulting Business ORMF Ppt PowerPoint Presentation Summary Example Topics PDF
This slide covers framework designed to address risk management challenges and bring business value. It includes critical elements such as risk strategy and appetite, risk governance, risk culture, operational risk assessment and measurement, operational risk management and monitoring, etc.Persuade your audience using this Consulting Business ORMF Ppt PowerPoint Presentation Summary Example Topics PDF. This PPT design covers seven stages, thus making it a great tool to use. It also caters to a variety of topics including Management Strategy, Operative Technology, Reporting Operational. Download this PPT design now to present a convincing pitch that not only emphasizes the topic but also showcases your presentation skills.

Enterprise ORMF Ppt PowerPoint Presentation Show Example PDF
This slide covers eight components to identify specific risk areas. It includes components such as governance and culture, strategies, policies, assessment, monitoring and testing, risk infrastructure, data measurement and reporting, training and communications, escalation and resolutions, etc.Persuade your audience using this Enterprise ORMF Ppt PowerPoint Presentation Show Example PDF. This PPT design covers eight stages, thus making it a great tool to use. It also caters to a variety of topics including Risk Governance, External Events, Operational Issues. Download this PPT design now to present a convincing pitch that not only emphasizes the topic but also showcases your presentation skills.
KPI Metrics For SQA Ppt PowerPoint Presentation Icon Deck PDF
This slide shows the KPI metrics which can be used by an organization to measure the software quality. It includes passed test defects fixed per day, Average time to test, quality ratio, etc. Showcasing this set of slides titled KPI Metrics For SQA Ppt PowerPoint Presentation Icon Deck PDF. The topics addressed in these templates are Quality Ratio, Kpis, Passed Tests. All the content presented in this PPT design is completely editable. Download it and make adjustments in color, background, font etc. as per your unique business setting.
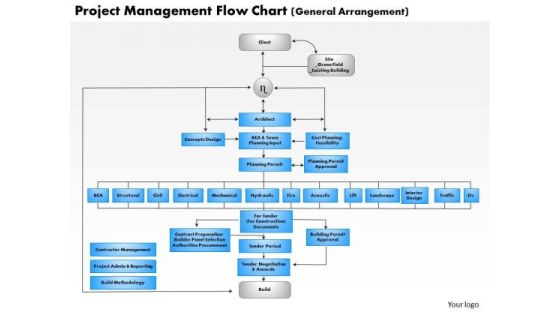
Business Framework Project Management Flow Chart PowerPoint Presentation
This diagram displays profitability ratio calculation template. Use this diagram in business and marketing presentations to depict profit ratio. This diagram will enhance the quality of your presentations.

PowerPoint Arrow Shapes Comparison Process Ppt Templates Backgrounds For Slides
3d, accounting, arrow, art, bar, blue, business, calculation, chart, collection, company, design elements, diagram, directive, expense, finance, firm, forecast, future, gain, graph, grow, growth, icon, illustration, income, line, market, measure, objects, office, profit, progress, rate, set, statistic, stock, success, two, up, vector, yellow

Quality Risk Reduction Plan Ppt PowerPoint Presentation File Show PDF
This slide covers risk control and reduction plan including work area or objectives, action taken, indicators to measure, timeframe and responsible department. Slidegeeks is here to make your presentations a breeze with Quality Risk Reduction Plan Ppt PowerPoint Presentation File Show PDF With our easy to use and customizable templates, you can focus on delivering your ideas rather than worrying about formatting. With a variety of designs to choose from, you are sure to find one that suits your needs. And with animations and unique photos, illustrations, and fonts, you can make your presentation pop. So whether you are giving a sales pitch or presenting to the board, make sure to check out Slidegeeks first.
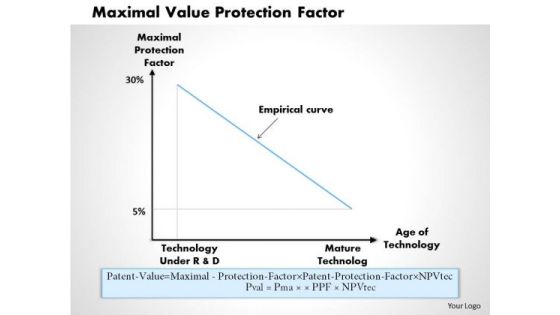
Business Framework Maximal Value Protection Factor PowerPoint Presentation
This business framework power point template has been designed with maximum value curve. This PPT contains the concept of calculating maximal value protection factor. Use this PPT in your marketing presentations.

Business Framework Project Management Process Flow PowerPoint Presentation
This diagram displays profitability ratio calculation template. Use this diagram in business and marketing presentations to depict profit returns of an organization. This diagram will enhance the quality of your presentations.
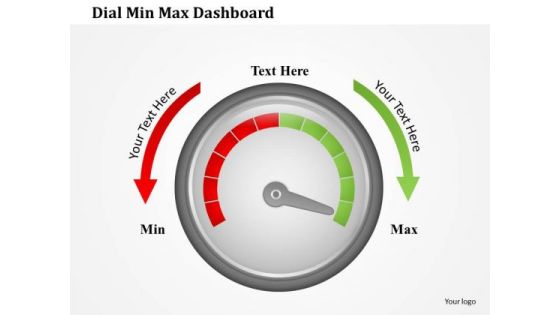
Business Framework Dial Min Max Dashboard PowerPoint Presentation
This professional power point template slide has been crafted with graphic of two funnels. These funnels are used to show any data calculation or process flow. Use this PPT for your business presentation and become a professional presenter.
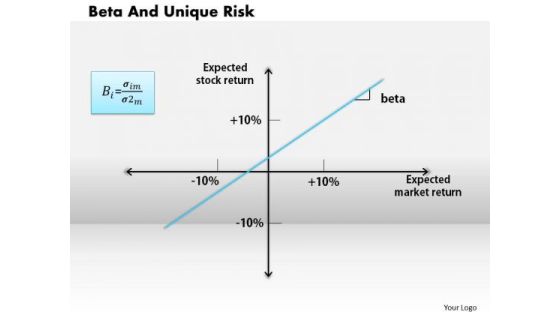
Business Framework Beta And Unique Risk PowerPoint Presentation
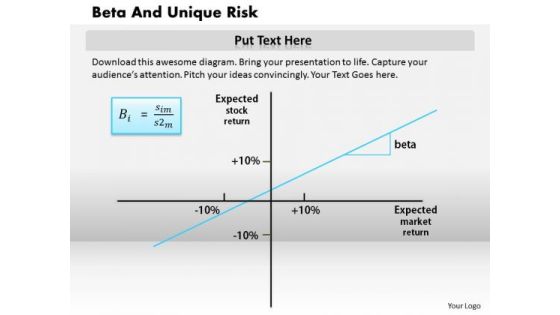
Explain the concept of calculating systematic risk of market with this unique power point diagram slide. This lide contains the graphic of X-Y chart with four different sections. Get the sense of price and finance risk with beta factor, define this factor in your financial presentation and display the clear picture of risk.
Business Framework Beta And Unique Risk PowerPoint Presentation 2
Define the concept of calculating risk of market with this power point diagram slide. This slide contains the graphic of X-Y chart with four different sections. Define the price and finance risk with beta factor, define this factor in your financial presentation and display the clear picture of risk.

Business Framework Capm Capital Asset Pricing Model PowerPoint Presentation
This exclusive PPT slide has been crafted with graphic of CAPM model. This model contains the concept of assets pricing which is a necessary factor to calculate risk. Use this model and build strong presentation to explain required return rate for any risky asset.
Business Framework Garbage Can Life Cycle Model PowerPoint Presentation
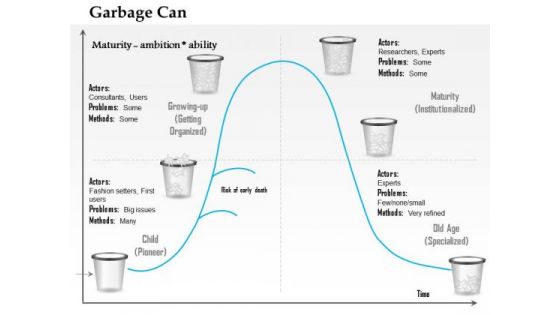
This image slide has been designed to display garbage can model of organizational choice. This image slide has been designed with graph having garbage line to calculate maturity. Use this image slide in business and marketing presentations. This image slide will enhance the quality of your presentations.

Business Framework Garbage Can Model Of Decision Making PowerPoint Presentation
This image slide has been designed to display garbage can model of decision making. This image slide has been designed with text boxes diagram having garbage line to calculate maturity. Use this image slide to express views on problems and solutions in management presentations. This image slide will enhance the quality of your presentations.

Business Framework Slide Showing Variances And Percentages PowerPoint Presentation
Green and red four arrows in reverse direction have been used to design this power point template slide. This PPT slide contains the concept of variance and percentage. Display finance and data calculation in your presentation by using this exclusive PPT slide.

Stock Photo 3d House Crossed With Chains Safety PowerPoint Slide
This exclusive image is designed for home safety measures. To display safety measures we have used graphic of 3d house crossed with chain. This image is useful for business and real-estate presentations.

Business Diagram What Is Brand Value PowerPoint Ppt Presentation
This diagram is based on concept of brand value. Use this diagram to measure brand value. Economic profits and brand earnings measures brand value. This template helps you to grab the attention of your listener.
Six Sigma Dmadv Project Business PowerPoint Template 0910
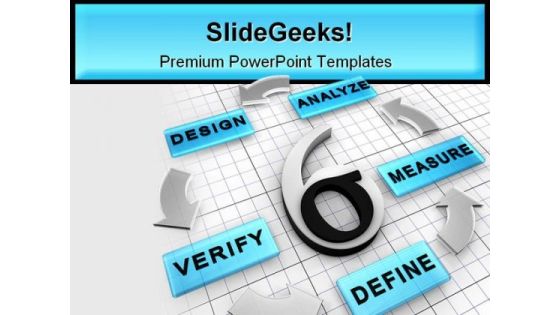
DMADV is a business management strategy for new project that has five steps: Define Measure Analyze Design Verify

Stock Photo Conceptual Image Of Target Achievement PowerPoint Slide
This amazing image is designed with arrows hitting the target board. This professional image may be used to describe business and sales target. Use this image to set targets and to measure performance in your presentations.

Stock Photo Arrow Hitting Target Dart PowerPoint Slide
This amazing image is designed with arrows hitting the target board. This professional image may be used to describe business and sales target. Use this image to set targets and to measure performance in your presentations.

Business Diagram Smart Goals Acronym PowerPoint Ppt Presentation
This slide displays smart goals acronym. This diagram provides details explanation of smart goals. Smart goals are specific, measurable, assignable, and realistic and time based. This template helps you to grab the attention of your listener.
Four Options With Gears Mike And Graph Icons Powerpoint Templates
Visually support your presentation with our above template illustrating four options infographic. You may use this diagram to exhibit growth measurement. Convey your views with this business diagram slide.
Traffic Cone With Tags And Icons PowerPoint Templates
This diagram contains graphics of traffic cone with tags and icons. Download this diagram slide to display traffic safety measures. This diagram provides an effective way of displaying information you can edit text, color, shade and style as per you need.

Seed Investment Revenue Model Ppt Show Visuals PDF
Presenting this set of slides with name seed investment revenue model ppt show visuals pdf. This is a nine stage process. The stages in this process are recurring revenue frequency, cash collections, expected conversion rate to get a paid client, life time value of a customer, example showing basic math. This is a completely editable PowerPoint presentation and is available for immediate download. Download now and impress your audience.
Ppt Arrow Change Management Process PowerPoint Presentation 3 Stages Style 1 Templates
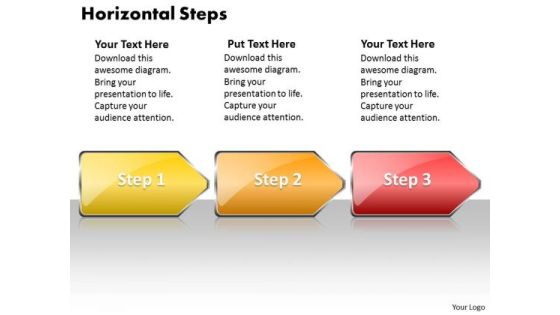
PPT arrow change management process powerpoint presentation 3 stages style 1 Templates-Use this PowerPoint diagram to communicate a great deal of information accurately and efficiently.-PPT arrow change management process powerpoint presentation 3 stages style 1 Templates-Arrow, Art, Attendance, Background, Blank, Blue, Chart, Clip, Clipart, Education, English, Graphic, Horizontal, Icon, Illustration, Landscape, Learning, Line, Listen, Math, Notes, Process, Purple, Read, Red, Review, Science
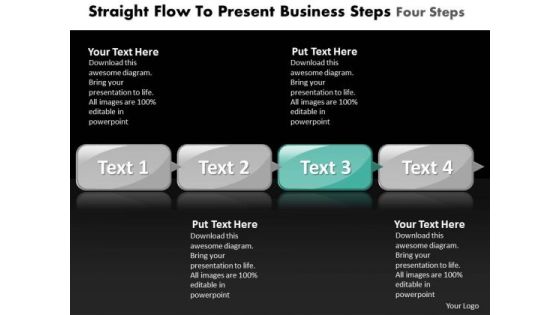
Ppt Straight Flow To Present Business PowerPoint Theme Steps Four Templates
PPT straight flow to present business powerpoint theme steps four Templates-Create visually stunning PPT Presentations and define message in a unique and inspiring manner with this PPt slide. Use this to enthuse your colleagues.-PPT straight flow to present business powerpoint theme steps four Templates-achieve, achievement, axis, background, banking, budget, business, chart, company, concept, corporate, director, economic, economy, firm, flow, ftse, goal, graph, green, human, increase, law, line, management, maths, money, national, personel, plan, profit, resources, retail, revenue, shop, statistic, straight, success, target
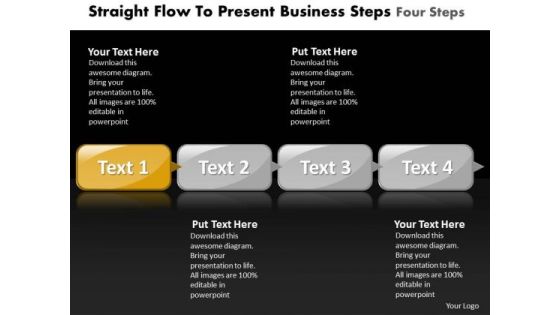
Ppt Straight Instance To Present Business PowerPoint Theme Steps Four Templates
PPT straight instance to present business powerpoint theme steps four Templates-This Diagram is appropriate layout for your information. Clear thinking is your strength; transmit your thoughts to your eager team-PPT straight instance to present business powerpoint theme steps four Templates-achieve, achievement, axis, background, banking, budget, business, chart, company, concept, corporate, director, economic, economy, firm, flow, ftse, goal, graph, green, human, increase, law, line, management, maths, money, national, personel, plan, profit, resources, retail, revenue, shop, statistic, straight, success, target
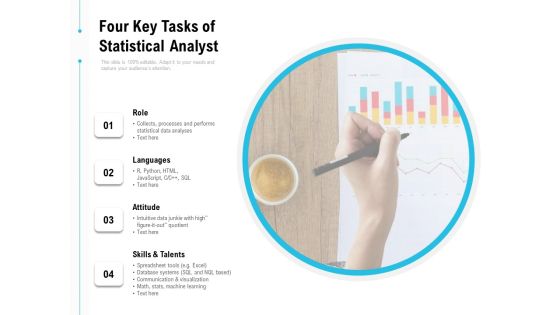
Four Key Tasks Of Statistical Analyst Ppt PowerPoint Presentation Model Slides PDF
Persuade your audience using this four key tasks of statistical analyst ppt powerpoint presentation model slides pdf. This PPT design covers four stages, thus making it a great tool to use. It also caters to a variety of topics including skills and talents, communication and visualization, math, stats, machine learning, processes and performs, statistical data analyses. Download this PPT design now to present a convincing pitch that not only emphasizes the topic but also showcases your presentation skills.
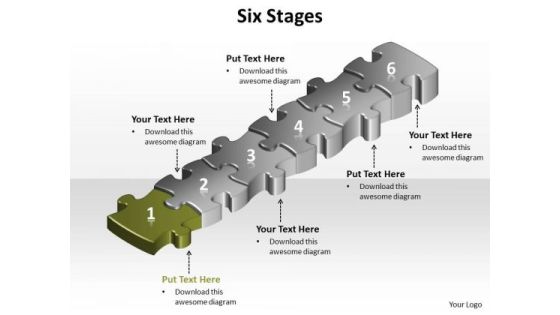
Ppt Green Puzzle Modifying Slide Layouts PowerPoint Free Download Step Templates
PPT green puzzle modifying slide layouts powerpoint free download step Templates-This PowerPoint Diagram shows the Complete Process Represented by Green Puzzle. It signifies the Whole Process that is involved in Business. This PowerPoint diagram will fit for Business Presentations.-PPT green puzzle modifying slide layouts powerpoint free download step Templates-1, 2, 3, 4, 5, 6, abstract, alphabet, background, beginning, blue, calculations, childhood, colorful, count, cutout, design, easy, education, eight, elementary, figure, fun, green, indoor, isolated, knowledge, learn, letter, maths, nine, number, object, one, pieces, play, preschool, puzzle, scattered, step, still, studio, symbol, text, three, two, type, typeset, white, yellow

Ppt Straight PowerPoint Design Download To Present Business Steps Four Templates
PPT straight powerpoint design download to present business steps four Templates-This diagram can be used to illustrate the logical path or system. Explain the specific subject matter like your team is so inspired and aligned that they share their exciting vision with their leaders and they become inspired in their role.-PPT straight powerpoint design download to present business steps four Templates-achieve, achievement, axis, background, banking, budget, business, chart, company, concept, corporate, director, economic, economy, firm, flow, ftse, goal, graph, green, human, increase, law, line, management, maths, money, national, personel, plan, profit, resources, retail, revenue, shop, statistic, straight, success, target

Social Enterprise Funding Revenue Model Ppt PowerPoint Presentation Show File Formats PDF
Presenting this set of slides with name social enterprise funding revenue model ppt powerpoint presentation show file formats pdf. This is a nine stage process. The stages in this process are recurring revenue frequency, gross and net revenue, business, example showing basic math, cash collections immediately 30 90 days, expected conversion rate to get a paid client, expected arpu, life time value of a customer. This is a completely editable PowerPoint presentation and is available for immediate download. Download now and impress your audience.

Social Enterprise Funding Revenue Streams Ppt PowerPoint Presentation Model Graphics Design PDF
Presenting this set of slides with name social enterprise funding revenue streams ppt powerpoint presentation model graphics design pdf. This is a four stage process. The stages in this process are recurring revenue frequency, gross and net revenue, business, example showing basic math, cash collections immediately 30 90 days, expected conversion rate to get a paid client, expected arpu, life time value of a customer. This is a completely editable PowerPoint presentation and is available for immediate download. Download now and impress your audience.
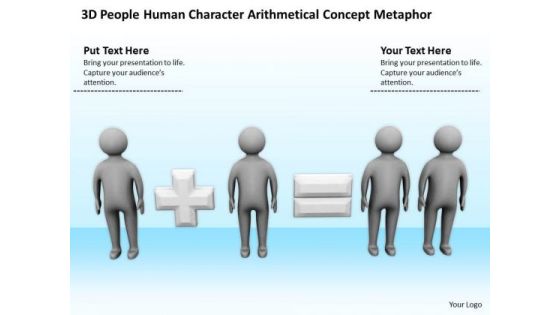
Business People Pictures Concept Metaphor PowerPoint Templates Ppt Backgrounds For Slides
We present our business people pictures concept metaphor PowerPoint templates PPT backgrounds for slides.Present our People PowerPoint Templates because Our PowerPoint Templates and Slides will fulfill your every need. Use them and effectively satisfy the desires of your audience. Use our Business PowerPoint Templates because our PowerPoint Templates and Slides are the string of your bow. Fire of your ideas and conquer the podium. Download and present our Education PowerPoint Templates because You aspire to touch the sky with glory. Let our PowerPoint Templates and Slides provide the fuel for your ascent. Download our Signs PowerPoint Templates because You aspire to touch the sky with glory. Let our PowerPoint Templates and Slides provide the fuel for your ascent. Download and present our Marketing PowerPoint Templates because You have gained great respect for your brilliant ideas. Use our PowerPoint Templates and Slides to strengthen and enhance your reputation.Use these PowerPoint slides for presentations relating to 3d, abstract, adorable, arithmetic, art, cartoon, cg, cgi, character, child, class, classroom, communication, concept, cute, desk, education, gilded, human, humanoid, icon, idea, idiom, illustration, kid, learning, little, math, mathematical, mathematics, metaphor, number, person, presentation, pupil, render, school, student, stylized, symbol, toon, young, youth. The prominent colors used in the PowerPoint template are Gray, White, Black.

Business Men PowerPoint Templates Download Man Standing Near Big Calculator Slides
We present our business men powerpoint templates download man standing near big calculator Slides.Present our Business PowerPoint Templates because Timeline crunches are a fact of life. Meet all deadlines using our PowerPoint Templates and Slides. Use our Finance PowerPoint Templates because Our PowerPoint Templates and Slides are focused like a searchlight beam. They highlight your ideas for your target audience. Download our Success PowerPoint Templates because Our PowerPoint Templates and Slides are a sure bet. Gauranteed to win against all odds. Download our Marketing PowerPoint Templates because You can Bait your audience with our PowerPoint Templates and Slides. They will bite the hook of your ideas in large numbers. Download and present our Future PowerPoint Templates because Our PowerPoint Templates and Slides help you meet the demand of the Market. Just browse and pick the slides that appeal to your intuitive senses.Use these PowerPoint slides for presentations relating to 3d, abstract, accountant, add, analyzing, balance, banking, business,businessman, calculator, character, computer, concept, data, digital,display, economy, equal, finance, financial, human, idea, illustration, image,isolated, job, male, man, manager, math, mathematical, mind, minus, number,office, people, person, plastic, professional, render, science, sign, small,subtraction, technology, white, work. The prominent colors used in the PowerPoint template are Blue, Gray, Black.
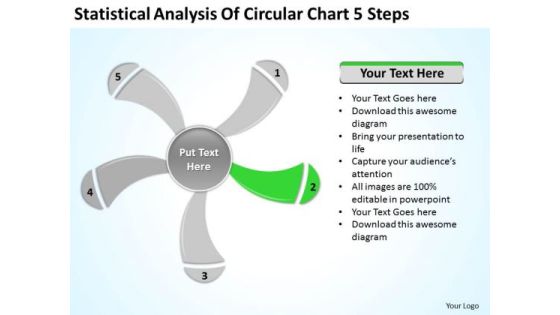
Statistical Analysis Of Circular Chart 5 Steps Ppt Business Plan PowerPoint Slide
We present our statistical analysis of circular chart 5 steps ppt business plan PowerPoint Slide.Download and present our Business PowerPoint Templates because Our PowerPoint Templates and Slides will definately Enhance the stature of your presentation. Adorn the beauty of your thoughts with their colourful backgrounds. Use our Signs PowerPoint Templates because Our PowerPoint Templates and Slides will give good value for money. They also have respect for the value of your time. Download our Shapes PowerPoint Templates because Our PowerPoint Templates and Slides team portray an attitude of elegance. Personify this quality by using them regularly. Use our Metaphors-Visual Concepts PowerPoint Templates because Our PowerPoint Templates and Slides will effectively help you save your valuable time. They are readymade to fit into any presentation structure. Use our Process and Flows PowerPoint Templates because our PowerPoint Templates and Slides are the string of your bow. Fire of your ideas and conquer the podium.Use these PowerPoint slides for presentations relating to graphically, graphic, vector, layout, business, computation, sign, infochart, visual, symbol, template, diagram, calculations, sector, data, revenue, schedule, element, analysis, drawing, report, technology, contour, classification, graph, modern, illustration, icon, comparison, object, chart, collection, science, color, growth, composition, professional, set, education, math, profits, information, symmetry, statistic, structure, infographics, button. The prominent colors used in the PowerPoint template are Green, Gray, White.

Square 6 Stages Concentric Flow Chart Ppt Business Plan PowerPoint Template
We present our square 6 stages concentric flow chart ppt business plan PowerPoint template.Use our Business PowerPoint Templates because Our PowerPoint Templates and Slides will provide weight to your words. They will bring out the depth of your thought process. Download our Signs PowerPoint Templates because Our PowerPoint Templates and Slides are the chords of your song. String them along and provide the lilt to your views. Download our Shapes PowerPoint Templates because You are an avid believer in ethical practices. Highlight the benefits that accrue with our PowerPoint Templates and Slides. Download our Boxes PowerPoint Templates because you should Experience excellence with our PowerPoint Templates and Slides. They will take your breath away. Use our Process and Flows PowerPoint Templates because It can Conjure up grand ideas with our magical PowerPoint Templates and Slides. Leave everyone awestruck by the end of your presentation.Use these PowerPoint slides for presentations relating to 60s, 70s, art, background, decoration, decorative, design, fractal, generative, genetic, geometrical, hippie, illusion, illustration, kaleidoscope, kaleidoscopic, landscape, math, mathematical, mosaic, op, optical, optical illusion, pattern, pop, psychedelic, raytrace, retro, sculpture, seamless, seventies, sixties, symmetric, synthetic, vintage, virtual, virtual sculpture, wallpaper. The prominent colors used in the PowerPoint template are Green, Gray, White.
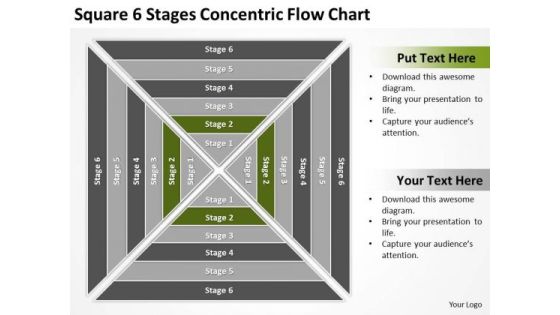
Square 6 Stages Concentric Flow Chart Ppt Business Plan PowerPoint Templates
We present our square 6 stages concentric flow chart ppt business plan PowerPoint templates.Use our Business PowerPoint Templates because Our PowerPoint Templates and Slides team portray an attitude of elegance. Personify this quality by using them regularly. Present our Signs PowerPoint Templates because Our PowerPoint Templates and Slides are topically designed to provide an attractive backdrop to any subject. Use our Shapes PowerPoint Templates because Our PowerPoint Templates and Slides will definately Enhance the stature of your presentation. Adorn the beauty of your thoughts with their colourful backgrounds. Use our Boxes PowerPoint Templates because Our PowerPoint Templates and Slides are created by a hardworking bunch of busybees. Always flitting around with solutions gauranteed to please. Use our Process and Flows PowerPoint Templates because Our PowerPoint Templates and Slides will provide weight to your words. They will bring out the depth of your thought process.Use these PowerPoint slides for presentations relating to 60s, 70s, art, background, decoration, decorative, design, fractal, generative, genetic, geometrical, hippie, illusion, illustration, kaleidoscope, kaleidoscopic, landscape, math, mathematical, mosaic, op, optical, optical illusion, pattern, pop, psychedelic, raytrace, retro, sculpture, seamless, seventies, sixties, symmetric, synthetic, vintage, virtual, virtual sculpture, wallpaper. The prominent colors used in the PowerPoint template are Green, Gray, White.
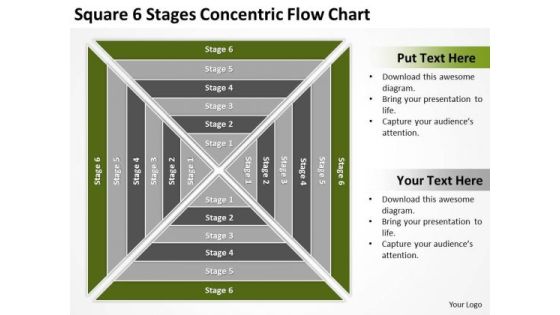
Square 6 Stages Concentric Flow Chart Ppt Sample Small Business Plan PowerPoint Slides
We present our square 6 stages concentric flow chart ppt sample small business plan PowerPoint Slides.Present our Business PowerPoint Templates because Our PowerPoint Templates and Slides are conceived by a dedicated team. Use them and give form to your wondrous ideas. Use our Signs PowerPoint Templates because Our PowerPoint Templates and Slides will let you Clearly mark the path for others to follow. Download and present our Shapes PowerPoint Templates because Our PowerPoint Templates and Slides come in all colours, shades and hues. They help highlight every nuance of your views. Use our Boxes PowerPoint Templates because Our PowerPoint Templates and Slides are like the strings of a tennis racquet. Well strung to help you serve aces. Download our Process and Flows PowerPoint Templates because It will let you Set new benchmarks with our PowerPoint Templates and Slides. They will keep your prospects well above par.Use these PowerPoint slides for presentations relating to 60s, 70s, art, background, decoration, decorative, design, fractal, generative, genetic, geometrical, hippie, illusion, illustration, kaleidoscope, kaleidoscopic, landscape, math, mathematical, mosaic, op, optical, optical illusion, pattern, pop, psychedelic, raytrace, retro, sculpture, seamless, seventies, sixties, symmetric, synthetic, vintage, virtual, virtual sculpture, wallpaper. The prominent colors used in the PowerPoint template are Green, Gray, White.

Square 6 Stages Concentric Flow Chart Ppt Template For Business Plan PowerPoint Templates
We present our square 6 stages concentric flow chart ppt template for business plan PowerPoint templates.Use our Business PowerPoint Templates because Our PowerPoint Templates and Slides offer you the widest possible range of options. Download and present our Signs PowerPoint Templates because Our PowerPoint Templates and Slides are specially created by a professional team with vast experience. They diligently strive to come up with the right vehicle for your brilliant Ideas. Present our Shapes PowerPoint Templates because Our PowerPoint Templates and Slides come in all colours, shades and hues. They help highlight every nuance of your views. Use our Boxes PowerPoint Templates because You have a driving passion to excel in your field. Our PowerPoint Templates and Slides will prove ideal vehicles for your ideas. Present our Process and Flows PowerPoint Templates because You can Channelise the thoughts of your team with our PowerPoint Templates and Slides. Urge them to focus on the goals you have set.Use these PowerPoint slides for presentations relating to 60s, 70s, art, background, decoration, decorative, design, fractal, generative, genetic, geometrical, hippie, illusion, illustration, kaleidoscope, kaleidoscopic, landscape, math, mathematical, mosaic, op, optical, optical illusion, pattern, pop, psychedelic, raytrace, retro, sculpture, seamless, seventies, sixties, symmetric, synthetic, vintage, virtual, virtual sculpture, wallpaper. The prominent colors used in the PowerPoint template are Green, Gray, White.

Statistical Analysis Of Circular Chart 5 Steps Ppt Business Plan PowerPoint Slides
We present our statistical analysis of circular chart 5 steps ppt business plan PowerPoint Slides.Download and present our Business PowerPoint Templates because Timeline crunches are a fact of life. Meet all deadlines using our PowerPoint Templates and Slides. Present our Signs PowerPoint Templates because You can Zap them with our PowerPoint Templates and Slides. See them reel under the impact. Use our Shapes PowerPoint Templates because It can Bubble and burst with your ideas. Download our Metaphors-Visual Concepts PowerPoint Templates because You can Create a matrix with our PowerPoint Templates and Slides. Feel the strength of your ideas click into place. Present our Process and Flows PowerPoint Templates because Our PowerPoint Templates and Slides has conjured up a web of all you need with the help of our great team. Use them to string together your glistening ideas.Use these PowerPoint slides for presentations relating to graphically, graphic, vector, layout, business, computation, sign, infochart, visual, symbol, template, diagram, calculations, sector, data, revenue, schedule, element, analysis, drawing, report, technology, contour, classification, graph, modern, illustration, icon, comparison, object, chart, collection, science, color, growth, composition, professional, set, education, math, profits, information, symmetry, statistic, structure, infographics, button. The prominent colors used in the PowerPoint template are Yellow, Gray, White.
 Home
Home