AI PPT Maker
Templates
PPT Bundles
Design Services
Business PPTs
Business Plan
Management
Strategy
Introduction PPT
Roadmap
Self Introduction
Timelines
Process
Marketing
Agenda
Technology
Medical
Startup Business Plan
Cyber Security
Dashboards
SWOT
Proposals
Education
Pitch Deck
Digital Marketing
KPIs
Project Management
Product Management
Artificial Intelligence
Target Market
Communication
Supply Chain
Google Slides
Research Services
 One Pagers
All Categories
-
Home
- Customer Favorites
- Marketing Statistics
Marketing Statistics

Bar Graph Ppt PowerPoint Presentation Template
This is a bar graph ppt powerpoint presentation template. This is a six stage process. The stages in this process are graph, business, marketing, finance.

Bar Graph Ppt PowerPoint Presentation File Show
This is a bar graph ppt powerpoint presentation file show. This is a four stage process. The stages in this process are business, marketing, graph, growth, finance.

Bar Graph Ppt PowerPoint Presentation Summary Inspiration
This is a bar graph ppt powerpoint presentation summary inspiration. This is a four stage process. The stages in this process are graph, business, marketing, growth, years.

3 Steps Converging Arrow Process Layout Cycle Flow Diagram PowerPoint Template
We present our 3 steps converging arrow process layout Cycle Flow Diagram PowerPoint template.Present our Flow Charts PowerPoint Templates because this template helps you to put your finger on the pulse of your business and sense the need to re-align a bit. Present our Business PowerPoint Templates because this diagram is designed to help your audience to develop their thoughts along the way. Present our Shapes PowerPoint Templates because this diagram put it all together to form the complete picture and reach the goal. Present our Success PowerPoint Templates because the choices you make today will determine the future growth of your enterprise. Use our Arrows PowerPoint Templates because individual components well researched and understood in their place.Use these PowerPoint slides for presentations relating to Arrow, Business, Chart, Circular, Concept, Diagram, Informative, Internet, Market, Marketing, Member, Performance, Process, Profit, Profitable, Project, Refer, Referral, Referring, Revenue, Socialize, Steps, Strategy, Web, Websites. The prominent colors used in the PowerPoint template are Yellow, White, Gray. People tell us our 3 steps converging arrow process layout Cycle Flow Diagram PowerPoint template are aesthetically designed to attract attention. We guarantee that they will grab all the eyeballs you need. Customers tell us our Concept PowerPoint templates and PPT Slides will make the presenter successul in his career/life. People tell us our 3 steps converging arrow process layout Cycle Flow Diagram PowerPoint template are second to none. Professionals tell us our Diagram PowerPoint templates and PPT Slides will help them to explain complicated concepts. Customers tell us our 3 steps converging arrow process layout Cycle Flow Diagram PowerPoint template are Spiffy. Use our Market PowerPoint templates and PPT Slides are Reminiscent.

5 Arrows Placed In Order What Is Flow Chart Used For PowerPoint Templates
We present our 5 arrows placed in order what is flow chart used for PowerPoint templates.Use our Arrows PowerPoint Templates because,Different personalities, different abilities but formidable together. Use our Shapes PowerPoint Templates because, As a result we often end up with errors. Use our Signs PowerPoint Templates because,It builds on your foundation or prepares for change ahead to enhance the future. Use our Business PowerPoint Templates because,The fruits of your labour are beginning to show.Enlighten them on the great plans you have for their enjoyment Use our Process and Flows PowerPoint Templates because,This diagram helps you to develop your marketing strategy and communicate your enthusiasm and motivation to raise the bar.Use these PowerPoint slides for presentations relating to abstract, access, arrow, background, bright, business, chart, color, colorful, concept, conceptual, connection, corporate, creative, cycle, design, different, element, empty, frame, graphic, group, idea, illustration, match, message, part, piece, place, process, shape, solution, special, speech, strategy, symbol, template,. The prominent colors used in the PowerPoint template are Pink, Blue, Black. People tell us our 5 arrows placed in order what is flow chart used for PowerPoint templates are Fabulous. The feedback we get is that our bright PowerPoint templates and PPT Slides are Whimsical. People tell us our 5 arrows placed in order what is flow chart used for PowerPoint templates are Fun. Presenters tell us our business PowerPoint templates and PPT Slides effectively help you save your valuable time. The feedback we get is that our 5 arrows placed in order what is flow chart used for PowerPoint templates are Flirty. Professionals tell us our business PowerPoint templates and PPT Slides are Elegant.

Youtube Advertising Strategy For Building Brand Reach Reasons To Choose Youtube Introduction PDF
This slide represents the need for using YouTube advertising to enhance customer engagement rates and build brand awareness. It includes details related to YouTube advertising statistics. There are so many reasons you need a Youtube Advertising Strategy For Building Brand Reach Reasons To Choose Youtube Introduction PDF. The first reason is you can not spend time making everything from scratch, Thus, Slidegeeks has made presentation templates for you too. You can easily download these templates from our website easily.

Merry Christmas Around The World Strategic Planning Flow Chart PowerPoint Templates
We present our merry christmas around the world strategic planning flow chart PowerPoint templates.Download our Events PowerPoint Templates because this diagram helps you to develop your marketing strategy and communicate your enthusiasm and motivation to raise the bar. Use our Holidays PowerPoint Templates because they will help you to organise the logic of your views. Present our Festival PowerPoint Templates because this PPt Enlighten others on your team with your views. Download our Religion PowerPoint Templates because you can Inform your team of the various means they have to achieve them. Download our Spheres PowerPoint Templates because it Shines the light on your thoughts and motivates your team to improve the quality of celebration for all around you.Use these PowerPoint slides for presentations relating to Background, Business, Celebration, Christmas, Conceptual, Congratulation, Design, Element, Events, Graphic, Greeting, Holidays, Inscription, Invitation, Merry, Mistletoe, Phrase, Sign, Style, Wishes. The prominent colors used in the PowerPoint template are Red, Yellow, White. Customers tell us our merry christmas around the world strategic planning flow chart PowerPoint templates are Spiffy. The feedback we get is that our Element PowerPoint templates and PPT Slides provide you with a vast range of viable options. Select the appropriate ones and just fill in your text. Professionals tell us our merry christmas around the world strategic planning flow chart PowerPoint templates are Luxuriant. People tell us our Conceptual PowerPoint templates and PPT Slides are Functional. Customers tell us our merry christmas around the world strategic planning flow chart PowerPoint templates are Glamorous. Professionals tell us our Conceptual PowerPoint templates and PPT Slides are Efficacious.

Performance Analysis Bar Graph Powerpoint Shapes
This is a performance analysis bar graph powerpoint shapes. This is a four stage process. The stages in this process are growth, finance, strategy, management, marketing.

Bar Graph Ppt PowerPoint Presentation Gallery Outline
This is a bar graph ppt powerpoint presentation gallery outline. This is a five stage process. The stages in this process are business, marketing, strategy, growth, success.

Bar Graph Ppt PowerPoint Presentation Outline Backgrounds
This is a bar graph ppt powerpoint presentation outline backgrounds. This is a five stage process. The stages in this process are planning, marketing, business, management, strategy.

Bar Graph Ppt PowerPoint Presentation Pictures Picture
This is a bar graph ppt powerpoint presentation pictures picture. This is a three stage process. The stages in this process are business, marketing, strategy, planning, finance.

Enterprise Survey Tool Used By Organization Survey SS
Following slides shows the one page business survey tool used by different organization to enhance efficiency. It basically depends upon certain parameters such as online business survey, different department used different department, etc. Showcasing this set of slides titled Enterprise Survey Tool Used By Organization Survey SS. The topics addressed in these templates are Online Business Survey Tool, Market Research, Survey Tools, Social Media. All the content presented in this PPT design is completely editable. Download it and make adjustments in color, background, font etc. as per your unique business setting.

Summary Of Business Product Survey Questionnaire Results Survey SS
This slide summarizing the overall result of product market survey conduct by owner to improve the quality of product and meet the customer demands . Results are provided related to quality of product, pricing of product etc. Pitch your topic with ease and precision using this Summary Of Business Product Survey Questionnaire Results Survey SS. This layout presents information on Summary Of Business, Product Survey, Questionnaire Results. It is also available for immediate download and adjustment. So, changes can be made in the color, design, graphics or any other component to create a unique layout.

Bar Graph Ppt PowerPoint Presentation Portfolio Vector
This is a bar graph ppt powerpoint presentation portfolio vector. This is a nine stage process. The stages in this process are business, marketing, graph, finance, growth.

Bar Graph Ppt PowerPoint Presentation Styles Picture
This is a bar graph ppt powerpoint presentation styles picture. This is a four stage process. The stages in this process are business, strategy, marketing, analysis, chart and graph, bar graph.

Checklist For Tracking Exporting Process Status Ppt Infographic Template Format PDF
This slide represents checklist for exporters and venture to tracking trading progress status. It includes planning, market research, competitor analysis, export service provider etc. Present like a pro with Checklist For Tracking Exporting Process Status Ppt Infographic Template Format PDF Create beautiful presentations together with your team, using our easy-to-use presentation slides. Share your ideas in real-time and make changes on the fly by downloading our templates. So whether you are in the office, on the go, or in a remote location, you can stay in sync with your team and present your ideas with confidence. With Slidegeeks presentation got a whole lot easier. Grab these presentations today.

Security Analysis Bar Graph Ppt Slides
This is a security analysis bar chart ppt slides. This is a one stage process. The stages in this process are business, finance, marketing.

Tools For Improving Sales Plan Effectiveness Strategic Components Of An Effective Sales Strategy Elements PDF
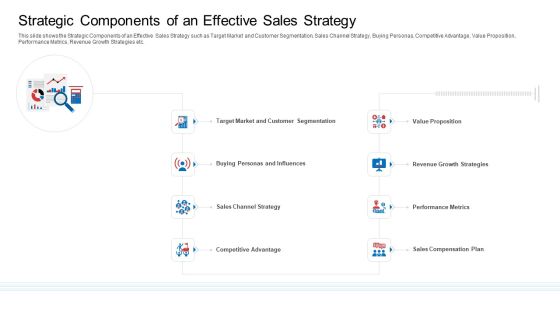
This slide shows the Strategic Components of an Effective Sales Strategy such as Target Market and Customer Segmentation, Sales Channel Strategy, Buying Personas, Competitive Advantage, Value Proposition, Performance Metrics, Revenue Growth Strategies etc. Presenting tools for improving sales plan effectiveness strategic components of an effective sales strategy elements pdf to provide visual cues and insights. Share and navigate important information on eight stages that need your due attention. This template can be used to pitch topics like value proposition, performance metrics, growth strategies, compensation plan, competitive advantage. In addtion, this PPT design contains high resolution images, graphics, etc, that are easily editable and available for immediate download.
Strategic Plan To Increase Sales Volume And Revenue Strategic Components Of An Effective Sales Strategy Microsoft PDF
This slide shows the Strategic Components of an Effective Sales Strategy such as Target Market and Customer Segmentation, Sales Channel Strategy, Buying Personas, Competitive Advantage, Value Proposition, Performance Metrics, Revenue Growth Strategies etc. Presenting strategic plan to increase sales volume and revenue strategic components of an effective sales strategy microsoft pdf to provide visual cues and insights. Share and navigate important information on eight stages that need your due attention. This template can be used to pitch topics like value proposition, performance metrics, growth strategies, compensation plan, competitive advantage. In addtion, this PPT design contains high resolution images, graphics, etc, that are easily editable and available for immediate download.

Bar Graph Ppt PowerPoint Presentation Diagrams
This is a bar graph ppt powerpoint presentation diagrams. This is a nine stage process. The stages in this process are business, marketing, success, management, growth.

Bar Graph Ppt PowerPoint Presentation File Portfolio
This is a bar graph ppt powerpoint presentation file portfolio. This is a twelve stage process. The stages in this process are financial, marketing, management, business, strategy.

Bar Graph Ppt PowerPoint Presentation File Picture
This is a bar graph ppt powerpoint presentation file picture. This is a six stage process. The stages in this process are management, planning, marketing, business, strategy.

Data Lake Development With Azure Cloud Software Purpose Of Data Lake In Business Diagrams PDF
This slide depicts the purpose of the data lake in the business such as beneficial for time to market analytics, IT driven business process, cost effective decisions, and so on. This is a Data Lake Development With Azure Cloud Software Purpose Of Data Lake In Business Diagrams PDF template with various stages. Focus and dispense information on seven stages using this creative set, that comes with editable features. It contains large content boxes to add your information on topics like Implementing, Data Lake, Enables Businesses. You can also showcase facts, figures, and other relevant content using this PPT layout. Grab it now.
Bar Graph Chart For Showing Performance Analysis Ppt Design
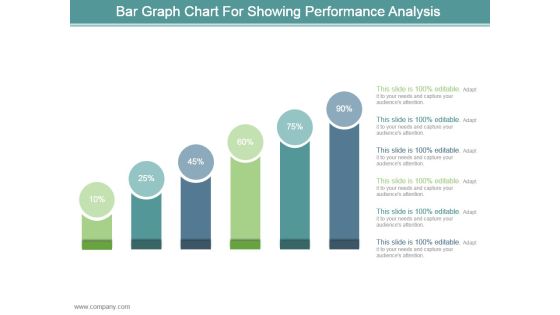
This is a bar graph chart for showing performance analysis ppt design. This is a six stage process. The stages in this process are business, marketing, process, success, presentation.

Tactical Communication Plan Target Audience Identification Checklist With Status Topics PDF
This slide shows the checklist used to determine target audience which covers parameters such as conducting market research, analysing industry trends, creating buyer personas, determining ideal audience, etc. Find a pre-designed and impeccable Tactical Communication Plan Target Audience Identification Checklist With Status Topics PDF. The templates can ace your presentation without additional effort. You can download these easy-to-edit presentation templates to make your presentation stand out from others. So, what are you waiting for Download the template from Slidegeeks today and give a unique touch to your presentation.

Customer Service Plan To Improve Sales Target Audience Identification Checklist With Status Ideas PDF
This slide shows the checklist used to determine target audience which covers parameters such as conducting market research, analysing industry trends, creating buyer personas, determining ideal audience, etc. The best PPT templates are a great way to save time, energy, and resources. Slidegeeks have 100 percent editable powerpoint slides making them incredibly versatile. With these quality presentation templates, you can create a captivating and memorable presentation by combining visually appealing slides and effectively communicating your message. Download Customer Service Plan To Improve Sales Target Audience Identification Checklist With Status Ideas PDF from Slidegeeks and deliver a wonderful presentation.
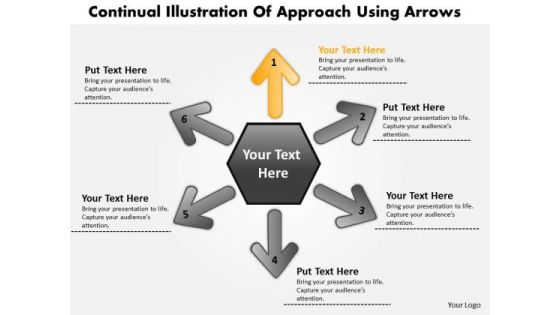
Illustration Of 6 Approach Using Arrows Circular Flow Motion Network PowerPoint Templates
We present our illustration of 6 approach using arrows Circular Flow Motion Network PowerPoint templates.Download our Arrows PowerPoint Templates because you will be able to Highlight your ideas broad-based on strong fundamentals and illustrate how they step by step acheive the set growth factor. Use our Hexagon PowerPoint Templates because this diagram helps you to develop your marketing strategy and communicate your enthusiasm and motivation to raise the bar. Use our Process and Flows PowerPoint Templates because our template will illustrate what you want to say. Use our Business PowerPoint Templates because your fledgling career is in the chrysallis stage. Nurture it and watch it grow into a beautiful butterfly. Present our Shapes PowerPoint Templates because you can Inform your team of the various means they have to achieve them.Use these PowerPoint slides for presentations relating to Abstract, Around, Arrows, Background, Blue, Center, Chart, Circle, Circular, Concept, Connection, Copy, Copyspace, Curve, Cycle, Distribution, Empty, Five, Gold, Graph, Illustration, Objects, Pieces, Process, Round, Segment, Shape, Space, System, Technology, Vector. The prominent colors used in the PowerPoint template are Yellow, Gray, Black. Professionals tell us our illustration of 6 approach using arrows Circular Flow Motion Network PowerPoint templates are Whimsical. You can be sure our Blue PowerPoint templates and PPT Slides are Lush. Customers tell us our illustration of 6 approach using arrows Circular Flow Motion Network PowerPoint templates will save the presenter time. Professionals tell us our Circular PowerPoint templates and PPT Slides are No-nonsense. People tell us our illustration of 6 approach using arrows Circular Flow Motion Network PowerPoint templates are Liberated. People tell us our Background PowerPoint templates and PPT Slides are Breathtaking.

Mhealth Investor Funding Elevator Pitch Deck Key Stats For Our Organziaiton Professional PDF
Purpose of the following slide is to show the key stats of the organization as it displays the organizations growth rate along with its weekly growth and its market share Deliver and pitch your topic in the best possible manner with this mhealth investor funding elevator pitch deck key stats for our organziaiton professional pdf Use them to share invaluable insights on twitter followers, majestic referring domains, organization and impress your audience. This template can be altered and modified as per your expectations. So, grab it now.
Ppt 3 Reasons You Should Buy From Us Process Tables PowerPoint Templates
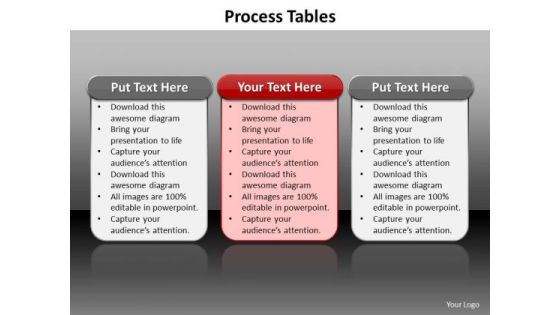
PPT 3 reasons you should buy from us process tables PowerPoint Templates-This PowerPoint Diagram consists of three process tables highlighting the Red one in the Middle. It signifies agenda, appendix, canon, catalogue, chart, digest, graph, illustration, index, inventory, list, plan, record, schedule, statistics, summary, synopsis etc.-Can be used for presentations on advertising, arrow, business, buy, characteristics, choice, commercial, competition, competitors, confused, decide, different, direction, guide, many, marketing, online, purchase, reasons, retailers, selling, shop, sign, store, turn, words-PPT 3 reasons you should buy from us process tables PowerPoint Templates

Introduction To Artificial Intelligence In Operation Management Industry Key Industry Stats For AIOPS Technology Summary PDF
Purpose of the following slide is to show the global Artificial intelligence market by service, it showcases key service areas such as consulting service, training and education, license and maintenance etc. Make sure to capture your audiences attention in your business displays with our gratis customizable Introduction To Artificial Intelligence In Operation Management Industry Key Industry Stats For AIOPS Technology Summary PDF. These are great for business strategies, office conferences, capital raising or task suggestions. If you desire to acquire more customers for your tech business and ensure they stay satisfied, create your own sales presentation with these plain slides.
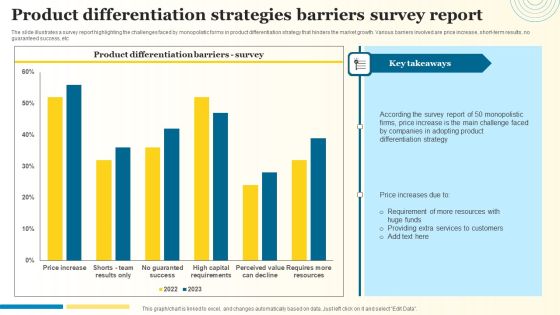
Product Differentiation Strategies Barriers Survey Report Introduction PDF
The slide illustrates a survey report highlighting the challenges faced by monopolistic forms in product differentiation strategy that hinders the market growth. Various barriers involved are price increase, short-term results, no guaranteed success, etc. Pitch your topic with ease and precision using this Product Differentiation Strategies Barriers Survey Report Introduction PDF. This layout presents information on Differentiation Strategy, Adopting Product, Price Increase. It is also available for immediate download and adjustment. So, changes can be made in the color, design, graphics or any other component to create a unique layout.

Bar Graph Ppt PowerPoint Presentation Gallery Skills
This is a bar graph ppt powerpoint presentation gallery skills. This is a four stage process. The stages in this process are in percentage, bar graph, business, marketing, product.

Bar Graph Ppt PowerPoint Presentation Model Clipart
This is a bar graph ppt powerpoint presentation model clipart. This is a six stage process. The stages in this process are sales in percentage, product, bar graph, business, marketing.

Bar Graph Ppt PowerPoint Presentation Outline Layout
This is a bar graph ppt powerpoint presentation outline layout. This is a four stage process. The stages in this process are sales in percentage, product, bar graph, business, marketing.

Bar Graph Ppt PowerPoint Presentation Professional Guide
This is a bar graph ppt powerpoint presentation professional guide. This is a eight stage process. The stages in this process are axis title, bar graph, business, marketing, management.

Data Analytics In Business Sector Ppt Show Smartart PDF
This slide represents the data science application in business and its benefits, such as gaining customer insights, increased security, streamlining manufacturing, and predicting future market trends. This is a data analytics in business sector ppt show smartart pdf template with various stages. Focus and dispense information on five stages using this creative set, that comes with editable features. It contains large content boxes to add your information on topics like demographic, target, business services, management, financial. You can also showcase facts, figures, and other relevant content using this PPT layout. Grab it now.

Information Studies Data Science In Business Sector Download PDF
This slide represents the data science application in business and its benefits, such as gaining customer insights, increased security, streamlining manufacturing, and predicting future market trends. This is a Information Studies Data Science In Business Sector Download PDF template with various stages. Focus and dispense information on five stages using this creative set, that comes with editable features. It contains large content boxes to add your information on topics like Inform Internal Finances, Streamline Manufacturing, Increase Security. You can also showcase facts, figures, and other relevant content using this PPT layout. Grab it now.
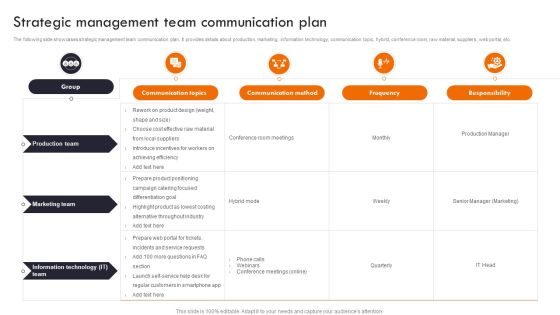
Gaining Competitive Edge Strategic Management Team Communication Plan Structure PDF
The following slide showcases strategic management team communication plan. It provides details about production, marketing, information technology, communication topic, hybrid, conference room, raw material, suppliers, web portal, etc. Are you searching for a Gaining Competitive Edge Strategic Management Team Communication Plan Structure PDF that is uncluttered, straightforward, and original Its easy to edit, and you can change the colors to suit your personal or business branding. For a presentation that expresses how much effort youve put in, this template is ideal With all of its features, including tables, diagrams, statistics, and lists, its perfect for a business plan presentation. Make your ideas more appealing with these professional slides. Download from Slidegeeks today.

Data Monetization And Management Impact Of Data Monetization On Firm Growth Brochure PDF
This slide depicts information regarding the impact of organic growth in terms of increase in revenues and market share. Welcome to our selection of the Data Monetization And Management Impact Of Data Monetization On Firm Growth Brochure PDF. These are designed to help you showcase your creativity and bring your sphere to life. Planning and Innovation are essential for any business that is just starting out. This collection contains the designs that you need for your everyday presentations. All of our PowerPoints are 100 percent editable, so you can customize them to suit your needs. This multi-purpose template can be used in various situations. Grab these presentation templates today.

Big Data Management In Retail Industry Ppt Show Slideshow PDF
This slide represents the application of big data in the retail industry and how analytics created with the help of big data would be helpful to develop a 360 view of the customer. Deliver an awe inspiring pitch with this creative big data management in retail industry ppt show slideshow pdf bundle. Topics like market data, suppliers data, retailer data, retailer supplier can be discussed with this completely editable template. It is available for immediate download depending on the needs and requirements of the user.

Applications Of Big Data Analytics In Manufacturing Industry Formats PDF
This slide represents big data analytics applications in the manufacturing industry, including production optimization, maintenance regulation, quality checks, tool optimization, supply chain management, production preparation, yield improvement, market study, sustainable development, and risk evaluation. Boost your pitch with our creative Applications Of Big Data Analytics In Manufacturing Industry Formats PDF. Deliver an awe-inspiring pitch that will mesmerize everyone. Using these presentation templates you will surely catch everyones attention. You can browse the ppts collection on our website. We have researchers who are experts at creating the right content for the templates. So you do not have to invest time in any additional work. Just grab the template now and use them.
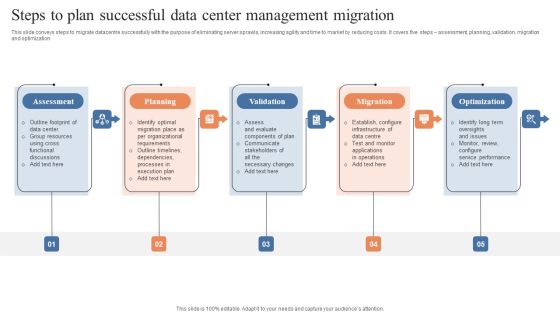
Steps To Plan Successful Data Center Management Migration Download PDF
This slide conveys steps to migrate datacentre successfully with the purpose of eliminating server sprawls, increasing agility and time to market by reducing costs. It covers five steps assessment, planning, validation, migration and optimization. Persuade your audience using this Steps To Plan Successful Data Center Management Migration Download PDF. This PPT design covers five stages, thus making it a great tool to use. It also caters to a variety of topics including Assessment, Planning, Validation. Download this PPT design now to present a convincing pitch that not only emphasizes the topic but also showcases your presentation skills.
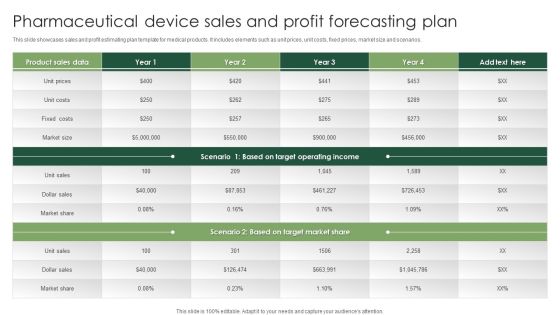
Pharmaceutical Device Sales And Profit Forecasting Plan Summary PDF
This slide showcases sales and profit estimating plan template for medical products. It includes elements such as unit prices, unit costs, fixed prices, market size and scenarios. Pitch your topic with ease and precision using this Pharmaceutical Device Sales And Profit Forecasting Plan Summary PDF. This layout presents information on Pharmaceutical Device, Sales And Profit, Forecasting Plan. It is also available for immediate download and adjustment. So, changes can be made in the color, design, graphics or any other component to create a unique layout.

Forecasting Multiverse Size By Various Components Structure PDF
Following slide showcases predicted metaverse market growth in recent years to determine future business opportunities. It includes elements such as social media ads, live entertainment, gaming hardware, gaming software and services, augmented reality and virtual reality. Showcasing this set of slides titled Forecasting Multiverse Size By Various Components Structure PDF. The topics addressed in these templates are Forecasting Multiverse Size, Various Components. All the content presented in this PPT design is completely editable. Download it and make adjustments in color, background, font etc. as per your unique business setting.
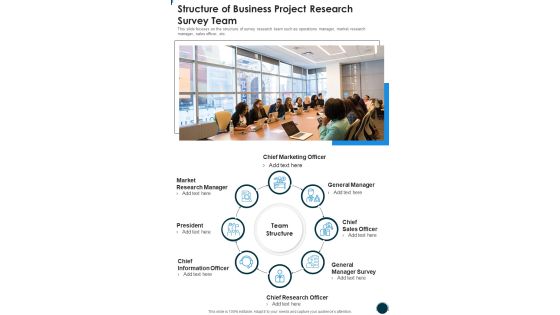
Structure Of Business Project Research Survey Team One Pager Sample Example Document
This slide focuses on the structure of survey research team such as operations manager, market research manager, sales officer, etc. Presenting you an exemplary Structure Of Business Project Research Survey Team One Pager Sample Example Document. Our one-pager comprises all the must-have essentials of an inclusive document. You can edit it with ease, as its layout is completely editable. With such freedom, you can tweak its design and other elements to your requirements. Download this Structure Of Business Project Research Survey Team One Pager Sample Example Document brilliant piece now.

Big Data Management In Retail Industry Ppt PowerPoint Presentation File Styles PDF
This slide represents the application of big data in the retail industry and how analytics created with the help of big data would be helpful to develop a 360 view of the customer. Deliver an awe inspiring pitch with this creative Big Data Management In Retail Industry Ppt PowerPoint Presentation File Styles PDF bundle. Topics like Market Data, Supplier Data, Retailer Data can be discussed with this completely editable template. It is available for immediate download depending on the needs and requirements of the user.
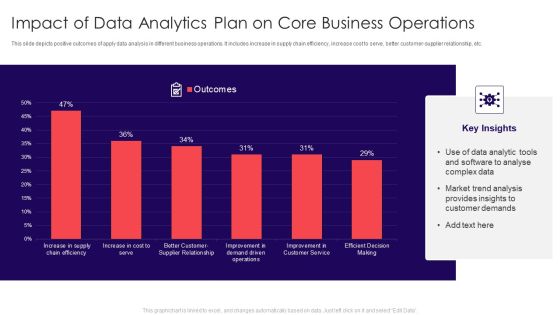
Impact Of Data Analytics Plan On Core Business Operations Summary PDF
This slide depicts positive outcomes of apply data analysis in different business operations. It includes increase in supply chain efficiency, increase cost to serve, better customer-supplier relationship, etc. Showcasing this set of slides titled Impact Of Data Analytics Plan On Core Business Operations Summary PDF. The topics addressed in these templates are Customer Demands, Market Trend Analysis, Complex Data. All the content presented in this PPT design is completely editable. Download it and make adjustments in color, background, font etc. as per your unique business setting.

Information Science Data Science In Business Sector Ppt PowerPoint Presentation Pictures Layout Ideas PDF
This slide represents the data science application in business and its benefits, such as gaining customer insights, increased security, streamlining manufacturing, and predicting future market trends.Presenting Information Science Data Science In Business Sector Ppt PowerPoint Presentation Pictures Layout Ideas PDF to provide visual cues and insights. Share and navigate important information on five stages that need your due attention. This template can be used to pitch topics like Customer Insights, Internal Finances, Streamline Manufacturing. In addtion, this PPT design contains high resolution images, graphics, etc, that are easily editable and available for immediate download.
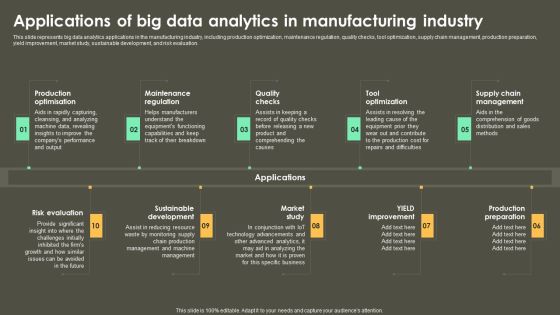
Iot Integration In Manufacturing Applications Of Big Data Analytics In Manufacturing Industry Inspiration PDF
This slide represents big data analytics applications in the manufacturing industry, including production optimization, maintenance regulation, quality checks, tool optimization, supply chain management, production preparation, yield improvement, market study, sustainable development, and risk evaluation. Want to ace your presentation in front of a live audience Our Iot Integration In Manufacturing Applications Of Big Data Analytics In Manufacturing Industry Inspiration PDF can help you do that by engaging all the users towards you.. Slidegeeks experts have put their efforts and expertise into creating these impeccable powerpoint presentations so that you can communicate your ideas clearly. Moreover, all the templates are customizable, and easy-to-edit and downloadable. Use these for both personal and commercial use.
Transforming Manufacturing With Automation Applications Of Big Data Analytics Icons PDF
This slide represents big data analytics applications in the manufacturing industry, including production optimization, maintenance regulation, quality checks, tool optimization, supply chain management, production preparation, yield improvement, market study, sustainable development, and risk evaluation. There are so many reasons you need a Transforming Manufacturing With Automation Applications Of Big Data Analytics Icons PDF. The first reason is you cannot spend time making everything from scratch, Thus, Slidegeeks has made presentation templates for you too. You can easily download these templates from our website easily.

Forecasted Number Of Passenger Kilometer In Three Different Scenario Elements PDF
The slide shows the line graph comparison of forecasted number of passenger kilometer in three different market scenarios Positive, Average and Negative. The value is provided for the six years 2019-2024, along with CAGR in each scenario. Deliver an awe inspiring pitch with this creative forecasted number of passenger kilometer in three different scenario elements pdf bundle. Topics like forecasted number of passenger kilometer in three different scenario can be discussed with this completely editable template. It is available for immediate download depending on the needs and requirements of the user.

Forecasted Number Of Passenger Kilometer In Three Different Scenario Themes PDF
The slide shows the line graph comparison of forecasted number of passenger kilometer in three different market scenarios Positive, Average and Negative. The value is provided for the six years 2019-2024, along with CAGR in each scenario. Deliver and pitch your topic in the best possible manner with this forecasted number of passenger kilometer in three different scenario themes pdf. Use them to share invaluable insights on forecasted number of passenger kilometer in three different scenario and impress your audience. This template can be altered and modified as per your expectations. So, grab it now.

Forecasted Number Of Passenger Kilometer In Three Different Scenario Background PDF
The slide shows the line graph comparison of forecasted number of passenger kilometer in three different market scenarios Positive, Average and Negative. The value is provided for the six years 2019 to 2024, along with CAGR in each scenario.Deliver and pitch your topic in the best possible manner with this forecasted number of passenger kilometer in three different scenario background pdf. Use them to share invaluable insights on forecasted number of passenger kilometer in three different scenario and impress your audience. This template can be altered and modified as per your expectations. So, grab it now.
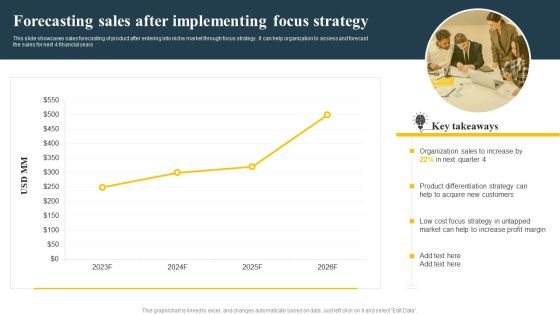
Forecasting Sales After Implementing Focus Strategy Implementing Focus Strategy To Improve Elements PDF
This slide showcases sales forecasting of product after entering into niche market through focus strategy. It can help organization to assess and forecast the sales for next 4 financial years.Want to ace your presentation in front of a live audience Our Forecasting Sales After Implementing Focus Strategy Implementing Focus Strategy To Improve Elements PDF can help you do that by engaging all the users towards you.. Slidegeeks experts have put their efforts and expertise into creating these impeccable powerpoint presentations so that you can communicate your ideas clearly. Moreover, all the templates are customizable, and easy-to-edit and downloadable. Use these for both personal and commercial use.
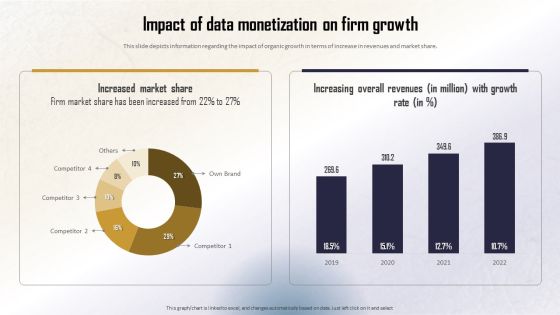
Identifying Direct And Indirect Impact Of Data Monetization On Firm Growth Inspiration PDF
This slide depicts information regarding the impact of organic growth in terms of increase in revenues and market share. This modern and well-arranged Identifying Direct And Indirect Impact Of Data Monetization On Firm Growth Inspiration PDF provides lots of creative possibilities. It is very simple to customize and edit with the Powerpoint Software. Just drag and drop your pictures into the shapes. All facets of this template can be edited with Powerpoint, no extra software is necessary. Add your own material, put your images in the places assigned for them, adjust the colors, and then you can show your slides to the world, with an animated slide included.

Forecasted Number Of Passenger Kilometer In Three Different Scenario Slides PDF
The slide shows the line graph comparison of forecasted number of passenger kilometer in three different market scenarios Positive, Average and Negative. The value is provided for the six years 2019 to 2024, along with CAGR in each scenario.Deliver an awe-inspiring pitch with this creative forecasted number of passenger kilometer in three different scenario slides pdf. bundle. Topics like total number of passenger kilometer, 2019 to 2024 can be discussed with this completely editable template. It is available for immediate download depending on the needs and requirements of the user.

Application Internet Of Things Industry Forecast And Growth Analysis Brochure PDF
The following slide displays application internet of things market review with growth estimates to analyze potential opportunities and threats for the company. It includes estimation on the basis of region, technology, top. Showcasing this set of slides titled Application Internet Of Things Industry Forecast And Growth Analysis Brochure PDF. The topics addressed in these templates are Application Internet, Things Industry, Forecast And Growth Analysis. All the content presented in this PPT design is completely editable. Download it and make adjustments in color, background, font etc. as per your unique business setting.

Online Payment Service Forecast For Digital Payment Industry Ppt Slides Samples PDF
Highlights five trends that should shape the payments industry in the year ahead, looking at how regulatory shifts, emerging technologies, and competition could impact the payments ecosystem. Presenting online payment service forecast for digital payment industry ppt slides samples pdf to provide visual cues and insights. Share and navigate important information on one stage that need your due attention. This template can be used to pitch topics like digitization, market size, e commerce. In addition, this PPT design contains high-resolution images, graphics, etc, that are easily editable and available for immediate download.

Automobile OEM Report With Forecasted Growth Rate Ppt PowerPoint Presentation File Background Images PDF
This slide showcases report that can help automobile companies to identify the growth rate of aftermarket area. It also showcases incremental growth and growth to be contributed by online channels. Pitch your topic with ease and precision using this automobile oem report with forecasted growth rate ppt powerpoint presentation file background images pdf. This layout presents information on incremental growth, billion dollars, growth, offline segment, market impact, expected growth in 2022. It is also available for immediate download and adjustment. So, changes can be made in the color, design, graphics or any other component to create a unique layout.
New Service Introduction Gantt Chart With Milestones Icons PDF
This slide showcases gantt. chart that can help organization to keep track of each milestone of service launch process. Its key elements are positioning statement, go to market strategy, shareholder communication and launch day campaign. Pitch your topic with ease and precision using this New Service Introduction Gantt Chart With Milestones Icons PDF. This layout presents information on Milestones, Assign Roles For Launch, Conduct Satisfaction Survey. It is also available for immediate download and adjustment. So, changes can be made in the color, design, graphics or any other component to create a unique layout.
