AI PPT Maker
Templates
PPT Bundles
Design Services
Business PPTs
Business Plan
Management
Strategy
Introduction PPT
Roadmap
Self Introduction
Timelines
Process
Marketing
Agenda
Technology
Medical
Startup Business Plan
Cyber Security
Dashboards
SWOT
Proposals
Education
Pitch Deck
Digital Marketing
KPIs
Project Management
Product Management
Artificial Intelligence
Target Market
Communication
Supply Chain
Google Slides
Research Services
 One Pagers
All Categories
-
Home
- Customer Favorites
- Marketing Statistics
Marketing Statistics
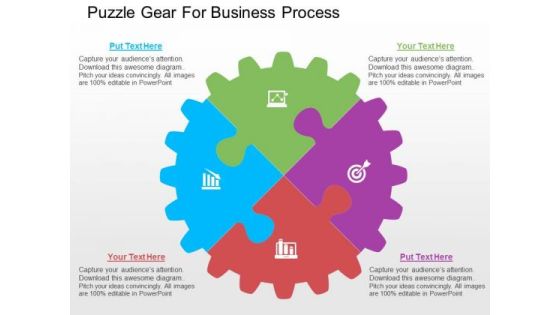
Puzzle Gear For Business Process PowerPoint Templates
Our above PPT slide contains circular gear puzzle diagram. This puzzle gear circular diagram helps to exhibit process planning and solutions. Use this diagram to impart more clarity to data and to create more sound impact on viewers.
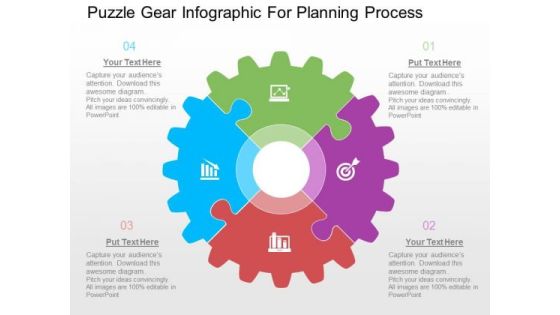
Puzzle Gear Infographic For Planning Process PowerPoint Templates
Our above PPT slide contains circular gear puzzle diagram. This puzzle gear circular diagram helps to exhibit process planning and solutions. Use this diagram to impart more clarity to data and to create more sound impact on viewers.

Battery Icons For Business Growth Levels Powerpoint Template
Levels of business growth can be displayed with this diagram. This PowerPoint template contains graphics of seven battery icons. You can use this design for data analysis in business presentations

Diamond Design With Two Levels And Eight Stages Powerpoint Template
Our above slide contains graphics of diamond design with two levels and eight stages. It helps to display concepts in visual manner. Use this diagram to impart more clarity to data and to create more sound impact on viewers.

Chart Of Four Business Steps Powerpoint Templates
This business diagram displays flow of four business steps. This editable slide is suitable to present growth management. Use this diagram for business and finance related topics and display complete data analysis in your presentation.

Four Tags For Strategy Planning Process Powerpoint Template
Steps for strategy planning can be explained with this diagram. This PowerPoint template contains diagram of four infographic tags. You can also use this design for data analysis in business presentations

3D Arrows Step Process Diagram Powerpoint Template
Our above slide contains graphics of arrows step process diagram. It helps to display innovative ideas. Use this diagram to impart more clarity to data and to create more sound impact on viewers.

Colorful Circle Arrow Design Powerpoint Template
Our above PPT slide contains circular arrow design. This business diagram helps to exhibit process flow. Use this diagram to impart more clarity to data and to create more sound impact on viewers.

Colorful Circle Arrow Diagram Powerpoint Template
Our above PPT slide contains circular arrow design. This business diagram helps to exhibit process flow. Use this diagram to impart more clarity to data and to create more sound impact on viewers.

Colorful Circular Arrows Diagram Powerpoint Template
Our above PPT slide contains circular arrow design. This business diagram helps to exhibit process flow. Use this diagram to impart more clarity to data and to create more sound impact on viewers.

Circular Diagram Of Cfl Bulbs Powerpoint Templates
This PowerPoint template has been designed with circular diagram of CFL bulbs. It helps to exhibit business strategies and ideas. Use this diagram to impart more clarity to data and to create more sound impact on viewers.
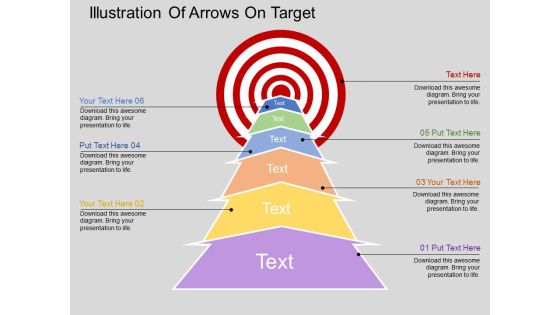
Illustration Of Arrows On Target Powerpoint Templates
Our above slide illustrates arrow steps towards target. This PowerPoint template may be used to exhibit target planning. Use this diagram to impart more clarity to data and to create more sound impact on viewers.
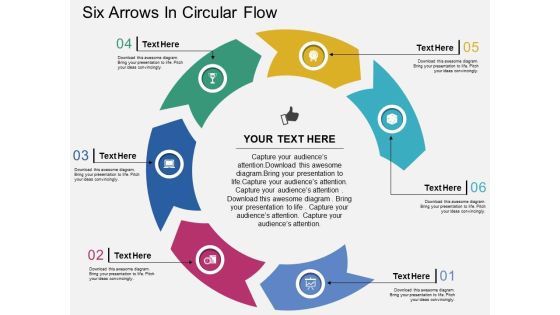
Six Arrows In Circular Flow Powerpoint Templates
Our above PPT slide contains graphics of circular diagram. This business diagram helps to display outline of business plan. Use this template to impart more clarity to data and to create more sound impact on viewers.
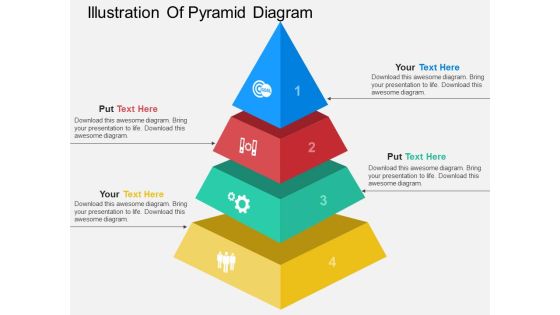
Illustration Of Pyramid Diagram Powerpoint Template
This PowerPoint slide contains illustration of pyramid diagram. This professional slide may be used for visual explanation of data. Adjust the above diagram in your business presentations to give professional impact.
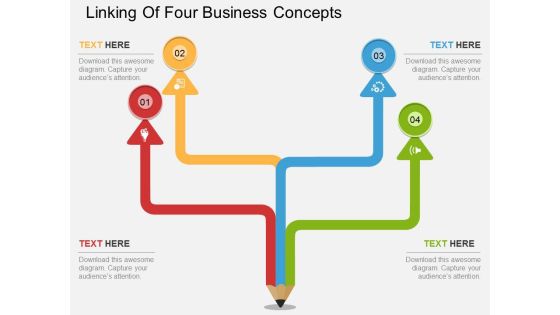
Linking Of Four Business Concepts Powerpoint Template
This PowerPoint template has been designed with four steps pencil diagram. This diagram is excellent visual tools to present link of steps. Download this PPT slide to explain complex data immediately and clearly.

Diagram Of Colorful Circular Arrows Powerpoint Template
Our above PPT slide contains circular arrow design. This business diagram helps to exhibit process flow. Use this diagram to impart more clarity to data and to create more sound impact on viewers.
Four Arrows Design With Icons Powerpoint Template
The above PowerPoint slide displays four arrows design with icons. This PowerPoint diagram helps to summarize complex business data. Adjust the above diagram in your business presentations to visually support your content.

Four Arrows Tags Infographics Powerpoint Template
The above PowerPoint slide displays four arrows design with icons. This PowerPoint diagram helps to summarize complex business data. Adjust the above diagram in your business presentations to visually support your content.
Four Banners With Business Icons Powerpoint Template
The above PowerPoint slide displays four banners with icons. This PowerPoint diagram helps to summarize complex business data. Adjust the above diagram in your business presentations to visually support your content.
Four Banners With Finance Growth Icons Powerpoint Template
The above PowerPoint slide displays four banners with finance growth icons. This PowerPoint diagram helps to summarize complex business data. Adjust the above diagram in your business presentations to visually support your content.
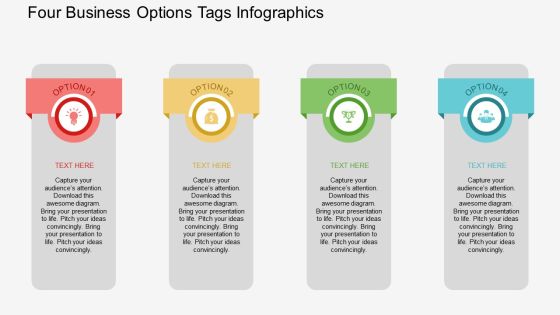
Four Business Options Tags Infographics Powerpoint Template
The above PowerPoint slide displays four options tags infographic. This PowerPoint diagram helps to summarize complex business data. Adjust the above diagram in your business presentations to visually support your content.
Four Colored Arrow Tags With Icons Powerpoint Template
The above PowerPoint slide displays four colored arrow tags with icons. This PowerPoint diagram helps to summarize complex business data. Adjust the above diagram in your business presentations to visually support your content.
Four Colorful Circle Tags With Icons Powerpoint Template
The above PowerPoint slide displays four colorful circle tags with icons. This PowerPoint diagram helps to summarize complex business data. Adjust the above diagram in your business presentations to visually support your content.

Arrows Infographic For Strategic Management Concept Powerpoint Template
Our above PPT slide contains four curved arrows infographic design. This business diagram helps to depict business information for strategic management. Use this diagram to impart more clarity to data and to create more sound impact on viewers.

Four Steps Circular Infographic Powerpoint Slides
This innovative, stunningly beautiful dashboard has been designed for data visualization. It contains circular infographic design. This PowerPoint template helps to display your information in a useful, simple and orderly way.
Six Staged Infographics Square With Business Icons Powerpoint Templates
This business diagram displays circular puzzle infographic. This editable slide is suitable to present global communication. Use this diagram for business and finance related topics and display complete data analysis in your presentation.

Four Circular Steps Process Infographics Powerpoint Template
This PowerPoint slide contains circular steps process infographic. This professional slide may be used for visual explanation of data. Adjust the above diagram in your business presentations to give professional impact.

Four Horizontal Text Banners Powerpoint Template
This PowerPoint template has been designed with four horizontal text banners. This diagram is excellent visual tools for business presentations. Download this PPT slide to explain complex data immediately and clearly.
Four Sequential Boxes And Icons Diagram Powerpoint Template
This PowerPoint template has been designed with four sequential boxes and icons. This diagram is excellent visual tools for business presentations. Download this PPT slide to explain complex data immediately and clearly.
Four Sequential Text Banners With Icons Powerpoint Template
This PowerPoint template has been designed with four sequential text banners and icons. This diagram is excellent visual tools for business presentations. Download this PPT slide to explain complex data immediately and clearly.
Four Text Boxes With Icons Powerpoint Templates
This Business diagram can be used to display data, business information etc. You can easily customize this PowerPoint template as per your need. Capture the attention of your audience.

Pyramid For Financial Accounting Information Powerpoint Slides
This PowerPoint template has been designed with graphics of pyramid chart. This PPT slide can be used to prepare presentations for profit growth report and also for financial data analysis. You can download finance PowerPoint template to prepare awesome presentations.
Linear Circles Of Timeline With Icons Powerpoint Template
Our above slide contains linear timeline diagram. This PowerPoint template helps to display circle steps in linear flow. Use this diagram to impart more clarity to data and to create more sound impact on viewers.
Profit Growth Bars With Icons And Mouse Powerpoint Template
Our above slide contains graphics of profit growth bars with icons. This PowerPoint template helps to display outline of business plan. Use this diagram to impart more clarity to data and to create more sound impact on viewers.
Linear Arrow Process Diagram With Icons Powerpoint Template
This business slide has been designed with infographic of linear arrow. This arrow infographic can be used for data representation. Use this diagram for your business presentations. Build a quality presentation for your viewers with this unique diagram.
Four Tags With Mobile And Icons Powerpoint Template
Our above PPT slide contains graphics mobile with four tags and icons. This business diagram helps to display technology and communication concepts. Use this template to impart more clarity to data and to create more sound impact on viewers.
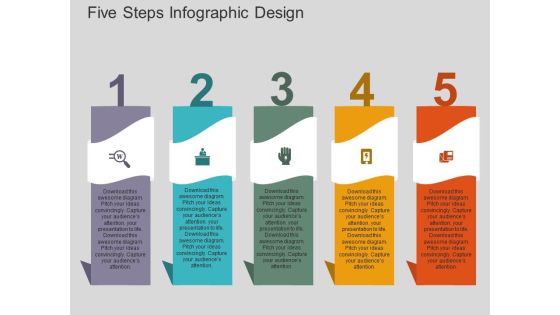
Five Steps Infographic Design Powerpoint Templates
Our above slide contains graphics of six hands around bulb. It helps to display steps of idea planning. Use this diagram to impart more clarity to data and to create more sound impact on viewers.
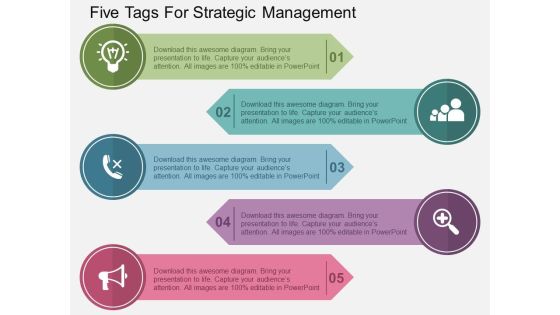
Five Tags For Strategic Management Powerpoint Templates
Our above slide contains diagram of circular infographic. It helps to exhibit six steps of goal planning. Use this diagram to impart more clarity to data and to create more sound impact on viewers.

Four Steps Circular Infographic Powerpoint Templates
Our above slide contains diagram of three stage circular infographic. It helps to display global business analysis. Use this diagram to impart more clarity to data and to create more sound impact on viewers.

Global Shipping And Finance Services Powerpoint Templates
Our above PPT slide contains triangles infographic. It helps to display outline of business plan. Use this diagram to impart more clarity to data and to create more sound impact on viewers.

Business People Profile For Social Media Powerpoint Slides
This PowerPoint template has been designed with business people profile information. This diagram is excellent visual tools to present team profile with social media. Download this PPT slide to explain complex data immediately and clearly.

Business Team About Us Page Powerpoint Slides
This PowerPoint template has been designed with team pictures and business icons. This diagram is excellent visual tools to present teams strategic planning. Download this PPT slide to explain complex data immediately and clearly.
Five Banners For Nature And Finance Process Flow Powerpoint Template
This PowerPoint template has been designed with five banners nature, finance icons. This diagram is excellent visual tools for business presentations. Download this PPT slide to explain complex data immediately and clearly.
Four Arrows For Different Process Representation Powerpoint Template
This PowerPoint template has been designed with graphics of four arrows This diagram is excellent visual tools for business presentations. Download this PPT slide to explain complex data immediately and clearly.

Curve Line Diagram With Icons Powerpoint Template
Our above slide contains diagram of curve line infographic. This infographic slide helps to exhibit business analysis. Use this diagram to impart more clarity to data and to create more sound impact on viewers.

Business Layer Presentation Background Images
This is a business layer presentation background images. This is a four stage process. The stages in this process are information technology infrastructure layer, data and information layer, software application layer, business layer.

Develop Financial Goals Presentation Slides
This is a develop financial goals presentation slides. This is a five stage process. The stages in this process are establish relationship, gather data, develop financial goals, analyze financial status, review proposed plan.\n\n
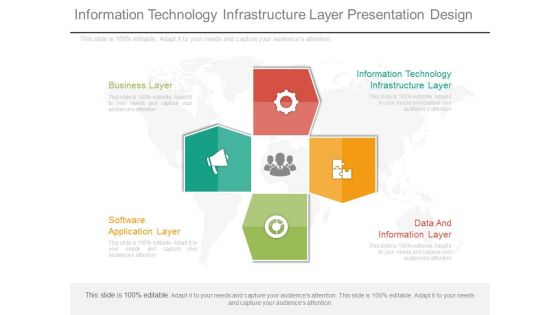
Information Technology Infrastructure Layer Presentation Design
This is an information technology infrastructure layer presentation design. This is a four stage process. The stages in this process are business layer, information technology infrastructure layer, data and information layer, software application layer.
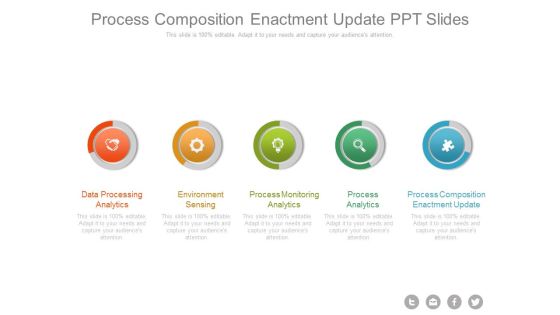
Process Composition Enactment Update Ppt Slides
This is a process composition enactment update ppt slides. This is a five stage process. The stages in this process are data processing analytics, environment sensing, process monitoring analytics, process analytics, process composition enactment update.

Competitor Analysis Strategic Applications Powerpoint Show
This is a competitor analysis strategic applications powerpoint show. This is a five stage process. The stages in this process are competitor analysis, implementation & monitoring, data acquisition, knowledge development tools, strategic applications.
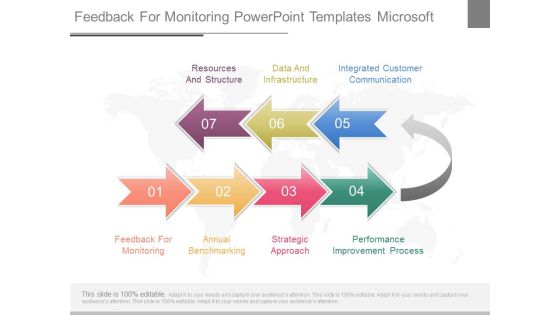
Feedback For Monitoring Powerpoint Templates Microsoft
This is a feedback for monitoring powerpoint templates microsoft. This is a seven stage process. The stages in this process are resources and structure, data and infrastructure, integrated customer communication, feedback for monitoring, annual benchmarking, strategic approach, performance improvement process.\n\n\n

Database Platform Powerpoint Slides Themes
This is a database platform powerpoint slides themes. This is a four stage process. The stages in this process are database platform, data warehouse platform, security and identity, development.

Deeper Learning Cultivator Ppt Slides Themes
This is a deeper learning cultivator ppt slides themes. This is a five stage process. The stages in this process are social emotional learning facilitator, data driven, lifelong learner, deeper learning cultivator, personalized learning architect.

Architecture Change Management Ppt Sample
This is a architecture change management ppt sample. This is a four stage process. The stages in this process are architecture change management, business solution, solution and application architecture, data architecture.

Representation To Other Executives Ppt Presentation
This is a representation to other executives ppt presentation. This is a four stage process. The stages in this process are data collection clerks, strong people skills, clear understand of overall change initiative, representation to other executives.
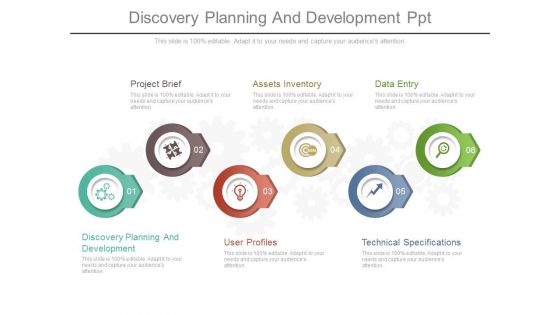
Discovery Planning And Development Ppt
This is a discovery planning and development ppt. This is a five stage process. The stages in this process are project brief, assets inventory, data entry, discovery planning and development, user profiles, technical specifications.
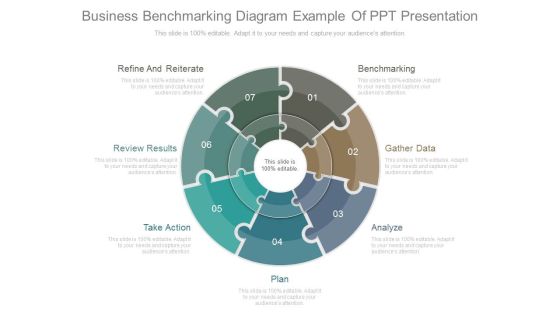
Business Benchmarking Diagram Example Of Ppt Presentation
This is a business benchmarking diagram example of ppt presentation. This is a seven stage process. The stages in this process are refine and reiterate, review results, take action, plan, analyze, gather data, benchmarking.

Technical Specifications Powerpoint Slide Presentation Tips
This is a technical specifications powerpoint slide presentation tips. This is a seven stage process. The stages in this process are discovery planning and development, project brief, user profiles, assets inventory, technical specifications, data entry.
Making System Example Of Ppt Presentation
This is a making system example of ppt presentation. This is a five stage process. The stages in this process are making system, student finance aid, provide grantee, provide insurance, collecting data.
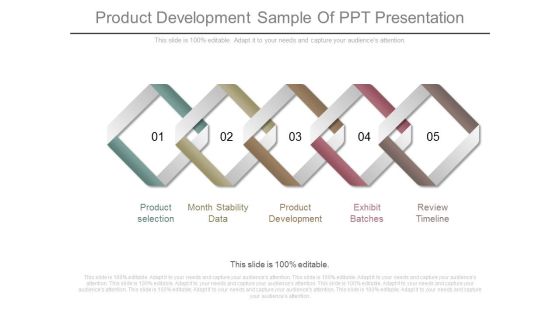
Product Development Sample Of Ppt Presentation
This is a product development sample of ppt presentation. This is a five stage process. The stages in this process are product selection, month stability data, product development, exhibit batches, review timeline.
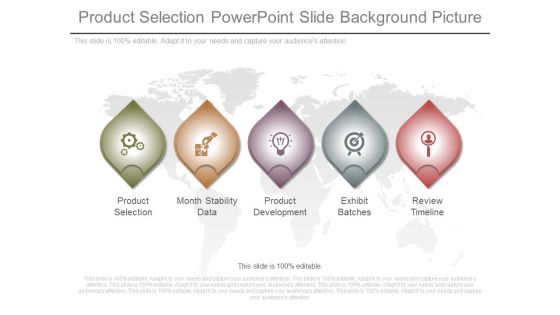
Product Selection Powerpoint Slide Background Picture
This is a product selection powerpoint slide background picture. This is a five stage process. The stages in this process are product selection, month stability data, product development, exhibit batches, review timeline.

Clear Understand Of Overall Change Initiative Ppt Example
This is a clear understand of overall change initiative ppt example. This is a four stage process. The stages in this process are representation to other executives, data collection clerks, clear understand of overall change initiative, strong people skills.

Real Time Business Intelligence Diagram Powerpoint Slide Ideas
This is a real time business intelligence diagram powerpoint slide ideas. This is a seven stage process. The stages in this process are data warehousing, reporting, analytics, datamining, qap, epr, benchmarking.

Research Business Intelligence Ppt Powerpoint Templates
This is a research business intelligence ppt powerpoint templates. This is a seven stage process. The stages in this process are data warehousing, reporting, analytics, datamining, qap, epr, benchmarking.
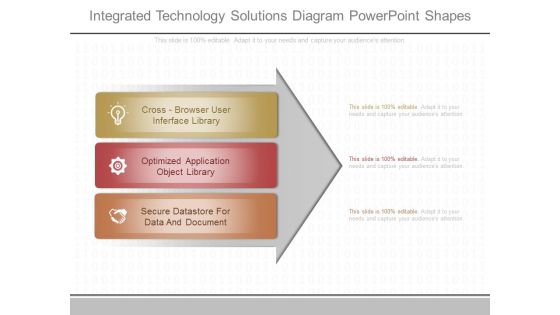
Integrated Technology Solutions Diagram Powerpoint Shapes
This is a integrated technology solutions diagram powerpoint shapes. This is a three stage process. The stages in this process are cross browser user interface library, optimized application object library, secure datastore for data and document.
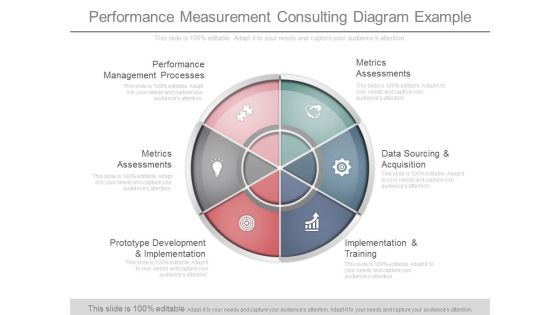
Performance Measurement Consulting Diagram Example
This is a performance measurement consulting diagram example. This is a six stage process. The stages in this process are performance management processes, metrics assessments, prototype development and implementation, metrics assessments, data sourcing and acquisition, implementation and training.

Mobile Relationship Management Diagram Presentation Powerpoint Templates
This is a mobile relationship management diagram presentation powerpoint templates. This is a four stage process. The stages in this process are strategy, execution, data, transaction, engagement, awareness, loyalty.
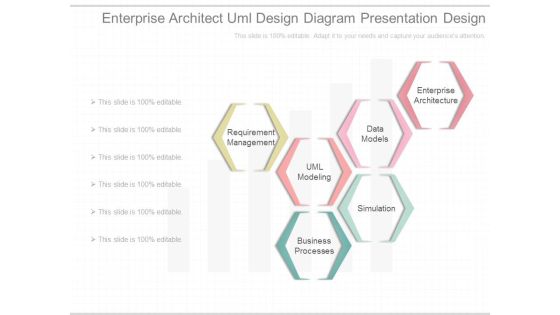
Enterprise Architect Uml Design Diagram Presentation Design
This is a enterprise architect uml design diagram presentation design. This is a six stage process. The stages in this process are requirement management, uml modeling, data models, business processes, simulation, enterprise architecture.

Sample Of Dbms Model Diagram Powerpoint Slides
This is a sample of dbms model diagram powerpoint slides. This is a one stage process. The stages in this process are applications, sql, query processor, buffer manager, disk space and io manage, data files, logs, index structure.
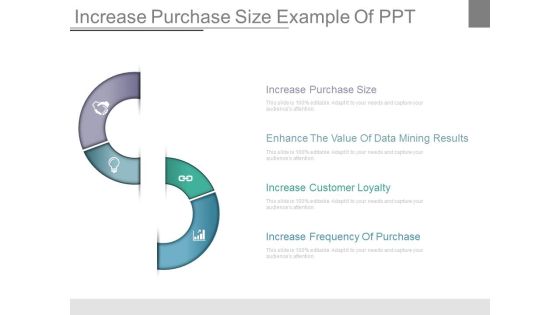
Increase Purchase Size Example Of Ppt
This is a increase purchase size example of ppt. This is a four stage process. The stages in this process are increase purchase size, enhance the value of data mining results, increase customer loyalty, increase frequency of purchase.
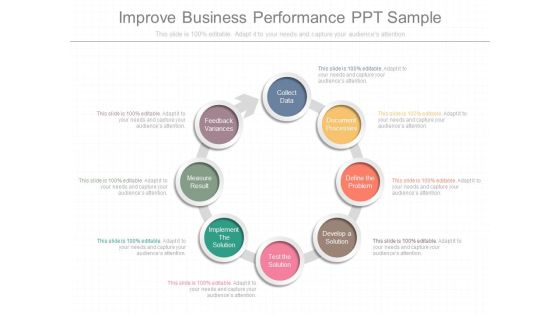
Improve Business Performance Ppt Sample
This is a improve business performance ppt sample. This is a eight stage process. The stages in this process are feedback variances, measure result, implement the solution, test the solution, develop a solution, define the problem, document processes, collect data.

Determining Sample Size Example Layout Presentation Backgrounds
This is a determining sample size example layout presentation backgrounds. This is a three stage process. The stages in this process are data, information on all important variables, limitations, introduction, sample.

Accounting Cost Information Layout Powerpoint Templates
This is a accounting cost information layout powerpoint templates. This is a six stage process. The stages in this process are true costs, coat accounting, estimating, hourly cost rates, plant data collection, management system, production standards.
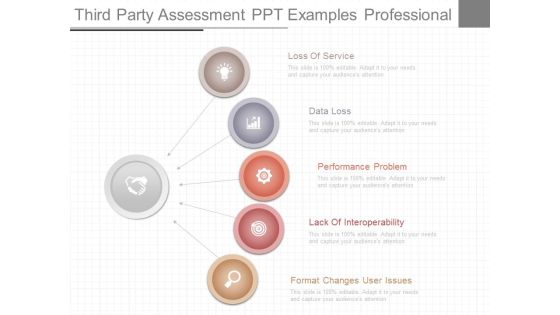
Third Party Assessment Ppt Examples Professional
This is a Third Party Assessment Ppt Examples Professional. This is a five stage process. The stages in this process are data loss, performance problem, lack of interoperability, format changes user issues.
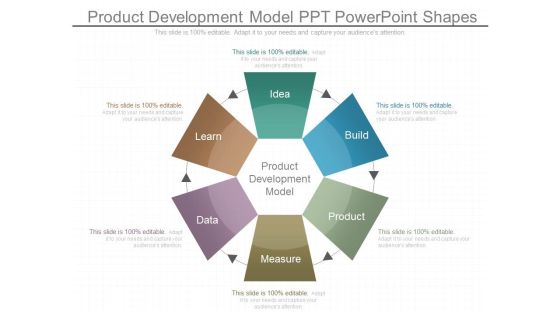
Product Development Model Ppt Powerpoint Shapes
This is a product development model ppt powerpoint shapes. This is a six stage process. The stages in this process are learn, data, idea, build, product, measure, product development model.
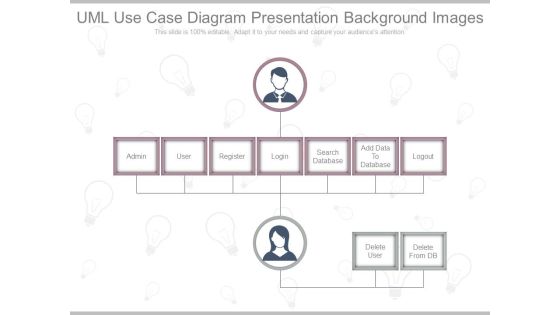
Uml Use Case Diagram Presentation Background Images
This is a uml use case diagram presentation background images. This is a seven stage process. The stages in this process are admin, user, register, login, search database, add data to database, logout.

Web Based Sale Solution Diagram Powerpoint Guide
This is a web based sale solution diagram powerpoint guide. This is a six stage process. The stages in this process are fool proof inventory, real time visibility, increased availability, zero maintenance, easy data administration, secure offline.
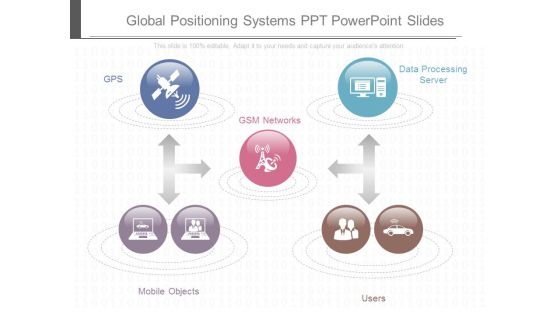
Global Positioning Systems Ppt Powerpoint Slides
This is a global positioning systems ppt powerpoint slides. This is a five stage process. The stages in this process are gps, data processing server, gsm networks, mobile objects, users.

Finance Operations Planning Sample Diagram Ppt Example
This is a finance operations planning sample diagram ppt example. This is a six stage process. The stages in this process are consolidation, analytics, corporate, external reporting, business unit, data preparation and transfer, ledger close, management reporting.\n\n\n\n\n\n\n\n\n \n

Storage Resource Management Ppt Slides
This is a storage resource management ppt slides. This is a one stage process. The stages in this process are data collection, analysis report generation, qsm repository, threshold checker, presentation.\n\n\n\n\n\n

Database Layout Tool Diagram Presentation Visuals
This is a database layout tool diagram presentation visuals. This is a three stage process. The stages in this process are database concepts, data modeling, database layout tool, database design.\n\n\n\n

Outputs And Methodology Ppt Background
This is a outputs and methodology ppt background. This is a six stage process. The stages in this process are jump start, preliminary insights, cautions and anomalies, learning moments, outputs and methodology, data checks and suggestions.
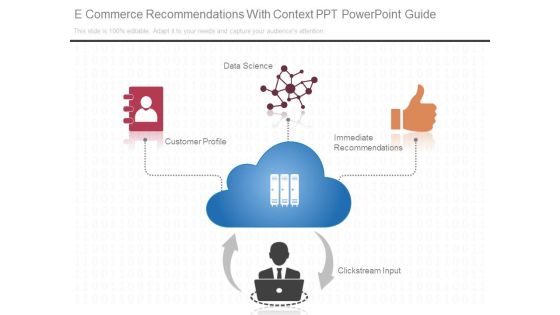
E Commerce Recommendations With Context Ppt Powerpoint Guide
This is a e commerce recommendations with context ppt powerpoint guide. This is a four stage process. The stages in this process are data science, customer profile, immediate recommendations, clickstream input.

Feedback Management Diagram Powerpoint Slide Themes
This is a feedback management diagram powerpoint slide themes. This is a seven stage process. The stages in this process are phone, ivr, web, social media, face to face, email, data base operational and customer, enterprises feedback management.
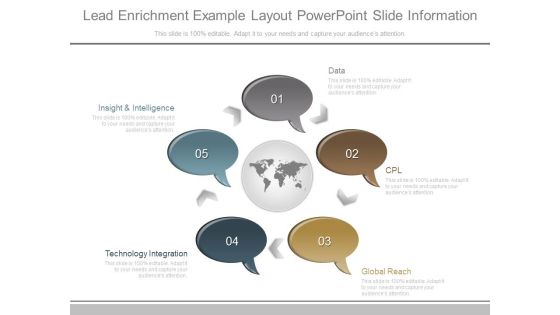
Lead Enrichment Example Layout Powerpoint Slide Information
This is a lead enrichment example layout powerpoint slide information. This is a five stage process. The stages in this process are data, cpl, global reach, technology integration, insight and intelligence.
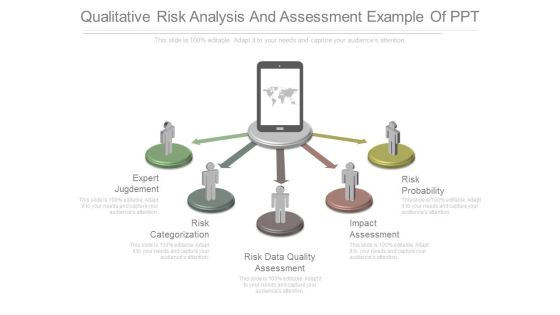
Qualitative Risk Analysis And Assessment Example Of Ppt
This is a qualitative risk analysis and assessment example of ppt. This is a five stage process. The stages in this process are expert jugdement, risk categorization, risk data quality assessment, impact assessment, risk probability.
E Business Architecture Planning Example Powerpoint Templates
This is a e business architecture planning example powerpoint templates. This is a four stage process. The stages in this process are technology architecture, data architecture, business architecture, application architecture.

Consumer Finance Program Process Ppt Presentation Slides
This is a consumer finance program process ppt presentation slides. This is a one stage process. The stages in this process are bank a, bank b, data, comparison app a, comparison app b.
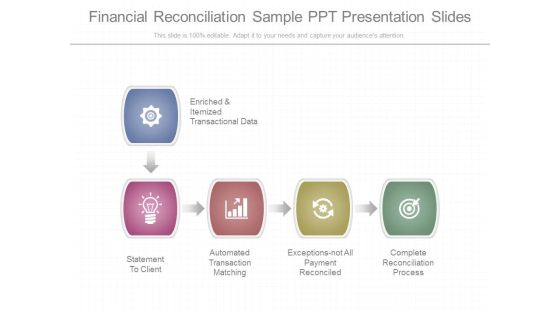
Financial Reconciliation Sample Ppt Presentation Slides
This is a financial reconciliation sample ppt presentation slides. This is a five stage process. The stages in this process are enriched and itemized transactional data, statement to client, automated transaction matching, exceptions not all payment reconciled, complete reconciliation process.\n\n\n\n\n\n\n\n\n\n\n\n\n\n\n\n\n\n
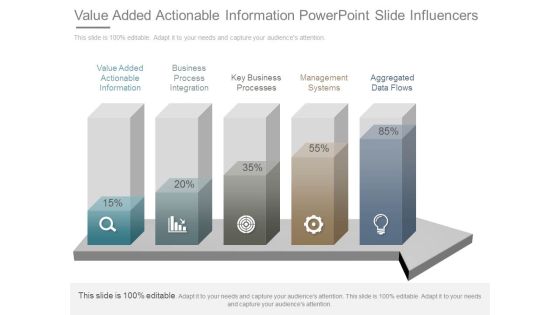
Value Added Actionable Information Powerpoint Slide Influencers
This is a value added actionable information powerpoint slide influencers. This is a five stage process. The stages in this process are value added actionable information, business process integration, key business processes , management systems, aggregated data flows.

Customer Experience Management Strategy Ppt Powerpoint Image
This is a customer experience management strategy ppt powerpoint image. This is a eight stage process. The stages in this process are customer touch point, segment mg, billing, tariffs and pricing, social media, network, big data analytics, crm.

Negotiation Skills In Sales Powerpoint Guide
This is a negotiation skills in sales powerpoint guide. This is a five stage process. The stages in this process are handling information strategically, maintaining composure, developing data, refocusing the discussion, being creative.
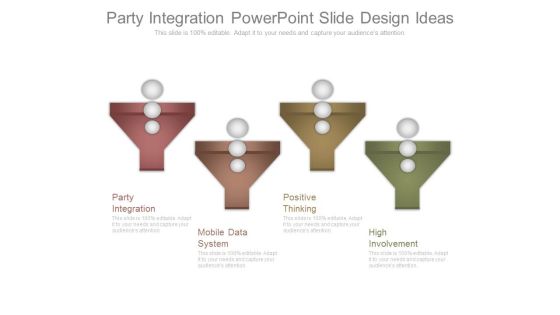
Party Integration Powerpoint Slide Design Ideas
This is a party integration powerpoint slide design ideas. This is a four stage process. The stages in this process are party integration, mobile data system, positive thinking, high involvement.

Positive Thinking Powerpoint Slide Designs Download
This is a positive thinking powerpoint slide designs download. This is a four stage process. The stages in this process are party integration, positive thinking, mobile data system, high involvement.

Factual Approach Mutually Beneficial Powerpoint Presentation
This is a factual approach mutually beneficial powerpoint presentation. This is a six stage process. The stages in this process are factual approach mutually beneficial, data and information, project management plan, understand their needs, tools and technology, stakeholder register.

Alternative Workplace Strategy Diagram Ppt Sample
This is a alternative workplace strategy diagram ppt sample. This is a five stage process. The stages in this process are data exploration, develop the strategy, build a business case, develop implement, evaluate and improve.

Higher Proposal Win Rate Presentation Background Images
This is a higher proposal win rate presentation background images. This is a four stage process. The stages in this process are higher proposal win rate, faster follow up, sales feels supported, cost per lead data.
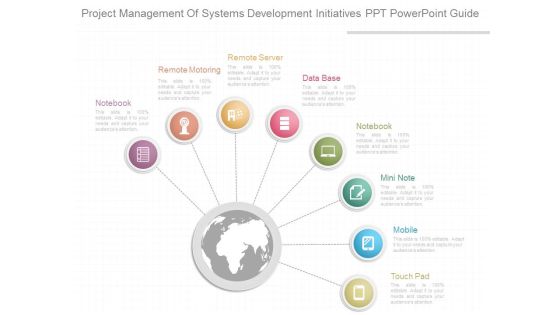
Project Management Of Systems Development Initiatives Ppt Powerpoint Guide
This is a project management of systems development initiatives ppt powerpoint guide. This is a eight stage process. The stages in this process are notebook, remote motoring, remote server, data base, mini note, mobile, touch pad.
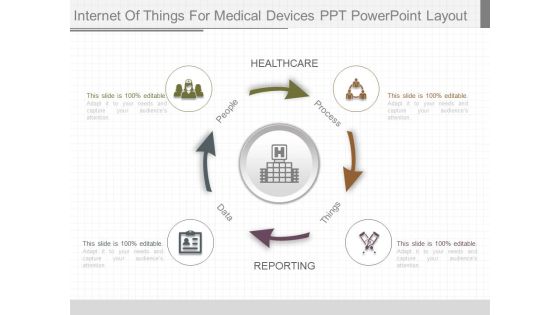
Internet Of Things For Medical Devices Ppt Powerpoint Layout
This is a internet of things for medical devices ppt powerpoint layout. This is a four stage process. The stages in this process are healthcare, reporting, data, things, people, process.

Business Intelligence Knowledge Management Ppt Summary
This is a business intelligence knowledge management ppt summary. This is a eight stage process. The stages in this process are business process, knowledge, information, decision, action, data, business context, collaboration.
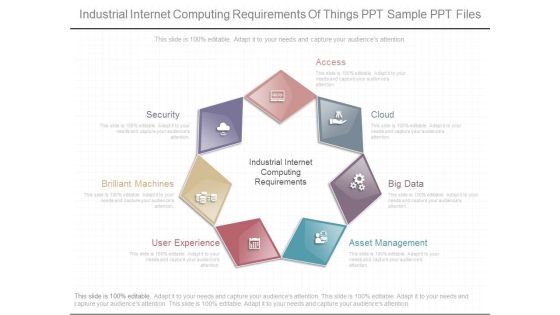
Industrial Internet Computing Requirements Of Things Ppt Sample Ppt Files
This is a industrial internet computing requirements of things ppt sample ppt files. This is a seven stage process. The stages in this process are industrial internet computing requirements, brilliant machines, user experience, asset management, big data, cloud, access, security.

Demand Driven Margin Optimization Ppt Powerpoint Slide Presentation Sample
This is a demand driven margin optimization ppt powerpoint slide presentation sample. This is a four stage process. The stages in this process are data management, demand modeling and segmentation, price optimization, monitoring and recalibration.

Business Intelligence Pillar Diagram Powerpoint Presentation
This is a business intelligence pillar diagram powerpoint presentation. This is a three stage process. The stages in this process are business intelligence strategy, business process strategy, data strategy, technology strategy.
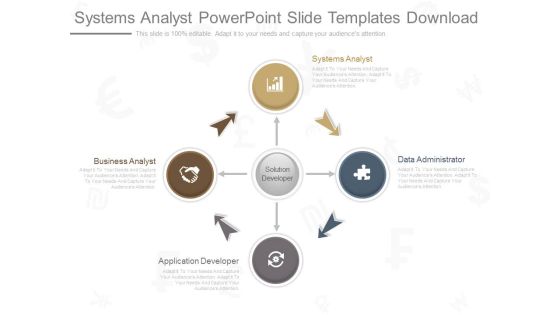
Systems Analyst Powerpoint Slide Templates Download
This is a systems analyst powerpoint slide templates download. This is a four stage process. The stages in this process are solution developer, business analyst, application developer, data administrator, systems analyst.

Cloud Technology Ecosystem And Tools Ppt Images Gallery
This is a cloud technology ecosystem and tools ppt images gallery. This is a nine stage process. The stages in this process are databases, storage, big four, specialized, infrastructure, data center, large analytic, service.

Corporate Knowledge Management System Ppt Powerpoint Guide
This is a corporate knowledge management system ppt powerpoint guide. This is a eight stage process. The stages in this process are extranets, document management, web conferencing, decision support systems, data warehouse, groupware, intranets, project management.
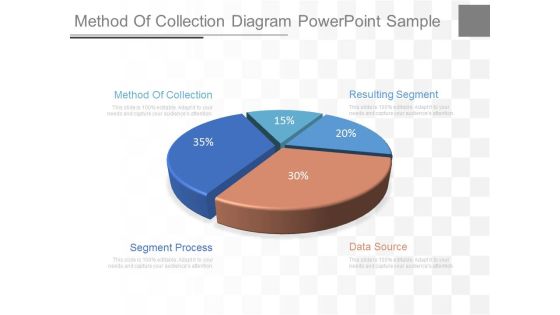
Method Of Collection Diagram Powerpoint Sample
This is a method of collection diagram powerpoint sample. This is a five stage process. The stages in this process are method of collection, segment process, data source, resulting segment.

Account Aggregation Document Management Presentation Portfolio
This is a account aggregation document management presentation portfolio. This is a nine stage process. The stages in this process are custodian, trading rebalancing, portfolio analytic reporting, account aggregation, data input tools, document management, portfolio accounting, financial planning, crm.

Organizational Effectiveness Model Powerpoint Slide Presentation
This is a organizational effectiveness model powerpoint slide presentation. This is a six stage process. The stages in this process are leadership, strategic planning, structure, human resources, business processes, data analysis, customer service and performance results.
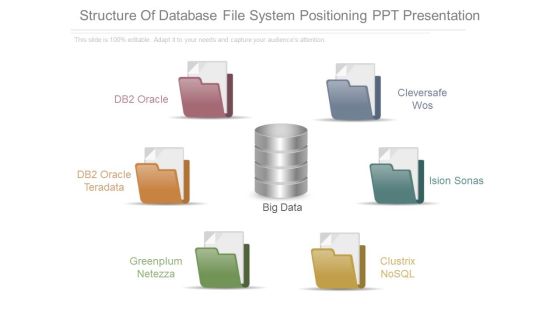
Structure Of Database File System Positioning Ppt Presentation
This is a structure of database file system positioning ppt presentation. This is a six stage process. The stages in this process are db2 oracle, db2 oracle teradata, greenplum netezza, big data, cleversafe wos, ision sonas, clustrix nosql.

It Infrastructures Development Example Powerpoint Slides
This is a it infrastructures development example powerpoint slides. This is a five stage process. The stages in this process are application and desktop delivery, network infrastructure, data center management, storage, it security, virtualization.

Financial Services Crm Presentation Visual Aids
This is a financial services crm presentation visual aids. This is a five stage process. The stages in this process are account aggregation, financial planning, crm, data input tools, document management, portfolio accounting, custodian, trading rebalancing, portfolio analytics reporting.

Customer Value Management Framework Diagram Ppt Example 2015
This is a customer value management framework diagram ppt example 2015. This is a seven stage process. The stages in this process are closed loop cvm process, evaluate campaigns, generate insights, price, analyze data, service, product, execute campaigns.
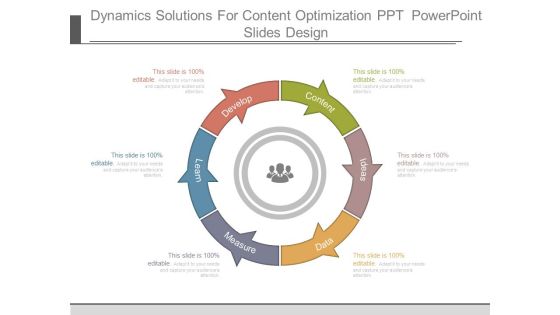
Dynamics Solutions For Content Optimization Ppt Powerpoint Slides Design
This is a dynamics solutions for content optimization ppt powerpoint slides design. This is a six stage process. The stages in this process are develop, learn, measure, data, ideas, content.

Process Of Web Security Testing And Analysis Ppt Design
This is a process of web security testing and analysis ppt design. This is a six stage process. The stages in this process are error handing, controlled access, session management, network security, server and code management, data access.
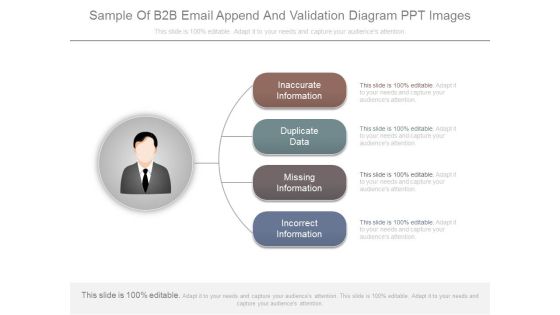
Sample Of B2b Email Append And Validation Diagram Ppt Images
This is a sample of b2b email append and validation diagram ppt images. This is a four stage process. The stages in this process are inaccurate information, duplicate data, missing information, incorrect information.
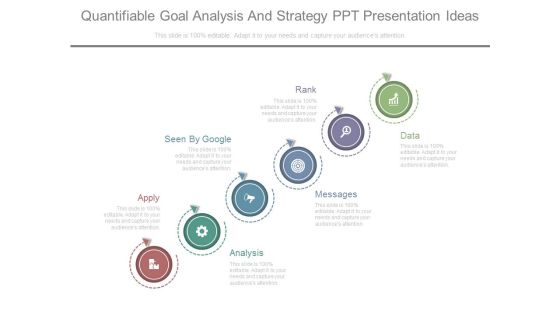
Quantifiable Goal Analysis And Strategy Ppt Presentation Ideas
This is a quantifiable goal analysis and strategy ppt presentation ideas. This is a six stage process. The stages in this process are apply, seen by google, rank, analysis, messages, data.

User Experience Management With Database Diagram Slides
This is a user experience management with database diagram slides. This is a six stage process. The stages in this process are web, harvesting, text database, linguistic analysis, refinement, fact database, data analysis, web ui, alerts, api, user experience.

Sample Of Three Types Of Internet Of Things Diagram Ppt Slides
This is a sample of three types of internet of things diagram ppt slides. This is a three stage process. The stages in this process are things with networked sensors, analytic engines, data storage.
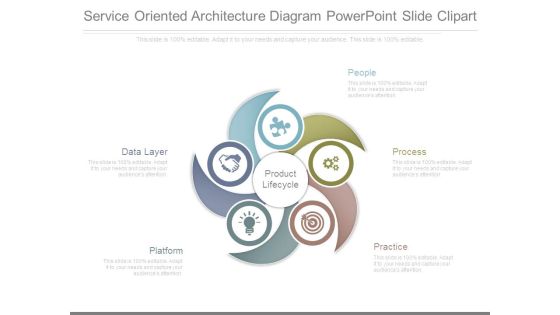
Service Oriented Architecture Diagram Powerpoint Slide Clipart
This is a service oriented architecture diagram powerpoint slide clipart. This is a five stage process. The stages in this process are product lifecycle, data layer, platform, people, process, practice.
